Natural Resources
Conservation Service
Ecological site R028AY022UT
Wet Fresh Streambank
Accessed: 11/21/2024
General information
Provisional. A provisional ecological site description has undergone quality control and quality assurance review. It contains a working state and transition model and enough information to identify the ecological site.
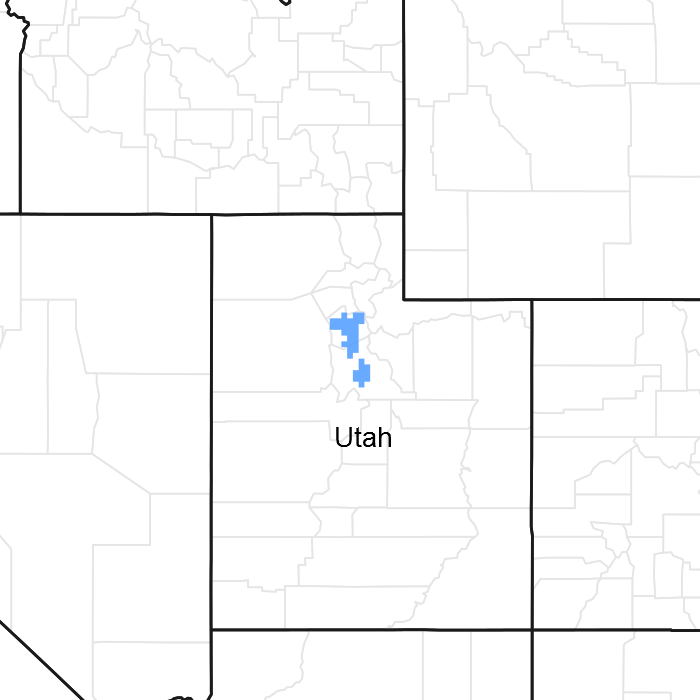
Figure 1. Mapped extent
Areas shown in blue indicate the maximum mapped extent of this ecological site. Other ecological sites likely occur within the highlighted areas. It is also possible for this ecological site to occur outside of highlighted areas if detailed soil survey has not been completed or recently updated.
Associated sites
R028AY012UT |
Semiwet Fresh Meadow |
---|---|
R028AY014UT |
Semiwet Fresh Streambank This site is also a similar site with soil and hydrology differentiae. |
R028AY020UT |
Wet Fresh Meadow |
Table 1. Dominant plant species
Tree |
Not specified |
---|---|
Shrub |
(1) Salix exigua |
Herbaceous |
Not specified |
Physiographic features
This site occurs on gentle to moderate sloping riparian floodplains in canyons and small valley bottoms with permanent streams. It is found on all aspects at elevations ranging from 4,200 to 6,000 feet. Flooding may occur frequently on the site between March and September. In some areas, this site floods only on rare occasions.
Table 2. Representative physiographic features
Landforms |
(1)
Flood plain
(2) Channel (3) Stream |
---|---|
Flooding duration | Brief (2 to 7 days) to long (7 to 30 days) |
Flooding frequency | None to frequent |
Ponding frequency | None |
Elevation | 4,200 – 6,000 ft |
Slope | 10% |
Aspect | Aspect is not a significant factor |
Climatic features
Approximately 90 percent of the moisture for this site is recieved as run-in from March through October. June, July and August are the driest months for this site and April and May are the wettest months.
Table 3. Representative climatic features
Frost-free period (average) | 185 days |
---|---|
Freeze-free period (average) | 151 days |
Precipitation total (average) | 13 in |
Figure 2. Monthly precipitation range
Figure 3. Monthly average minimum and maximum temperature
Figure 4. Annual precipitation pattern
Figure 5. Annual average temperature pattern
Influencing water features
Soil features
Salt accumulations are not a problem with these soils. Profile textures are greatly stratified with alluvial deposits of varying sizes. Textures range within the moderately coarse and moderately fine texture classes with or without various amounts of rock fragments. Commonly, soils are underlain by sand, gravel, or cobble at depths of 10 to 20 inches. The water table is near the surface much of the time which maintains soil moisture. Water table depth fluctuates with stream flow. The soils are frequently overflowed and erosion and deposition are variable along the floodplain. Annual soil loss and soil surface factor (SSF) in potential is variable. These are dependent upon the variability of stream flow or flooding occurrence.
Table 4. Representative soil features
Surface texture |
(1) Loam (2) Sand |
---|---|
Drainage class | Somewhat poorly drained to poorly drained |
Permeability class | Slow to rapid |
Soil depth | 20 – 40 in |
Surface fragment cover <=3" | 13% |
Surface fragment cover >3" | Not specified |
Available water capacity (0-40in) |
1 – 5.5 in |
Calcium carbonate equivalent (0-40in) |
40% |
Electrical conductivity (0-40in) |
8 mmhos/cm |
Sodium adsorption ratio (0-40in) |
20 |
Soil reaction (1:1 water) (0-40in) |
6.6 – 9 |
Subsurface fragment volume <=3" (Depth not specified) |
21% |
Subsurface fragment volume >3" (Depth not specified) |
3% |
Ecological dynamics
As ecological condition deteriorates due to overgrazing redtop, bluegrass, and all forbs decrease, while sedge, willow, rabbitbrush, woods rose, big sagebrush, and trees increase.
When the potential natural plant community is burned, trees and some shrubs decrease while grasses and forbs increase.
State and transition model
More interactive model formats are also available.
View Interactive Models
Click on state and transition labels to scroll to the respective text
Ecosystem states
State 1 submodel, plant communities
State 1
Reference State
Community 1.1
Reference State
The dominant aspect of the plant community is willow and sedges. The composition by air-dry weight is approximately 50 percent perennial grasses, 15 percent forbs, 15 percent shrubs, and 10 percent trees. This riparian ecosystem is very dynamic and all stages of plant succession can be found.
Figure 6. Annual production by plant type (representative values) or group (midpoint values)
Table 5. Annual production by plant type
Plant type | Low (lb/acre) |
Representative value (lb/acre) |
High (lb/acre) |
---|---|---|---|
Grass/Grasslike | 450 | 975 | 1500 |
Shrub/Vine | 135 | 293 | 450 |
Forb | 135 | 293 | 450 |
Tree | 90 | 195 | 300 |
Total | 810 | 1756 | 2700 |
Table 6. Ground cover
Tree foliar cover | 10-20% |
---|---|
Shrub/vine/liana foliar cover | 10-20% |
Grass/grasslike foliar cover | 40-50% |
Forb foliar cover | 1-5% |
Non-vascular plants | 0% |
Biological crusts | 0% |
Litter | 0% |
Surface fragments >0.25" and <=3" | 0% |
Surface fragments >3" | 0% |
Bedrock | 0% |
Water | 0% |
Bare ground | 0% |
Table 7. Canopy structure (% cover)
Height Above Ground (ft) | Tree | Shrub/Vine | Grass/ Grasslike |
Forb |
---|---|---|---|---|
<0.5 | – | – | – | – |
>0.5 <= 1 | – | – | – | 0-10% |
>1 <= 2 | – | – | 45-55% | – |
>2 <= 4.5 | – | – | – | – |
>4.5 <= 13 | – | 15-25% | – | – |
>13 <= 40 | 15-25% | – | – | – |
>40 <= 80 | – | – | – | – |
>80 <= 120 | – | – | – | – |
>120 | – | – | – | – |
Figure 7. Plant community growth curve (percent production by month). UT0221, PNC. Excellent Condition.
Jan | Feb | Mar | Apr | May | Jun | Jul | Aug | Sep | Oct | Nov | Dec |
---|---|---|---|---|---|---|---|---|---|---|---|
J | F | M | A | M | J | J | A | S | O | N | D |
0 | 0 | 5 | 15 | 40 | 30 | 5 | 5 | 0 | 0 | 0 | 0 |
Additional community tables
Table 8. Community 1.1 plant community composition
Group | Common name | Symbol | Scientific name | Annual production (lb/acre) | Foliar cover (%) | |
---|---|---|---|---|---|---|
Tree
|
||||||
1 | Trees | 0 | ||||
boxelder | ACNE2 | Acer negundo | 0 | – | ||
narrowleaf cottonwood | POAN3 | Populus angustifolia | 0 | – | ||
Fremont cottonwood | POFR2 | Populus fremontii | 0 | – | ||
Shrub/Vine
|
||||||
2 | Primary Shrubs | 100–200 | ||||
narrowleaf willow | SAEX | Salix exigua | 100–200 | – | ||
3 | Secondary Shrubs | 100–200 | ||||
Utah serviceberry | AMUT | Amelanchier utahensis | 20–60 | – | ||
basin big sagebrush | ARTRT | Artemisia tridentata ssp. tridentata | 20–60 | – | ||
western white clematis | CLLI2 | Clematis ligusticifolia | 20–60 | – | ||
golden currant | RIAU | Ribes aureum | 20–60 | – | ||
Woods' rose | ROWO | Rosa woodsii | 20–60 | – | ||
arroyo willow | SALA6 | Salix lasiolepis | 20–60 | – | ||
silver buffaloberry | SHAR | Shepherdia argentea | 20–60 | – | ||
coralberry | SYOR | Symphoricarpos orbiculatus | 20–60 | – | ||
Grass/Grasslike
|
||||||
3 | Primary Grasses | 760–1100 | ||||
Nebraska sedge | CANE2 | Carex nebrascensis | 500–600 | – | ||
clustered field sedge | CAPR5 | Carex praegracilis | 100–200 | – | ||
Kentucky bluegrass | POPR | Poa pratensis | 100–200 | – | ||
arctic rush | JUAR2 | Juncus arcticus | 60–100 | – | ||
1 | Seconary Grasses | 100–200 | ||||
creeping bentgrass | AGST2 | Agrostis stolonifera | 20–60 | – | ||
slender wheatgrass | ELTR7 | Elymus trachycaulus | 20–60 | – | ||
basin wildrye | LECI4 | Leymus cinereus | 20–60 | – | ||
western wheatgrass | PASM | Pascopyrum smithii | 20–60 | – | ||
timothy | PHPR3 | Phleum pratense | 20–60 | – | ||
Forb
|
||||||
2 | Forbs | 200–300 | ||||
common yarrow | ACMI2 | Achillea millefolium | 60–100 | – | ||
silverweed cinquefoil | ARAN7 | Argentina anserina | 60–100 | – | ||
white sagebrush | ARLU | Artemisia ludoviciana | 60–100 | – | ||
field horsetail | EQAR | Equisetum arvense | 60–100 | – | ||
Richardson's geranium | GERI | Geranium richardsonii | 60–100 | – | ||
redwool plantain | PLER | Plantago eriopoda | 60–100 | – | ||
common dandelion | TAOF | Taraxacum officinale | 60–100 | – | ||
strawberry clover | TRFR2 | Trifolium fragiferum | 60–100 | – |
Interpretations
Animal community
This is one of Utah’s highest yielding range sites. The plants are predominantly grasses and grasslike plants with a few forbs and practically no shrubs. To control soil erosion and degradation of the plant community, this site may be properly grazed early with animals being removed early to allow key plants to go ungrazed during the last part of the growing season. A stubble height of 4 to 6 inches should be adhered to.
Wildlife using this site include rabbit, coyote, mule deer, pheasants, songbirds, eagles, and hawks.
This is a short list of the more common species found. Many other species are present as well and migratory birds are present at times.
Hydrological functions
Soils in this site are in D hydrologic group due to water table. They have a high runoff potential. When the vegetation is in climax, the hydrologic curves will be 86 to 85. Refer to SCS National Engineering Handbook, Section 4, to determine runoff quantities from these curves when range condition has declined from the climax, field investigations are needed in order to determine hydrologic curve numbers.
Recreational uses
Recreation values are camping, hiking, fishing, and hunting. Natural beauty values exist in the diversity and abundance of plant growth coming from the moist soils found in the site.
Wood products
Values exist for saw logs primarily for sheathing, but in most instances it would be more feasible to leave the trees for aesthetic values and recreation. Posts and poles and crating lumber can be harvested from Cottonwoods, Box Elder, Water Birch, and Thinleaf Alder but They are of much inferior quality to Pine or Fir. These trees produce suitable wood for fireplaces, campfires, and materials for novelties and ornamental uses.
Other information
Threatened and endangered species include plants and animals.
Supporting information
Contributors
N/A
Unknown
Rangeland health reference sheet
Interpreting Indicators of Rangeland Health is a qualitative assessment protocol used to determine ecosystem condition based on benchmark characteristics described in the Reference Sheet. A suite of 17 (or more) indicators are typically considered in an assessment. The ecological site(s) representative of an assessment location must be known prior to applying the protocol and must be verified based on soils and climate. Current plant community cannot be used to identify the ecological site.
Author(s)/participant(s) | |
---|---|
Contact for lead author | |
Date | |
Approved by | |
Approval date | |
Composition (Indicators 10 and 12) based on | Annual Production |
Indicators
-
Number and extent of rills:
-
Presence of water flow patterns:
-
Number and height of erosional pedestals or terracettes:
-
Bare ground from Ecological Site Description or other studies (rock, litter, lichen, moss, plant canopy are not bare ground):
-
Number of gullies and erosion associated with gullies:
-
Extent of wind scoured, blowouts and/or depositional areas:
-
Amount of litter movement (describe size and distance expected to travel):
-
Soil surface (top few mm) resistance to erosion (stability values are averages - most sites will show a range of values):
-
Soil surface structure and SOM content (include type of structure and A-horizon color and thickness):
-
Effect of community phase composition (relative proportion of different functional groups) and spatial distribution on infiltration and runoff:
-
Presence and thickness of compaction layer (usually none; describe soil profile features which may be mistaken for compaction on this site):
-
Functional/Structural Groups (list in order of descending dominance by above-ground annual-production or live foliar cover using symbols: >>, >, = to indicate much greater than, greater than, and equal to):
Dominant:
Sub-dominant:
Other:
Additional:
-
Amount of plant mortality and decadence (include which functional groups are expected to show mortality or decadence):
-
Average percent litter cover (%) and depth ( in):
-
Expected annual annual-production (this is TOTAL above-ground annual-production, not just forage annual-production):
-
Potential invasive (including noxious) species (native and non-native). List species which BOTH characterize degraded states and have the potential to become a dominant or co-dominant species on the ecological site if their future establishment and growth is not actively controlled by management interventions. Species that become dominant for only one to several years (e.g., short-term response to drought or wildfire) are not invasive plants. Note that unlike other indicators, we are describing what is NOT expected in the reference state for the ecological site:
-
Perennial plant reproductive capability:
Print Options
Sections
Font
Other
The Ecosystem Dynamics Interpretive Tool is an information system framework developed by the USDA-ARS Jornada Experimental Range, USDA Natural Resources Conservation Service, and New Mexico State University.
Click on box and path labels to scroll to the respective text.