Natural Resources
Conservation Service
Ecological site R028AY138UT
Desert Shallow Loam (Shadscale)
Accessed: 11/21/2024
General information
Provisional. A provisional ecological site description has undergone quality control and quality assurance review. It contains a working state and transition model and enough information to identify the ecological site.
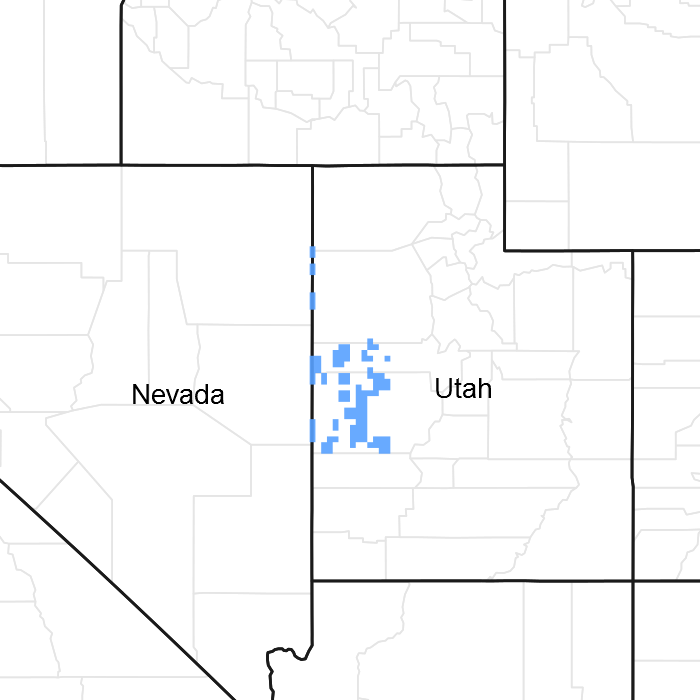
Figure 1. Mapped extent
Areas shown in blue indicate the maximum mapped extent of this ecological site. Other ecological sites likely occur within the highlighted areas. It is also possible for this ecological site to occur outside of highlighted areas if detailed soil survey has not been completed or recently updated.
MLRA notes
Major Land Resource Area (MLRA): 028A–Ancient Lake Bonneville
This site occurs in MLRA 28A, LRU A, the northern part of MLRA 28A. This LRU has a mesic soil temperature regime and a typic aridic soil moisture regime. Typically most precipitation occurs in the winter. Mean annual precipitation is between 4 to 8 inches. The north desert ecological zone typically has no big sagebrush (Artemisia tridentate spp.), but typically is dominated by shadscale (Atriplex confertifolia), winterfat (Krascheninnikovia lanata), saltbushes (Atriplex spp), Indian ricegrass (Achnatherum hymenoides), and bottlebrush squirreltail (Elymus elymoides). Unlike the southern LRUs, there is typically very little if any galleta (Pleuraphis jamesii) grass.
Classification relationships
MLRA 28A, LRU A, northern desert ecological zone
Ecological site concept
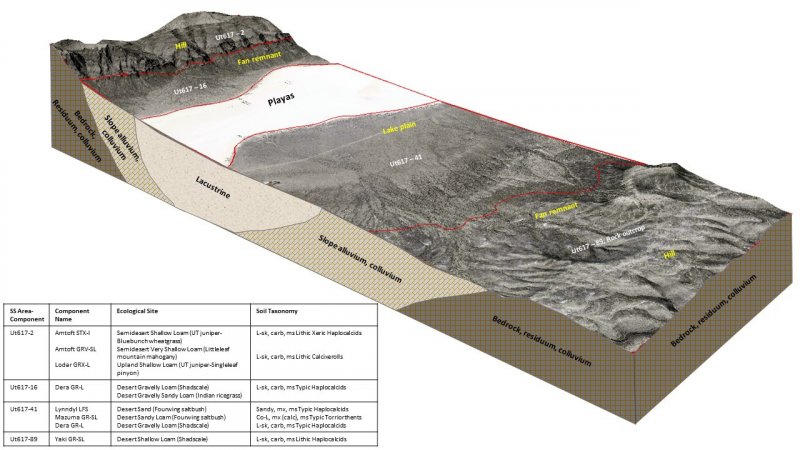
This site is dominated by shadscale in reference condition. It is typically found at moderate to steep slopes on mountainsides, hillsides or benches. This site occurs on gravelly to stony soils that are shallow.
Similar sites
R028AY003NV |
LOAMY SLOPE 5-8 P.Z. This is a similar site found in Nevada |
---|---|
R028AY124UT |
Desert Loam (Shadscale) |
R028AY119UT |
Desert Flat (Shadscale) |
R028AY120UT |
Desert Gravelly Loam (Shadscale) |
Table 1. Dominant plant species
Tree |
Not specified |
---|---|
Shrub |
(1) Atriplex confertifolia |
Herbaceous |
Not specified |
Physiographic features
This site occurs on mountainsides, hillsides, benches, and fan terraces on moderate to steep slopes. It is typically found between 4300 to 5800 feet elevation. There is no flooding or ponding on this site.
Table 2. Representative physiographic features
Landforms |
(1)
Mountain slope
(2) Hill (3) Fan |
---|---|
Flooding frequency | None |
Ponding frequency | None |
Elevation | 4,800 – 5,800 ft |
Slope | 10 – 50% |
Climatic features
The climate is cold and snowy in the winter and warm and dry in the summer. The average precipitation is 5 to 8 inches. Approximately 70 percent comes as rain from March through October. On the average, June through September are the driest months and March through May are the wettest months.
Mean Annual Air Temperature: 45-50
Mean Annual Soil Temperature: 50-53
Table 3. Representative climatic features
Frost-free period (average) | 103 days |
---|---|
Freeze-free period (average) | 124 days |
Precipitation total (average) | 4 in |
Figure 2. Monthly precipitation range
Figure 3. Monthly average minimum and maximum temperature
Figure 4. Annual precipitation pattern
Figure 5. Annual average temperature pattern
Climate stations used
-
(1) WENDOVER AP AWOS [USW00024193], Wendover, UT
Influencing water features
Soil features
Characteristic soils in this site are 8 to 20 inches deep over bedrock and are well drained.
They formed in colluvium and residuum derived mainly from basalt parent materials. The surface horizon is sandy loam or loam textures 2 inches thick. About 60 percent of the soil surface is covered by rock fragments. The volume of rock fragments in the soil profile is 15 to 35 percent.
These soils are moderately calcareous to strongly calcareous and are moderately alkaline to very strongly alkaline. Permeability is moderate. Runoff is medium or rapid. The hazard of erosion by water is slight to severe depending on percent slope. Available water capacity is 1.5 to 4.0 inches.
The water supplying capacity is 1 to 4 inches. Natural geologic erosion in potential is approximately 1.0 tons/acre/year.
Table 4. Representative soil features
Parent material |
(1)
Colluvium
–
limestone
(2) Residuum – limestone |
---|---|
Surface texture |
(1) Gravelly sandy loam (2) Very stony sandy loam (3) Gravelly loam |
Drainage class | Well drained to somewhat excessively drained |
Permeability class | Moderate |
Soil depth | 10 – 20 in |
Surface fragment cover <=3" | 12 – 28% |
Surface fragment cover >3" | 29% |
Available water capacity (0-40in) |
0.9 – 1.4 in |
Calcium carbonate equivalent (0-40in) |
10 – 50% |
Electrical conductivity (0-40in) |
4 mmhos/cm |
Sodium adsorption ratio (0-40in) |
10 |
Soil reaction (1:1 water) (0-40in) |
7.9 – 9 |
Subsurface fragment volume <=3" (Depth not specified) |
16 – 36% |
Subsurface fragment volume >3" (Depth not specified) |
29% |
Ecological dynamics
As ecological condition deteriorates due to overgrazing, galleta, Indian ricegrass, squirreltail, and needleandthread decrease while rabbitbrush, shadscale, and annuals increase.
When the potential natural plant community is burned, Indian ricegrass and needleandthread decrease while rabbitbrush and annuals increase.
Annual grasses and annual forbs are most likely to invade this site.
Nevada's site 028AY003NV is very similar to this site and the STM developed for 003NV is used in this ESD (Stringham et al. 2015). The soils of this site are shallow or very shallow to bedrock and well drained. Surface textures are loams to sandy loams and are typically very gravelly, cobbly, or stony. Production for site is typically 325 lbs/acre for a normal year. This site is less resilient to disturbance than the modal site (028AY012NV) and others within this disturbance response group (see Stringham et al. 2015 for disturbance response group information).
State and transition model
Figure 6. R028AA138UT
Figure 7. R028AA138UT STM Legend
More interactive model formats are also available.
View Interactive Models
More interactive model formats are also available.
View Interactive Models
Click on state and transition labels to scroll to the respective text
State 1 submodel, plant communities
State 2 submodel, plant communities
State 3 submodel, plant communities
State 4 submodel, plant communities
State 1
Reference State
The Reference State 1.0 is a representative of the natural range of variability under pristine conditions. The Reference State has two general community phases: a shrub-grass dominate phase and a shrub dominant phase. State dynamics are maintained by interactions between climatic patterns and disturbance regimes. Negative feedbacks enhance ecosystem resilience and contribute to the stability of the state. These include the presence of all structural and functional groups, low fine fuel loads, and retention of organic matter and nutrients. This site is very stable, with little variation in plant community composition. Plant community changes would be reflected in production response to long term drought or herbivory. Wet years will increase grass production, while drought years will reduce production. Shrub production will also increase during wet years; however, extreme growing season wet periods has been shown to cause shadscale death.
Community 1.1
Shadscale, Indian ricegrass
This community is dominated by shadscale, bud sagebrush and Indian ricegrass. Galleta grass and King’s desertgrass are minor components along with winterfat and bud sagebrush. Community phase changes are primarily a function of chronic drought. Drought will favor shrubs over perennial bunchgrasses. However, long-term drought will result in an overall decline in plant community production, regardless of functional group. Extreme growing season wet periods may also reduce the shadscale component. Fire is very infrequent to non-existent. The dominant aspect of the plant community is shadscale. The composition by air-dry weight is approximately 30 percent perennial grasses, 10 percent forbs, and 60 percent shrubs.
Figure 8. Annual production by plant type (representative values) or group (midpoint values)
Table 5. Annual production by plant type
Plant type | Low (lb/acre) |
Representative value (lb/acre) |
High (lb/acre) |
---|---|---|---|
Shrub/Vine | 30 | 90 | 180 |
Grass/Grasslike | 15 | 45 | 90 |
Forb | 5 | 15 | 30 |
Total | 50 | 150 | 300 |
Table 6. Ground cover
Tree foliar cover | 0% |
---|---|
Shrub/vine/liana foliar cover | 20-40% |
Grass/grasslike foliar cover | 10-20% |
Forb foliar cover | 2-5% |
Non-vascular plants | 0% |
Biological crusts | 0% |
Litter | 0% |
Surface fragments >0.25" and <=3" | 0% |
Surface fragments >3" | 0% |
Bedrock | 0% |
Water | 0% |
Bare ground | 0% |
Table 7. Canopy structure (% cover)
Height Above Ground (ft) | Tree | Shrub/Vine | Grass/ Grasslike |
Forb |
---|---|---|---|---|
<0.5 | – | – | – | – |
>0.5 <= 1 | – | – | – | 0-10% |
>1 <= 2 | – | 35-45% | 15-25% | – |
>2 <= 4.5 | – | – | – | – |
>4.5 <= 13 | – | – | – | – |
>13 <= 40 | – | – | – | – |
>40 <= 80 | – | – | – | – |
>80 <= 120 | – | – | – | – |
>120 | – | – | – | – |
Figure 9. Plant community growth curve (percent production by month). UT1381, PNC. Excellent Condition.
Jan | Feb | Mar | Apr | May | Jun | Jul | Aug | Sep | Oct | Nov | Dec |
---|---|---|---|---|---|---|---|---|---|---|---|
J | F | M | A | M | J | J | A | S | O | N | D |
0 | 0 | 5 | 25 | 50 | 10 | 0 | 0 | 5 | 5 | 0 | 0 |
Community 1.2
Shadscale
Shrubs such as shadscale and bud sagebrush increase in the community. Perennial bunchgrasses decrease with drought and may become a minor component.
Pathway 1.1a
Community 1.1 to 1.2
Long-term drought, extreme wet periods and/or herbivory. Drought will favor shrubs over perennial bunchgrasses. Extreme wet periods will reduce the shadscale component.
Pathway 1.2a
Community 1.2 to 1.1
Release from drought and/or herbivory would allow the vegetation to increase and bare ground would eventually decrease. Extreme growing season wet period may reduce shadscale.
State 2
Current Potential State
This state is similar to the Reference State 1.0. with the addition of a shadscale and sprouting shrub dominated community phase. Ecological function has not changed, however the resiliency of the state has been reduced by the presence of invasive weeds. Non-natives may increase in abundance but will not become dominant within this State. These non-natives can be highly flammable and can promote fire where historically fire had been infrequent. Negative feedbacks enhance ecosystem resilience and contribute to the stability of the state. These feedbacks include the presence of all structural and functional groups, low fine fuel loads, and retention of organic matter and nutrients. Positive feedbacks decrease ecosystem resilience and stability of the state. These include the non-natives’ high seed output, persistent seed bank, rapid growth rate, ability to cross pollinate, and adaptations for seed dispersal.
Community 2.1
Shadscale, bud sagebrush, Indian ricegrass
This community is compositionally similar to the Reference State Community Phase 1.1 with the presence of non-native species in trace amounts. This community is dominated by shadscale and Indian ricegrass. Galleta grass, bud sagebrush and winterfat are also important species on this site. Community phase changes are primarily a function of chronic drought or extreme wet periods. Fire is infrequent and patchy due to low fuel loads.
Community 2.2
Shadscale, other shrubs
Shadscale and rabbitbrush increase while Indian ricegrass and bud sagebrush decline. Bare ground increases along with annual weeds. Prolonged drought may lead to an overall decline in the plant community. Galleta grass may increase. Wet periods will decrease the shadscale component.
Community 2.3
Shadscale, other shrubs, annual non-natives
Shadscale and rabbitbrush dominates the overstory and perennial bunchgrasses, winterfat and bud sagebrush are reduced, either from competition with shrubs or from inappropriate grazing, chronic drought or both. Galleta may increase. Annual non-native species may be stable or increasing due to a lack of completion with perennial bunchgrasses. Bare ground may be significant. This community is at risk of crossing a threshold to either State 3.0 (shrub) or State 4.0 (annual).
Pathway 2.1a
Community 2.1 to 2.2
Inappropriate growing season grazing favors unpalatable shrubs over bunchgrasses, winterfat and bud sagebrush. Long term drought will also decrease the perennial bunchgrasses in the understory.
Pathway 2.2a
Community 2.2 to 2.1
Release from drought and/or appropriate grazing management that facilitates an increase in perennial grasses, winterfat and bud sagebrush. Extreme growing season wet period may reduce shadscale.
Pathway 2.2b
Community 2.2 to 2.3
Long term drought and/or inappropriate grazing will significantly reduce perennial grasses, winterfat and bud sagebrush in favor of shadscale and rabbitbrush.
State 3
Shrub State
This state has one community phase that is characterized by shadscale, bud sagebrush or a sprouting shrub overstory with very little to no understory. The site has crossed a biotic threshold and site processes are being controlled by shrubs. Shrub cover exceeds the site concept and may be decadent, reflecting stand maturity and lack of seedling establishment due to competition with mature plants. The shrub overstory dominates site resources such that soil water, nutrient capture, nutrient cycling and soil organic matter are temporally and spatially redistributed. Bare ground has increased.
Community 3.1
Shadscale, other shrubs, annual non-natives
Decadent shadscale and bud sagebrush dominate the overstory. Rabbitbrush and/or other sprouting shrubs may be a significant component or dominant shrub. Deep-rooted perennial bunchgrasses may be present in trace amounts or absent from the community. Annual nonnative species increase. Bare ground is significant.
State 4
Annual State
This state has one community phase. In this state, a biotic threshold has been crossed and state dynamics are driven by the dominance and persistence of the annual plant community which is perpetuated by a shortened fire return interval. The herbaceous understory is dominated by annual non-native species such as cheatgrass and halogeton. Bare ground may be abundant. Resiliency has declined and further degradation from fire facilitates a cheatgrass and sprouting shrub plant community. The fire return interval has shortened due to the dominance of cheatgrass in the understory and is a driver in site dynamics.
Community 4.1
Halogeton, cheatgrass
This community is dominated by annual non-native species. Halogeton most commonly invades these sites. Trace amounts of shadscale and other shrubs may be present, but are not contributing to site function. Bare ground may be abundant, especially during low precipitation years. Soil erosion from wind and soil temperature are driving factors in site function.
Transition T1A
State 1 to 2
Trigger: This transition is caused by the introduction of non-native annual plants, such as halogeton, mustards and cheatgrass. Slow variables: Over time the annual non-native species will increase within the community. Threshold: Any amount of introduced non-native species causes an immediate decrease in the resilience of the site. Annual non-native species cannot be easily removed from the system and have the potential to significantly alter disturbance regimes from their historic range of variation.
Transition T2A
State 2 to 3
Trigger: Long-term inappropriate grazing and/or long-term drought will decrease or eliminate deep rooted perennial bunchgrasses and favor shrub growth and establishment. Slow variables: Long term decrease in deep-rooted perennial grass density. Threshold: Loss of deep-rooted perennial bunchgrasses changes nutrient cycling, nutrient redistribution, and reduces soil organic matter.
Transition T2B
State 2 to 4
Trigger: Fire and/or soil disturbing treatments such as drill seeding and plowing. An unusually wet spring may facilitate the increased germination and production of cheatgrass leading to its dominance within the community. Slow variables: Increased production and cover of non-native annual species. Threshold: Loss of deep-rooted perennial bunchgrasses and shrubs truncates, spatially and temporally, nutrient capture and cycling within the community. Increased, continuous fine fuels from annual non-native plants modify the fire regime by changing intensity, size and spatial variability of fires.
Transition T3A
State 3 to 4
Trigger: Fire and/or soil disturbing treatments such as drill seeding and plowing. Slow variables: Increased production and cover of non-native annual species. Threshold: Increased, continuous fine fuels modify the fire regime by changing intensity, size and spatial variability of fires. Changes in plant community composition and spatial variability of vegetation due to the loss of perennial bunchgrasses and sagebrush truncate energy capture spatially and temporally thus impacting nutrient cycling and distribution.
Additional community tables
Table 8. Community 1.1 plant community composition
Group | Common name | Symbol | Scientific name | Annual production (lb/acre) | Foliar cover (%) | |
---|---|---|---|---|---|---|
Shrub/Vine
|
||||||
1 | Primary Shrubs | 72–110 | ||||
shadscale saltbush | ATCO | Atriplex confertifolia | 50–70 | – | ||
bud sagebrush | PIDE4 | Picrothamnus desertorum | 10–20 | – | ||
yellow rabbitbrush | CHVI8 | Chrysothamnus viscidiflorus | 6–10 | – | ||
winterfat | KRLA2 | Krascheninnikovia lanata | 6–10 | – | ||
3 | Secondary Shrubs | 10–20 | ||||
black sagebrush | ARNO4 | Artemisia nova | 2–6 | – | ||
fourwing saltbush | ATCA2 | Atriplex canescens | 2–6 | – | ||
Nevada jointfir | EPNE | Ephedra nevadensis | 2–6 | – | ||
spiny hopsage | GRSP | Grayia spinosa | 2–6 | – | ||
broom snakeweed | GUSA2 | Gutierrezia sarothrae | 2–6 | – | ||
plains pricklypear | OPPO | Opuntia polyacantha | 2–6 | – | ||
shortspine horsebrush | TESP2 | Tetradymia spinosa | 2–6 | – | ||
Grass/Grasslike
|
||||||
2 | Primary Grasses | 34–60 | ||||
James' galleta | PLJA | Pleuraphis jamesii | 20–30 | – | ||
Indian ricegrass | ACHY | Achnatherum hymenoides | 10–20 | – | ||
squirreltail | ELEL5 | Elymus elymoides | 4–10 | – | ||
1 | Secondary Grasses | 10–20 | ||||
purple threeawn | ARPU9 | Aristida purpurea | 2–6 | – | ||
blue grama | BOGR2 | Bouteloua gracilis | 2–6 | – | ||
needle and thread | HECO26 | Hesperostipa comata | 2–6 | – | ||
Sandberg bluegrass | POSE | Poa secunda | 2–6 | – | ||
Forb
|
||||||
2 | Forbs | 10–20 | ||||
Utah milkvetch | ASUT | Astragalus utahensis | 2–6 | – | ||
roundspike cryptantha | CRHU2 | Cryptantha humilis | 2–6 | – | ||
spiny phlox | PHHO | Phlox hoodii | 2–6 | – | ||
gooseberryleaf globemallow | SPGR2 | Sphaeralcea grossulariifolia | 2–6 | – | ||
desert princesplume | STPI | Stanleya pinnata | 2–6 | – |
Interpretations
Animal community
This site is suited for sheep and cattle grazing during fall, winter, and spring.
Wildlife using this site include rabbit, coyote, fox, pronghorn antelope, and mule deer (seasonal).
This is a short list of the more common species found. Many other species are present as well and migratory birds are present at times.
Hydrological functions
Soils are in hydrologic group D with runoff curves ranging from 80 to 89 depending on hydrologic condition.
Recreational uses
Hiking and hunting.
Wood products
None
Other information
Threatened and endangered species include plants and animals.
Supporting information
Type locality
Location 1: Millard County, UT | |
---|---|
General legal description | Warm Springs Soil Survey West of Pruess Lake, South of Garrison, Utah |
Other references
Stringham, T.K., P. Novak-Echenique, P. Blackburn, C. Coombs, D. Snyder, and A. Wartgow. 2015. Final Report for USDA Ecological Site Description State-and-Transition Models, Major Land Resource Area 28A and 28B Nevada. University of Nevada Reno, Nevada Agricultural Experiment Station
Research Report 2015-01. p. 1524.
Contributors
David J. Somorville
DJS
Patti Novak Echenique
Tamzen Stringham
Rangeland health reference sheet
Interpreting Indicators of Rangeland Health is a qualitative assessment protocol used to determine ecosystem condition based on benchmark characteristics described in the Reference Sheet. A suite of 17 (or more) indicators are typically considered in an assessment. The ecological site(s) representative of an assessment location must be known prior to applying the protocol and must be verified based on soils and climate. Current plant community cannot be used to identify the ecological site.
Author(s)/participant(s) | V. Keith Wadman (NRCS Ret.), Shane A. Green (NRCS) |
---|---|
Contact for lead author | shane.green@ut.usda.gov |
Date | 01/15/2009 |
Approved by | Shane A. Green |
Approval date | |
Composition (Indicators 10 and 12) based on | Annual Production |
Indicators
-
Number and extent of rills:
Slight rill development will be evident in the reference community on slopes <15%. Rill development on these slopes will be relatively short (<6’) and widely spaced (8 to 10 feet). Steeper slopes (15% to 50% plus) will exhibit increased rill lengths (15 to 20 feet) with more narrow spacings (2 to 8 feet). Rill development may be more apparent where run-on from adjacent upland sites or exposed bedrock concentrate flows. Evidence of rills will decrease in the months following major weather events. Potential rill development may be affected by significant concentrations (20% - 60%, typically 35%) of coarse fragments on the soil surface. -
Presence of water flow patterns:
Some evidence of water flow is evident throughout the reference community. Flow patterns increase in both size and development as slope increases. Flow patterns are normally <20 feet long, follow natural contours, and are typically spaced 10 to 15 feet apart. Steeper slopes may show minor root exposure around perennial grass clumps and surface coarse fragments show some evidence of movement or redistribution. Increased flow activity will be observed following significant weather events. -
Number and height of erosional pedestals or terracettes:
Minor evidence of pedestals or terracettes caused by water erosion will typically be evident in the reference community and may increase as slope steepens. 1 – 3 inches of depositional mounding in perennial grass clumps, Shadscale canopies and biological soil crusts are normal and may not be erosion caused. -
Bare ground from Ecological Site Description or other studies (rock, litter, lichen, moss, plant canopy are not bare ground):
Bare ground ranges from 20% - 40% in the reference community. Ground cover (the inverse of bare ground) typically includes: coarse fragments – 35% to 60%; plant canopy – 20% to 30%; litter – 10% to 20%, and biological soil crusts – 2% to 5%. -
Number of gullies and erosion associated with gullies:
Developed gully channels are a normal component of desert environments. Gullies associated with reference areas on this site will typically have stable, partially vegetated sides and bottoms with little evidence of head-cutting. Evidence of disturbance will be more significant as slopes increase or following major weather events. Gullies conveying runoff from higher elevation rocky or naturally eroding areas exhibit erosion characteristics consistent with the condition of those areas. -
Extent of wind scoured, blowouts and/or depositional areas:
No evidence of wind generated soil movement is present in reference communities. Slight mounding around Indian ricegrass bunches, James galleta clumps, Shadscale canopies and biological soil crusts is a normal characteristic of this site. -
Amount of litter movement (describe size and distance expected to travel):
Some litter movement down slope from source of origin is common in reference communities but most litter resides in place within or under plant canopies. Movement of fine materials (< ½ “) may move (3’ – 6’) on slope <20%, movement of larger materials (1/2” to 1”) is normal on slopes > 20%. Some litter accumulation is observed behind obstructions. -
Soil surface (top few mm) resistance to erosion (stability values are averages - most sites will show a range of values):
This site should have a soil stability rating of 4 to 5. Surface textures are typically very stony loams containing 35 to 60% coarse fragments. -
Soil surface structure and SOM content (include type of structure and A-horizon color and thickness):
Soil surface is 2 – 3 inches deep and structure is weak fine granular. The A-horizon color is typically 10YR 5/3. Soils have an Ochric epipedon that extends 2 inches into the soil profile. It is normally deeper and better developed under plant canopies. -
Effect of community phase composition (relative proportion of different functional groups) and spatial distribution on infiltration and runoff:
Soil surface is 2 – 3 inches deep and structure is weak fine granular. The A-horizon color is typically 10YR 5/3. Soils have an Ochric epipedon that extends 2 inches into the soil profile. It is normally deeper and better developed under plant canopies. -
Presence and thickness of compaction layer (usually none; describe soil profile features which may be mistaken for compaction on this site):
None. Bedrock occurs at 17 inches. -
Functional/Structural Groups (list in order of descending dominance by above-ground annual-production or live foliar cover using symbols: >>, >, = to indicate much greater than, greater than, and equal to):
Dominant:
Dominant: Non-sprouting shrubs (e.g. Shadscale and Bud sage) 30 – 40%, >> warm season perennial grasses (e.g. James galleta and Blue grama) 10 – 20%, > cool season grasses (e.g. Indian ricegrass and Bottlebrush squirreltail) 5 – 15%.Sub-dominant:
Sub-dominant: Sprouting shrubs (e.g. Nevada jointfir and Winterfat) 3 - 5% > Cool season grasses (e.g. Sandberg and Nevada bluegrasses) 3 - 5%.Other:
Others: Shrubs (e.g. Low rabbitbrush and Four-wing saltbush) 1-3%, perennial forbs (e.g. Gooseberryleaf globemallow and Carpet phlox) 3-5%, biological crusts (e.g. lichens, mosses, cyanobacteria) trace%.Additional:
Moss and lichen communities will normally be found under plant canopies while the cyanobacteria will be found throughout the site. Functional/structural groups may appropriately contain non-native species if their ecological function is the same as the native species in the reference state. Perennial and annual forbs can be expected to vary widely in their expression in the plant community based upon departures from average growing conditions. -
Amount of plant mortality and decadence (include which functional groups are expected to show mortality or decadence):
During years with average to above-average precipitation, there should be very little recent mortality or decadence apparent in either the shrubs or grasses. During severe (multi-year) drought or insect infestations up to 80% of the shadscale may die. There may be partial mortality of individual bunchgrasses and other shrubs during severe drought. -
Average percent litter cover (%) and depth ( in):
Litter cover ranges from 10 to 15% with a spike when Bud Sage drops its leaves. Depth varies from ¼ - ½ inch with depth increasing near plant canopies. -
Expected annual annual-production (this is TOTAL above-ground annual-production, not just forage annual-production):
100 – 200 pounds on an average year. -
Potential invasive (including noxious) species (native and non-native). List species which BOTH characterize degraded states and have the potential to become a dominant or co-dominant species on the ecological site if their future establishment and growth is not actively controlled by management interventions. Species that become dominant for only one to several years (e.g., short-term response to drought or wildfire) are not invasive plants. Note that unlike other indicators, we are describing what is NOT expected in the reference state for the ecological site:
Annual bromes and Halogeton are likely to invade this site. -
Perennial plant reproductive capability:
All perennial plant species have the ability to reproduce in most years except drought years.
Print Options
Sections
Font
Other
The Ecosystem Dynamics Interpretive Tool is an information system framework developed by the USDA-ARS Jornada Experimental Range, USDA Natural Resources Conservation Service, and New Mexico State University.
Click on box and path labels to scroll to the respective text.