Provisional. A provisional ecological site description has undergone quality control and quality assurance review. It contains a working state and transition model and enough information to identify the ecological site.
Areas shown in blue indicate the maximum mapped extent of this ecological site. Other ecological sites likely occur within the highlighted areas. It is also possible for this ecological site to occur outside of highlighted areas if detailed soil survey has not been completed or recently updated.
MLRA notes
Major Land Resource Area (MLRA): 032X–Northern Intermountain Desertic Basins
Major land resource area (MLRA):
032X – Northern Intermountain Desertic Basins – This MLRA is comprised of two major Basins, the Big Horn and Wind River. These two basins are distinctly different and are split by LRU’s to allow individual ESD descriptions. These warm basins are surrounded by uplifts and rimmed by mountains, creating a unique set of plant responses and communities. Unique characteristics of the geology and geomorphology single these two basins out.
Further information regarding MLRAs, refer to: United States Department of Agriculture, Natural Resources Conservation Service. 2006. Land Resource Regions and Major Land Resource Areas of the United States, the Caribbean, and the Pacific Basin. U.S. Department of Agriculture Handbook 296. Available electronically at: http://www.nrcs.usda.gov/wps/portal/nrcs/detail/soils/ref/?cid=nrcs142p2_053624#handbook.
LRU notes
Land Resource Unit (LRU):
32X01B (WY): This LRU is the Big Horn Basin within MLRA 32. This LRU is lower in elevation, slightly warmer and receives slightly less overall precipitation than the Wind River Basin (LRU 02). This LRU was originally divided into two LRU's - LRU A which was the core and LRU B which was the rim. With the most current standards, this LRU is divided into two Subsets. This subset is Subset B, referred to as the Rim, is a transitional band between the basin floor and the lower foothills. The subset encircles Subset A which was originally LRU A. As the LRU shifts towards the south and tracks east, changes in geology and relation to the mountain position, creates a minor shift in soil chemistry influencing the variety of ecological sites and plant interactions. The extent of soils currently correlated to this ecological site does not fit within the digitized boundary. Many of the noted soils are provisional and will be reviewed and corrected in mapping update projects. Other map units are correlated as small inclusions within other MLRA’s/LRU’s based on elevation, landform, and biological references.
Moisture Regime: Ustic Aridic – Prior to 2012, many of the soils within this group were correlated as Frigid Ustic Aridic or as Mesic Typic Aridic, with few mapped within this cross over zone. As progressive soil survey mapping continues, these “crossover” or transitional areas are being identified and corrected.
Temperature Regime: Mesic
Dominant Cover: Rangeland, with Saltbush flats the dominant vegetative cover for this LRU/ESD.
Representative Value (RV) Effective Precipitation: 10-14 inches (254 – 355 mm)
RV Frost-Free Days: 105-125 days
Classification relationships
Relationship to Other Established Classification Systems:
National Vegetation Classification System (NVC):
3 Xeromorphic Woodland, Scrub & Herb Vegetation Class
3.B Cool Semi-Desert Scrub & Grassland Subclass
3.B.1 Cool Semi-Desert Scrub & Grassland formation
3.B.1.NE Western North American Cool Semi-Desert Scrub & Grassland Division
M169 Great Basin & Intermountain Tall Sagebrush Shrubland & Steppe Macrogroup
G302 Artemisia Tridentata - Artemisia tripartita - Purshia tridentata Big Sagebrush Steppe Group
CEGL001535 - Artemisia tridentata ssp. wyomingensis/Pseudoroegneria spicata Herbaceous Vegetation or
CEGL001009 - Artemisia tridentata ssp. wyomingensis/Pseudoroegneria spicata Shrubland
Ecoregions (EPA):
Level I: 10 North American Deserts
Level II: 10.1 Cold Deserts
Level III: 10.1.18 Wyoming Basin
Level IV: 10.1.18.g Big Horn Salt Desert Shrub Basin
Ecological site concept
• Site receives no additional water.
• Slope is < 50%
• Soils are:
o Textures range from sand to fine sandy loam in top 4” (10 cm) of mineral soil surface
o All subsurface horizons have a weighted average of <18% clay.
o Shallow (10-20 in. (25-50 cm))
o Not skeletal (<35% rock fragments) within 20” (50 cm) of mineral soil surface
o Non-saline, sodic, or saline-sodic
Sandy sites are found in common with Shallow Sandy along sandstone outcroppings, escarpments and ridges. As move down slope and soils have developed or weathered further, Sandy sites are prevalent.
Annual Precipitation and modeled relative effective annual precipitation ranges from 10 to 14 inches (254 – 355 mm). The normal precipitation pattern shows peaks in May and June and a secondary peak in September. This amounts to about 50% of the mean annual precipitation. Much of the moisture that falls in the latter part of the summer is lost by evaporation and much of the moisture that falls during the winter is lost by sublimation. Average snowfall is about 20 inches annually. Wide fluctuations may occur in yearly precipitation and result in more dry years than those with more than normal precipitation.
Temperatures show a wide range between summer and winter and between daily maximums and minimums, due to the high elevation and dry air, which permits rapid incoming and outgoing radiation. Cold air outbreaks from Canada in winter move rapidly from northwest to southeast and account for extreme minimum temperatures. Chinook winds may occur in winter and bring rapid rises in temperature. Extreme storms may occur during the winter, but most severely affect ranch operations during late winter and spring. High winds are generally blocked form the basin by high mountains but can occur in conjunction with an occasional thunderstorm. Growth of native cool-season plants begins about April 1st and continues to about July 1st. Cool weather and moisture in September may produce some green up of cool season plants that will continue to late October.
For detailed information visit the Natural Resources Conservation Service National Water and Climate Center at http://www.wcc.nrcs.usda.gov/. "Clark 3NE", "Cody", "Cody 12SE", "Heart Mtn", “Powell Fld Stn", "Shell 1NE", and "Thermopolis 9NE" are the representative weather stations. The following graphs and charts are a collective sample representing the averaged normals and 30-year annual rainfall data for the selected weather stations from 1981 to 2010.
Table 3. Representative climatic features
Frost-free period (characteristic range)
89-93 days
Freeze-free period (characteristic range)
114-122 days
Precipitation total (characteristic range)
7-11 in
Frost-free period (actual range)
83-107 days
Freeze-free period (actual range)
111-125 days
Precipitation total (actual range)
7-12 in
Frost-free period (average)
93 days
Freeze-free period (average)
118 days
Precipitation total (average)
9 in
Characteristic range
Actual range
Bar
Line
Figure 2. Monthly precipitation range
Characteristic range
Actual range
Bar
Line
Figure 3. Monthly minimum temperature range
Characteristic range
Actual range
Bar
Line
Figure 4. Monthly maximum temperature range
Bar
Line
Figure 5. Monthly average minimum and maximum temperature
The characteristics of these upland soils have no influence from ground water (water table below 60 inches (150 cm)) and have minimal influence from surface water/overland flow. There may be isolated features that are affected by snow pack that persists longer than surrounding areas due to position on the landform (shaded/protected pockets); but overflow is not a suitable fit. No streams are classified within this ecological site.
Soil features
The soils of this site are shallow (10 - 20”to bedrock) well to excessively well-drained soils formed in eolian deposits or alluvium over residuum or residuum. These soils have rapid to very rapid permeability and may occur on all slopes. The bedrock may be of any kind except igneous or volcanic and is virtually impenetrable to plant roots. Thin ineffectual layers of other soil textures are disregarded. The soil characteristics having the most influence on the plant community are the shallow depths and light textures which can affect the available moisture.
Major Soil Series correlated to this site include: Blackhall, Rentsac, Byrnie
Other Soil Series in MLRA 32 correlated to this site include:
Table 4. Representative soil features
Parent material
(1) Residuum–sandstone and shale (2) Alluvium–igneous, metamorphic and sedimentary rock (3) Eolian deposits–sandstone
Surface texture
(1) Loamy fine sand
(2) Fine sandy loam
(3) Sandy loam
(4) Loamy sand
(5) Sand
Family particle size
(1) Sandy
Drainage class
Well drained to excessively drained
Permeability class
Rapid to very rapid
Depth to restrictive layer
10–20 in
Soil depth
10–20 in
Available water capacity (0-40in)
0.4–3 in
Calcium carbonate equivalent (0-40in)
10%
Electrical conductivity (0-40in)
2 mmhos/cm
Sodium adsorption ratio (0-40in)
Not specified
Soil reaction (1:1 water) (0-40in)
7.4–8.4
Subsurface fragment volume <=3" (Depth not specified)
10%
Ecological dynamics
**Disclaimer** This PROVISIONAL ecological site was developed for an extended MLRA concept where the foothills (10-14" precipitation Frigid climatic zone) was included in this site. This has created an exaggerated or elevated production value for this site description.
Potential vegetation on this site is dominated by mid cool-season perennial grasses. Other significant vegetation includes winterfat and a variety of forbs and shrubs. The expected potential composition for this site is about 75% grasses, 10% forbs and 15% woody plants. The composition and production will vary naturally due to historical use, fluctuating precipitation and fire frequency.
As this site deteriorates, species such as threadleaf sedge, blue grama, and big sagebrush will increase. Plains pricklypear and weedy annuals will invade. Cool season grasses such as needleandthread, bluebunch and Griffith’s wheatgrasses, and Indian ricegrass will decrease in frequency and production.
The Historic Climax Plant Community (description follows the plant community diagram) has been determined by study of rangeland relic areas, or areas protected from excessive disturbance. Trends in plant communities going from heavily grazed areas to lightly grazed areas, seasonal use pastures, and historical accounts have also been used.
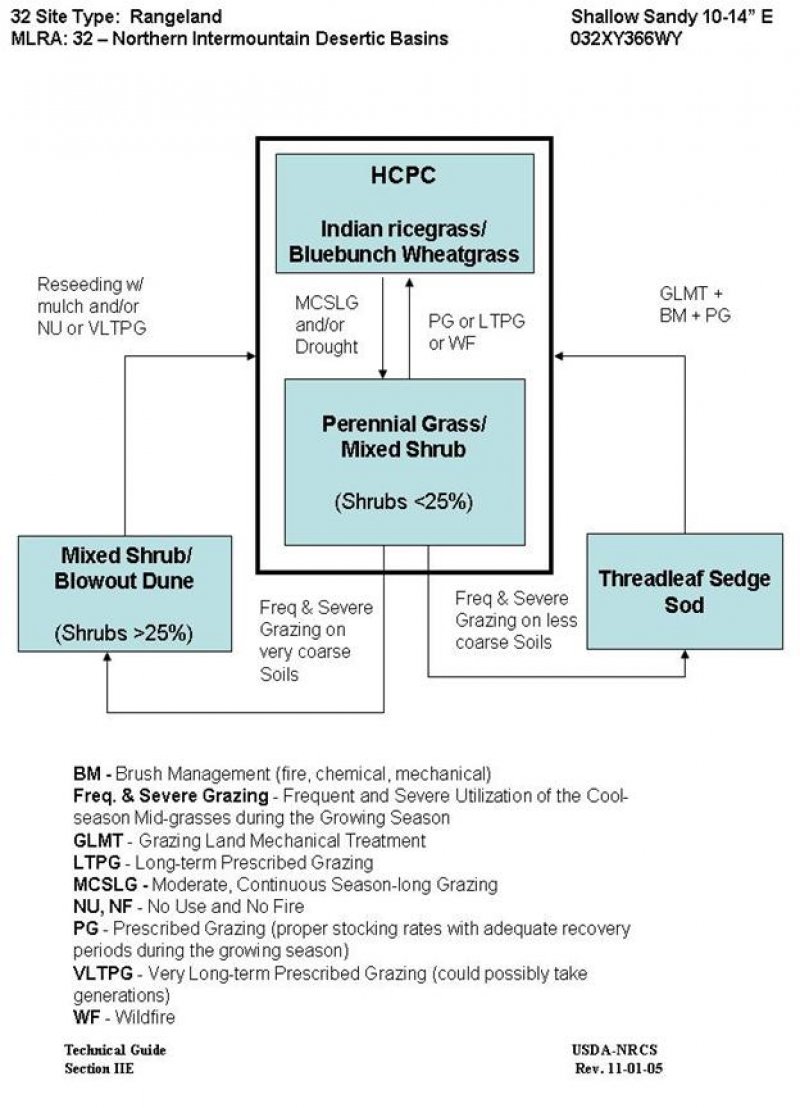
The following is a State and Transition Model Diagram that illustrates the common plant communities (states) that can occur on the site and the transitions between these communities. The ecological processes will be discussed in more detail in the plant community narratives following the diagram.
Plant Community Narratives
Following are the narratives for each of the described plant communities. These plant communities may not represent every possibility, but they probably are the most prevalent and repeatable plant communities. The plant composition tables shown above have been developed from the best available knowledge at the time of this revision. As more data is collected, some of these plant communities may be revised or removed, and new ones may be added. None of these plant communities should necessarily be thought of as “Desired Plant Communities”. According to the USDA NRCS National Range and Pasture Handbook, Desired Plant Communities (DPC’s) will be determined by the decision-makers and will meet minimum quality criteria established by the NRCS. The main purpose for including any description of a plant community here is to capture the current knowledge and experience at the time of this revision.
Community 1.1 Indian ricegrass/ Bluebunch Wheatgrass
The interpretive plant community for this site is the Historic Climax Plant Community. This state evolved with grazing by large herbivores, soils less than 20 inches in depth, and periodic fires. The cyclical nature of the fire regime in this community prevented sagebrush from being the dominant landscape. Cool season midgrasses dominate the state. Potential vegetation is about 75% grasses or grass-like plants, 10% forbs, and 15% woody plants. It is found on areas that are properly managed with grazing and/or prescribed burning, and sometimes on areas receiving short periods of rest.
The major grasses include Indian ricegrass, bluebunch and Griffith’s wheatgrasses, needleandthread, and rhizomatous wheatgrasses. Other grasses occurring in the state include prairie junegrass, Sandberg bluegrass, and threadleaf sedge. Green needlegrass and spikefescue occur on sites in the higher part of this precipitation zone. Big and black sagebrushes and winterfat are conspicuous components of this state. Skunkbush sumac may also be present on sites in the lower portion of this precipitation zone. A variety of forbs and shrubs also occur in this state and plant diversity is high (see Plant Composition Table).
The total annual production (air-dry weight) of this state is about 500 pounds per acre, but it can range from about 350 lbs./acre in unfavorable years to about 700 lbs./acre in above average years.
The state is stable and well adapted to the Northern Intermountain Desertic Basins climate. The diversity in plant species allows for high drought resistance. This is a sustainable plant community (site/soil stability, watershed function, and biologic integrity).
Transitions or pathways leading to other plant communities are as follows:
• Moderate, Continuous Season-Long grazing will convert the plant community to the Perennial Grass/Mixed Shrub Plant Community. Prolonged drought will exacerbate this transition.
Figure 8. Annual production by plant type (representative values) or group (midpoint values)
Figure 9. Plant community growth curve (percent production by month). WY0701, 10-14E upland sites.
Jan
Feb
Mar
Apr
May
Jun
Jul
Aug
Sep
Oct
Nov
Dec
J
F
M
A
M
J
J
A
S
O
N
D
5
25
40
10
5
10
5
State 2 Perennial Grass/ Mixed Shrub
Community 2.1 Perennial Grass/ Mixed Shrub
Historically, this plant community evolved under grazing and a low fire frequency. Currently, it is found under moderate, season-long grazing by livestock and will be exacerbated by prolonged drought conditions. In addition, the fire regime for this site has been modified and extended periods without fire is now common. This plant community is still dominated by cool-season grasses, while short warm-season grasses and miscellaneous forbs account for the balance of the understory.
The overstory is comprised of a variety of shrubs.
The dominant grasses/grasslikes include needleandthread, rhizomatous wheatgrasses, threadleaf sedge, Sandberg bluegrass, and blue grama. Forbs commonly found on the site include waxleaf penstemon, little larkspur, sulfur flower buckwheat, fleabane, and lemon scurfpea. Shrubs can make up to 15% of the annual production. These include big and black sagebrush, green rabbitbrush, Skunkbush sumac, and winterfat. The overstory of shrubs and understory of grass and forbs provide a diverse plant community.
When compared to the Historic Climax Plant Community, bluebunch wheatgrass, Indian ricegrass, and winterfat have decreased. Plains pricklypear cactus may have invaded, but occurs only in small patches. Threadleaf sedge, blue grama, big and black sagebrush and a variety of forbs have increased. Total production is less as the mid cool season grasses are replaced with short grasses.
The total annual production (air-dry weight) of this state is about 450 pounds per acre, but it can range from about 275 lbs./acre in unfavorable years to about 650 lbs./acre in above average years.
The herbaceous component is mostly intact and plant vigor and replacement capabilities are sufficient. Water flow patterns and litter movement may be occurring but only on steeper slopes. Incidence of pedestalling is minimal. Soils are mostly stable and the surface shows minimum soil loss. Wind scouring and deposition areas are few. The communities’ soil, biotic integrity and watershed is intact, although more than normal runoff may occur due to the sod forming vegetation and bare ground.
Transitional pathways leading to other plant communities are as follows:
• Prescribed grazing or possibly long-term prescribed grazing will return this plant community to the HCPC. The probability of this occurring is high especially if rotational grazing along with short deferred grazing is implemented as part of the prescribed method of use. In addition, the removal of fire suppression will allow a somewhat natural fire regime to reoccur to more easily transition between this plant community and the HCPC. A prescribed fire treatment can be useful to hasten this transition if desired, however, this may require a removal of grazing for a period of time to build a surplus of fine fuels.
• Frequent and Severe grazing on very coarse soils will convert this state to the Mixed Shrub/Blowout Dune Plant Community.
• Frequent and Severe grazing on less coarse soils will convert this state to the Threadleaf Sedge Sod Plant Community.
Figure 10. Plant community growth curve (percent production by month). WY0701, 10-14E upland sites.
Jan
Feb
Mar
Apr
May
Jun
Jul
Aug
Sep
Oct
Nov
Dec
J
F
M
A
M
J
J
A
S
O
N
D
5
25
40
10
5
10
5
State 3 Threadleaf Sedge
Community 3.1 Threadleaf Sedge
This plant community can occur as a result of frequent and severe grazing on less coarse soils.
Shrubs such as big and black sagebrush and green rabbitbrush may remain significant components of the plant community, but a dense stand of threadleaf sedge has been established. Pricklypear cactus can also become pervasive in dense patches.
Grasses/grasslikes of importance are threadleaf sedge, needleandthread, Fendler threeawn, Sandberg bluegrass and blue grama. Patches of annuals such as cheatgrass and other weedy annual forbs such as halogeton, Russian thistle, and kochia, will persist on this site.
When compared with the HCPC, the annual production is less due to the reduction of the mid cool season grasses. Shrubs have also increased, but are not dominant, as the sod prevents further encroachment in the site.
The total annual production (air-dry weight) of this state is about 300 pounds per acre, but it can range from about 225 lbs./acre in unfavorable years to about 400 lbs./acre in above average years.
This sod is resistant to change under most levels of grazing and the reestablishment of perennial mid-grasses is difficult in this situation. The biotic integrity of this state is minimally functional and plant diversity is moderate to low. Production is reduced and plant vigor is diminished
Water flow patterns are obvious in the bare ground areas and pedestalling is apparent along the sod edges. Rill channels are noticeable in the interspaces and down slope. The watershed may or may not be functioning, as runoff may affect adjoining sites. Pedestalling is apparent along the sod edges.
Transitional pathways leading to other plant communities are as follows:
• Grazing land mechanical treatment (seeding, etc.), brush management if necessary, and continued prescribed grazing, will return this plant community to near Historic Climax Plant Community. Any chiseling or disturbance in the sod should be implemented carefully so as not to create large openings, which can expose the soil to wind erosion.
Figure 11. Plant community growth curve (percent production by month). WY0701, 10-14E upland sites.
Jan
Feb
Mar
Apr
May
Jun
Jul
Aug
Sep
Oct
Nov
Dec
J
F
M
A
M
J
J
A
S
O
N
D
5
25
40
10
5
10
5
State 4 Mixed Shrub/ Blowout Dune
Community 4.1 Mixed Shrub/ Blowout Dune
This plant community is the result of frequent and severe grazing on very coarse soils. Shrubs eventually dominate this vegetative state, as the annual production of shrubs will exceed 25%. Areas of bare sand also can dominate this site as wind scouring and deposition can occur and modify the soil surface. The shrub species are a significant component of the plant community and the preferred cool season grasses have been eliminated or greatly reduced.
The dominant grasses/grasslikes are Sandberg bluegrass, threadleaf sedge, and blue grama. Weedy annual species such as cheatgrass may occupy the site if a seed source is available. Patches of pricklypear cactus can be noticeable. Big sagebrush and green rabbitbrush, as well as a variety of forbs, have increased significantly. Skunkbush sumac may also be present on sites in the lower portion of this precipitation zone. Plant diversity is moderate to poor. The interspaces between plants have expanded leaving the amount of bare ground more prevalent. When compared to the HCPC, grass production and available forage has diminished significantly, but the total production is somewhat compensated by the increase in shrub production.
The total annual production (air-dry weight) of this state is about 200 pounds per acre, but it can range from about 100 lbs./acre in unfavorable years to about 300 lbs./acre in above average years.
This plant community is relatively resistant to change. Continued frequent and severe grazing does not seem to affect the plant composition or structure of the plant community. These areas are more resistant to fire as less fine fuels are available and the bare ground between the shrub plants is increased. Plant diversity is poor. Production is reduced and plant vigor is diminished due to blowing sand, which can defoliate the vegetative parts of the grass plants.
The soils are exposed to wind as erosion is accelerated and blowouts increase. Pedestalling is pervasive and eolian deposits (dunes) form around the clumped vegetation. This situation is normally extensive.
Transitions or pathways leading to other plant communities are as follows:
• Reseeding with mulch and/or no use or very long-term prescribed grazing, is necessary to return a protective vegetation cover to this state so as to convert this to the Near HCPC conditions. No use may return protective vegetation cover to the site or possible prescribed grazing that may take generations, may also accomplish this goal. The grazing prescription most commonly used is complete deferment during the growing season, with limited use in the winter. This will provide as much plant litter cover as possible to protect the soil surface.
Figure 12. Plant community growth curve (percent production by month). WY0701, 10-14E upland sites.
Jan
Feb
Mar
Apr
May
Jun
Jul
Aug
Sep
Oct
Nov
Dec
J
F
M
A
M
J
J
A
S
O
N
D
5
25
40
10
5
10
5
Additional community tables
Table 5. Community 1.1 plant community composition
Historic Climax Plant Community: The predominance of grasses in this plant community favors grazers and mixed-feeders, such as bison, elk, and antelope. Suitable thermal and escape cover for deer may be limited due to the low quantities of woody plants. However, topographical variations could provide some escape cover. When found adjacent to sagebrush dominated states, this plant community may provide brood rearing/foraging areas for sage grouse, as well as lek sites. Other birds that would frequent this plant community include western meadowlarks, horned larks, and golden eagles. Many grassland obligate small mammals would occur here.
Perennial Grass/Mixed Shrub Plant Community: The combination of a shrub overstory and an understory of grasses and forbs provide a very diverse plant community for wildlife. This diversity o provides important winter ranges, so mule deer and antelope may use this state for foraging and cover year-round, as would cottontail and jack rabbits. It provides important winter, nesting, brood-rearing, and foraging habitat for sage grouse. Brewer’s sparrows’ nest in big sagebrush plants, and hosts of other nesting birds utilize stands in the 20-30% cover range.
Mixed Shrub/Blowout Dune Plant Community: These communities provide limited foraging for antelope and other grazers. They may be used as a foraging site by sage grouse if proximal to woody cover and if the Historic Climax Plant Community or the Perennial Grass/ Mixed Shrub Plant Community is limiting. Generally, these are not target plant communities for wildlife habitat management.
Threadleaf Sedge Sod Plant Community: This plant community can supply some winter foraging for elk, mule deer and antelope, as sagebrush can approach 15% protein and 40-60% digestibility during that time. This community provides escape and thermal cover for large ungulates, as well as nesting habitat for sage grouse.
Animal Community – Grazing Interpretations
The following table lists suggested stocking rates for cattle under continuous season-long grazing under normal growing conditions. These are conservative estimates that should be used only as guidelines in the initial stages of the conservation planning process. Often, the current plant composition does not entirely match any particular plant community (as described in this ecological site description). Because of this, a field visit is recommended, in all cases, to document plant composition and production. More precise carrying capacity estimates should eventually be calculated using this information along with animal preference data, particularly when grazers other than cattle are involved. Under more intensive grazing management, improved harvest efficiencies can result in an increased carrying capacity. If distribution problems occur, stocking rates must be reduced to maintain plant health and vigor.
Plant Community Production Carrying Capacity*
(lb./ac) (AUM/ac)
Historic Climax Plant Community 350-700 .20
Perennial Grass/Mixed Shrub 275-650 .17
Mixed Shrub/Blowout Dune 100-300 .05
Threadleaf Sedge Sod 225-400 .10
* - Continuous, season-long grazing by cattle under average growing conditions.
Grazing by domestic livestock is one of the major income-producing industries in the area. Rangeland in this area may provide yearlong forage for cattle, sheep, or horses. During the dormant period, the forage for livestock use needs to be supplemented with protein because the quality does not meet minimum livestock requirements.
Hydrological functions
Water is the principal factor limiting forage production on this site. This site is dominated by soils in hydrologic group B and C. Infiltration ranges from rapid to very rapid. Runoff potential for this site varies from low to moderate depending on soil hydrologic group and ground cover. In many cases, areas with greater than 75% ground cover have the greatest potential for high infiltration and lower runoff. An example of an exception would be where short-grasses form a strong sod and dominate the site. Areas where ground cover is less than 50% have the greatest potential to have reduced infiltration and higher runoff (refer to Part 630, NRCS National Engineering Handbook for detailed hydrology information).
Rills and gullies should not typically be present. Water flow patterns should be barely distinguishable if at all present. Pedestals are only slightly present in association with bunchgrasses. Litter typically falls in place, and signs of movement are not common. Chemical and physical crusts are rare to non-existent. Cryptogamic crusts are present, but only cover 1-2% of the soil surface.
Recreational uses
This site provides hunting opportunities for upland game species. The wide varieties of plants which bloom from spring until fall have an esthetic value that appeals to visitors.
Wood products
No appreciable wood products are present on the site.
Other products
none noted
Supporting information
Inventory data references
Information presented here has been derived from NRCS inventory data. Field observations from range trained personnel were also used. Those involved in developing this site include: Chris Krassin, Range Management Specialist, NRCS and Everet Bainter, Range Management Specialist. Other sources used as references include USDA NRCS Water and Climate Center, USDA NRCS National Range and Pasture Handbook, USDI and USDA Interpreting Indicators of Rangeland Health Version 3, and USDA NRCS Soil Surveys from various counties.
Approval
Scott Woodall, 10/04/2019
Rangeland health reference sheet
Interpreting Indicators of Rangeland Health is a qualitative assessment protocol used to
determine ecosystem condition based on benchmark characteristics described in the Reference Sheet. A suite of 17 (or
more) indicators are typically considered in an assessment. The ecological site(s) representative of an assessment
location must be known prior to applying the protocol and must be verified based on soils and climate. Current plant
community cannot be used to identify the ecological site.
Author(s)/participant(s)
Ray Gullion, E. Bainter
Contact for lead author
ray.gullion@wy.usda.gov or 307-347-2456
Date
05/02/2008
Approved by
Marji Patz
Approval date
Composition (Indicators 10 and 12) based on
Annual Production
Indicators
Number and extent of rills:
Rare to nonexistent. Where present, short and widely spaced.
Presence of water flow patterns:
Barely observable.
Number and height of erosional pedestals or terracettes:
Rare to nonexistent.
Bare ground from Ecological Site Description or other studies (rock, litter, lichen, moss, plant canopy are
not bare ground):
Bare ground can range from 25-55%.
Number of gullies and erosion associated with gullies:
Active gullies should not be present.
Extent of wind scoured, blowouts and/or depositional areas:
Rare to nonexistent.
Amount of litter movement (describe size and distance expected to travel):
Herbaceous litter expected to move only in small amounts (to leeward side of shrubs). Large woody debris from sagebrush will show no movement.
Soil surface (top few mm) resistance to erosion (stability values are averages - most sites will show a range
of values):
Soil Stability Index ratings range from 1 (interspaces) to 6 (under plant canopy), but average values should be 2.7 or greater.
Soil surface structure and SOM content (include type of structure and A-horizon color and thickness):
Soil data is limited for this site. Described A-horizons vary from 1-10 inches (3-25 cm) with OM of .5 to 1.5%.
Effect of community phase composition (relative proportion of different functional groups) and spatial
distribution on infiltration and runoff:
Plant community consists of 65-80% grasses, 15% forbs, and 5-20% shrubs. Evenly distributed plant canopy (30-60%) and litter plus slow to moderately rapid infiltration rates result in minimal runoff. Basal cover is typically less than 5% for this site and does very little to effect runoff on this site. Surface rock fragments of 10-20% provide stability to the site, but reduce infiltration.
Presence and thickness of compaction layer (usually none; describe soil profile features which may be
mistaken for compaction on this site):
None. A coarse, dry subsurface will often refuse a probe, causing misidentification of a compaction layer. Most soil profiles must be described by hand dug holes.
Functional/Structural Groups (list in order of descending dominance by above-ground annual-production or live foliar
cover using symbols: >>, >, = to indicate much greater than, greater than, and equal to):
Dominant:
Mid-size, cool season bunchgrasses
Sub-dominant:
perennial shrubs cool season rhizomatous grasses = perennial forbs
Other:
short, cool season bunchgrasses
Additional:
Amount of plant mortality and decadence (include which functional groups are expected to show mortality or
decadence):
Minimal decadence, typically associated with shrub component.
Average percent litter cover (%) and depth ( in):
Litter ranges from 10-25% of total canopy measurement with total litter (including beneath the plant canopy) from 20-50% expected. Herbaceous litter depth typically ranges from 3-10mm. Woody litter can be up to a couple inches (4-6 cm).
Expected annual annual-production (this is TOTAL above-ground annual-production, not just forage annual-production):
Potential invasive (including noxious) species (native and non-native). List species which BOTH characterize
degraded states and have the potential to become a dominant or co-dominant species on the ecological site if
their future establishment and growth is not actively controlled by management interventions. Species that become
dominant for only one to several years (e.g., short-term response to drought or wildfire) are not invasive
plants. Note that unlike other indicators, we are describing what is NOT expected in the reference state for the
ecological site:
Bare ground greater than 75% is the most common indicator of a threshold being crossed. Big sagebrush, threadleaf sedge, blue grama, Sandberg bluegrass, buckwheat, and phlox are common increasers. Annual weeds such as kochia, mustards, lambsquarter, and Russian thistle are common invasive species in disturbed sites.
Perennial plant reproductive capability:
All species are capable of reproducing, except in drought years.
The Ecosystem Dynamics Interpretive Tool is an information system framework developed by the USDA-ARS Jornada Experimental Range, USDA Natural Resources Conservation Service, and New Mexico State University.
Click on box and path labels to scroll to the respective text.