Provisional. A provisional ecological site description has undergone quality control and quality assurance review. It contains a working state and transition model and enough information to identify the ecological site.
Areas shown in blue indicate the maximum mapped extent of this ecological site. Other ecological sites likely occur within the highlighted areas. It is also possible for this ecological site to occur outside of highlighted areas if detailed soil survey has not been completed or recently updated.
MLRA notes
Major Land Resource Area (MLRA): 032X–Northern Intermountain Desertic Basins
Major land resource area (MLRA):
032X – Northern Intermountain Desertic Basins – This MLRA is comprised of two major Basins, the Big Horn and Wind River. These two basins are distinctly different and are split by LRU’s to allow individual ESD descriptions. These warm basins are surrounded by uplifts and rimmed by mountains, creating a unique set of plant responses and communities. Unique characteristics of the geology and geomorphology single these two basins out.
Further information regarding MLRAs, refer to: United States Department of Agriculture, Natural Resources Conservation Service. 2006. Land Resource Regions and Major Land Resource Areas of the United States, the Caribbean, and the Pacific Basin. U.S. Department of Agriculture Handbook 296. Available electronically at: http://www.nrcs.usda.gov/wps/portal/nrcs/detail/soils/ref/?cid=nrcs142p2_053624#handbook.
LRU notes
Land Resource Unit (LRU):
32X01W (WY): This LRU is the Big Horn Basin within MLRA 32. This LRU is lower in elevation, slightly warmer and receives slightly less overall precipitaiton than the Wind River Basin (LRU 02). This LRU was originally divided into two LRU's - LRU A which was the core and LRU B which was the rim. With the most current standards, this LRU is divided into two Subsets. This group is ambigous of the two official subsets and will be referred to as Subset W, capturing those sites that are a factor of water or other processes outside of the general subset divisions (climate). As the LRU shifts outer edges, aspect and relation to the major bodies of water and taller landforms create minor shifts in soil chemistry influencing the variety of ecological sites and plant interactions. The extent of soils currently correlated to this ecological site does not fit within the digitized boundary. Many of the noted soils are provisional and will be reviewed and corrected in mapping update projects. Other map units are correlated as small inclusions within other MLRA’s/LRU’s based on elevation, landform, and biological references.
Moisture Regime: Aquic, typic aridic, or ustic aridic.
Temperature Regime: Mesic
Dominant Cover: Rangeland, with Saltbush flats the dominant vegetative cover for this MLRA.
Representative Value (RV) Effective Precipitation: 5-14 inches (127 – 355 mm)
RV Frost-Free Days: 105-150 days
Classification relationships
Relationship to Other Established Classification Systems:
National Vegetation Classification System (NVC):
3 Xeromorphic Woodland, Scrub & Herb Vegetation Class
3.B Cool Semi-Desert Scrub & Grassland Subclass
3.B.1 Cool Semi-Desert Scrub & Grassland formation
3.B.1.NE Western North American Cool Semi-Desert Scrub & Grassland Division
M169 Great Basin Saltbush Scrub Macrogroup
G301 Atriplex corrugate – Artemisia pedatifida – Picrothamnus desertorum Dwarf-Scrub Group
Ecoregions (EPA):
Level I: 10 North American Deserts
Level II: 10.1 Cold Deserts
Level III: 10.1.18 Wyoming Basin
Level IV: 10.1.18.g Big Horn Salt Desert Shrub Basin
Ecological site concept
• Site receives additional water as overflow from stream channel and influence from a fluctuating water table.
• Water table will fluctuate from 2.5 to 5 ft deep, but is generally 3 ft or deeper from the soil surface.
• Slope is <6%
• Soils are:
- saline, sodic, or saline-sodic, gypsic
- Moderately deep, deep, or very deep (depth to restrictive layer is greater than 20” (50 cm).
- Textures usually range from very fine sandy loam to clay
- Clay content is < 40% in mineral soil surface 4”.
- With an average particle size class < 60% clay
Saline Subirrigated (SS) 5-9” Big Horn Basin Precipitation Zone
Saline subirrigated is associated with saline lowland in perennial stream channel systems or in irrigated landscapes (historic flood irrigation seepage or runoff).
Annual precipitation and modeled relative effective annual precipitation ranges from 5 to 14 inches (127 – 355 mm). The normal precipitation pattern shows peaks in May and June and a secondary peak in September. The noted peaks account for approximately 50% of the mean annual precipitation. Much of the moisture that falls in the latter part of the summer is lost by evaporation and much of the moisture that falls during the winter is lost by sublimation.
Average snowfall is about 20 inches annually. Wide fluctuations may occur in yearly precipitation and result in more dry years than those with more than normal precipitation. Temperatures show a wide range between summer and winter and between daily maximums and minimums, due to the high elevation and dry air, which permits rapid incoming and outgoing radiation. Cold air outbreaks from Canada in winter move rapidly from northwest to southeast and account for extreme minimum temperatures. Chinook winds may occur in winter and bring rapid rises in temperature. Extreme storms may occur during the winter, but most severely affect ranch operations during late winter and spring. High winds are generally blocked from the basin by high mountains but can occur in conjunction with an occasional thunderstorm.
Growth of native cool-season plants begins approximately on April 1st and continues through to July 1st. Cool weather and moisture in September may produce some green up of cool season plants that will continue to late October. For detailed information visit the Natural Resources Conservation Service National Water and Climate Center at http://www.wcc.nrcs.usda.gov/. “Basin”, "Clark 3NE", "Cody", "Cody 12SE", "Emblem", "Greybull", "Heart Mtn", “Lovell”, "Powelll Fld Stn", "Worland FAA AP", and “Worland” are the representative weather stations for LRU A. The following graphs and charts are a collective sample representing the averaged normals and 30-year annual rainfall data for the selected weather stations from 1981 to 2010.
Table 3. Representative climatic features
Frost-free period (characteristic range)
92-115 days
Freeze-free period (characteristic range)
116-138 days
Precipitation total (characteristic range)
7-9 in
Frost-free period (actual range)
90-118 days
Freeze-free period (actual range)
112-147 days
Precipitation total (actual range)
7-10 in
Frost-free period (average)
105 days
Freeze-free period (average)
129 days
Precipitation total (average)
8 in
Characteristic range
Actual range
Bar
Line
Figure 2. Monthly precipitation range
Characteristic range
Actual range
Bar
Line
Figure 3. Monthly minimum temperature range
Characteristic range
Actual range
Bar
Line
Figure 4. Monthly maximum temperature range
Bar
Line
Figure 5. Monthly average minimum and maximum temperature
Figure 6. Annual precipitation pattern
Figure 7. Annual average temperature pattern
Climate stations used
(1) BASIN [USC00480540], Basin, WY
(2) EMBLEM [USC00483031], Burlington, WY
(3) GREYBULL [USC00484080], Greybull, WY
(4) LOVELL [USC00485770], Lovell, WY
(5) WORLAND [USW00024062], Worland, WY
(6) WORLAND [USC00489770], Worland, WY
(7) HEART MTN [USC00484411], Powell, WY
(8) CLARK 3NE [USC00481775], Powell, WY
(9) CODY [USC00481840], Cody, WY
(10) CODY 12SE [USC00481850], Meeteetse, WY
(11) POWELL FLD STN [USC00487388], Powell, WY
Influencing water features
A fluctuating water table occurs in these areas and ranges from 2.5 to 5 feet, but is usually deeper than 3 feet. Overflow during high spring run-off also provides additional moisture to this site. Site is generally adjacent to an active channel (intermittent or perennial).
Soil features
The soils of this site are moderately deep and very deep well-drained soils formed in alluvium. These soils have moderate to rapid permeability and are moderately to strongly saline and/or alkaline. Higher soluble salt concentrations may be found in the subsoils. The surface soil will be highly variable and vary from 2 to 8 inches in thickness. A fluctuating water table occurs in these areas and ranges from 2.5 to 5 feet. These areas are subject to occasional overflow. The soil characteristics having the most influence on the plant community are depth to a water table during the growing season, occasional overflow or flooding during the growing season, and the elevated quantities of soluble salts.
Major Soil Series correlated to this site include: Binton
Table 4. Representative soil features
Parent material
(1) Alluvium–sandstone and shale
Surface texture
(1) Loam
(2) Clay loam
(3) Silt loam
(4) Sandy loam
(5) Sandy clay loam
(6) Clay
Family particle size
(1) Loamy
Drainage class
Somewhat poorly drained to excessively drained
Permeability class
Moderate to rapid
Soil depth
20–60 in
Available water capacity (0-40in)
1–6.2 in
Calcium carbonate equivalent (0-40in)
15%
Electrical conductivity (0-40in)
4–16 mmhos/cm
Sodium adsorption ratio (0-40in)
8–16
Soil reaction (1:1 water) (0-40in)
8.4–9.6
Ecological dynamics
Potential vegetation on this site is dominated by tall and mid perennial grasses, which can tolerate soils with moderate amounts of salinity and alkalinity. These grasses are also adapted to periodic overflows and a water table near the surface for a portion of the growing season. Other significant vegetation includes greasewood, rubber rabbitbrush and a variety of forbs. The expected potential composition for this site is about 70% grasses, 10% forbs and 20% woody plants. The composition and production will vary naturally due to historical use, fluctuating precipitation and fire frequency.
As this site deteriorates, species such as inland saltgrass and greasewood increase. Weedy annuals will invade. Grasses such as alkali sacaton, basin wildrye, and rhizomatous wheatgrasses will decrease in frequency and production.
The Historic Climax Plant Community (description follows the plant community diagram) has been determined by study of rangeland relic areas, or areas protected from excessive disturbance. Trends in plant communities going from heavily grazed areas to lightly grazed areas, seasonal use pastures, and historical accounts have also been used.
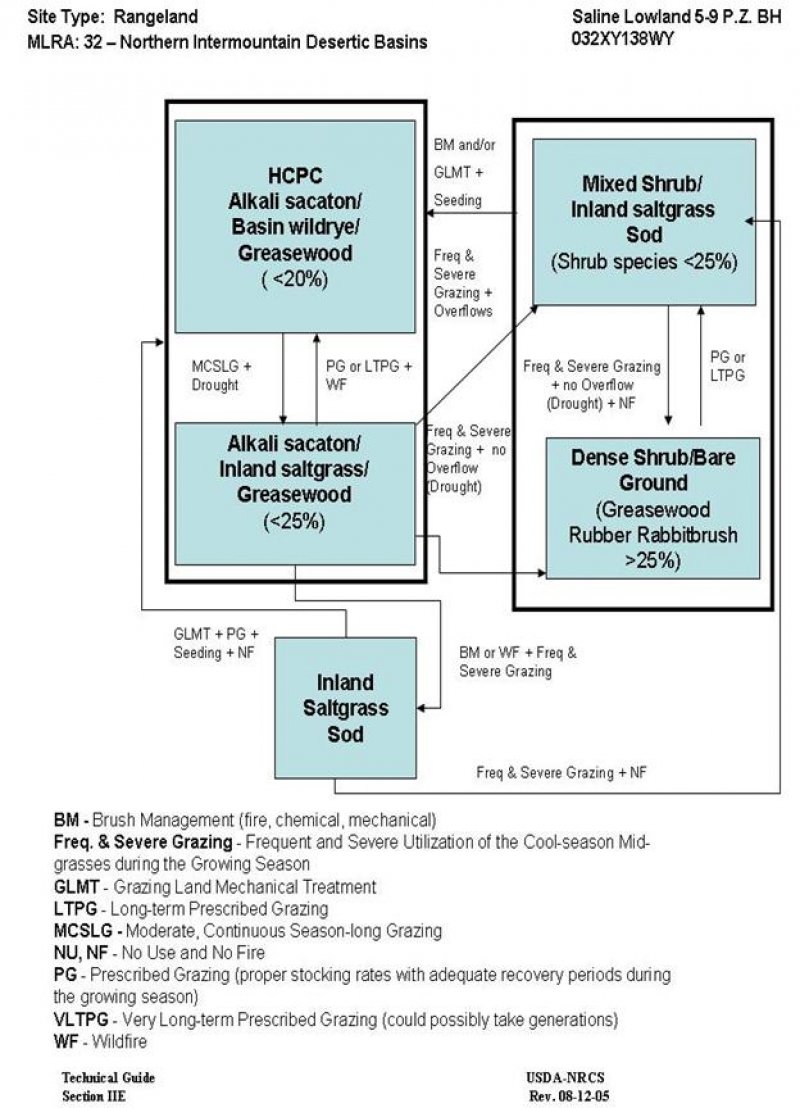
The following is a State and Transition Model Diagram that illustrates the common plant communities (states) that can occur on the site and the transitions between these communities. The ecological processes will be discussed in more detail in the plant community narratives following the diagram.
State 1 Alkali Sacaton/Basin Wildrye/Greasewood Plant Community
Community 1.1 Alkali Sacaton/Basin Wildrye/Greasewood Plant Community
The interpretive plant community for this site is the Historic Climax Plant Community. This state evolved with grazing by large herbivores, periodic fires, supplemental moisture, and saline and/or alkali soils. Potential vegetation is about 70% grasses or grass-like plants, 10% forbs and 20% woody plants. Saline tolerant grasses dominate the state. The major grasses include alkali sacaton, basin wildrye, rhizomatous wheatgrasses, and bottlebrush squirreltail. Woody plants are greasewood and rubber rabbitbrush. A variety of forbs also occurs in this state and plant diversity is high (see Plant Composition Table).
The total annual production (air-dry weight) of this state is about 1200 pounds per acre, but it can range from about 700 lbs. /acre in unfavorable years to about 1600 lbs. /acre in above average years.
This state is stable and well adapted to the Northern Intermountain Desertic Basins climatic conditions. The diversity in plant species allows for high drought resistance. This is a sustainable plant community (site/soil stability, watershed function, and biologic integrity).
Transitions or pathways leading to other plant communities are as follows:
• Moderate, continuous season-long grazing will convert this plant community to the Alkali Sacaton/Inland Saltgrass/Greasewood Plant Community. Prolonged drought will exacerbate this transition.
Figure 8. Annual production by plant type (representative values) or group (midpoint values)
Figure 9. Plant community growth curve (percent production by month). WY0502, 5-9BH Extra water sites - LL, Ov, CyO, SL.
Jan
Feb
Mar
Apr
May
Jun
Jul
Aug
Sep
Oct
Nov
Dec
J
F
M
A
M
J
J
A
S
O
N
D
5
35
30
10
5
10
5
State 2 Alkali Sacaton/Inland Saltgrass/Greasewood Plant Community
Community 2.1 Alkali Sacaton/Inland Saltgrass/Greasewood Plant Community
Historically, this plant community evolved under moderate grazing by large ungulates and low fire frequency. Currently, this site is normally found under a moderate, season-long grazing regime and in the absence of fire or brush control. Prolonged drought can also play an important role and will exacerbate these conditions. Saline and flood tolerant perennial plants make up the dominant species in this plant community.
Dominant grasses include alkali sacaton, inland saltgrass, rhizomatous wheatgrasses, blue grama, and mat muhly. Forbs commonly found in this plant community include wild onion, pursh seepweed, smooth goldaster, and povertyweed. Greasewood and rubber rabbitbrush comprises the majority of the woody species and make up less than 25% of the annual production.
When compared to the Historical Climax Plant Community, basin wildrye and rhizomatous wheatgrasses have decreased. Annual weedy plants have increased, but occur in small patches. Inland saltgrass, greasewood, and rubber rabbitbrush have increased.
The total annual production (air-dry weight) of this state is about 880 pounds per acre, but it can range from about 500 lbs. /acre in unfavorable years to about 1100 lbs. /acre in above average years.
This state is stable and protected from excessive erosion. The herbaceous component is mostly intact and plant vigor and replacement capabilities are sufficient. Only minimal occurrences of water flow patterns and litter movement is evident. Incidence of pedestalling is minimal. Soils are mostly stable and the surface shows minimum soil loss. The watershed is functioning and the biotic community is intact.
Transitional pathways leading to other plant communities are as follows:
• Prescribed grazing or possibly long-term prescribed grazing will result in a plant community very similar to the Historic Climax Plant Community, except that greasewood will persist without a return to a normal fire regime or some form of brush control.
• Frequent and severe grazing with brush management or wildfire will convert this plant community to the Inland Saltgrass Sod Plant Community.
• Frequent and severe grazing with the occasional overflow and no fire will convert this plant community to the Mixed Shrub/Inland Saltgrass Sod Plant Community.
• Frequent and severe grazing with no overflow and no fire will convert this plant community to the Dense Shrub/Bare Ground Plant Community. Prolonged drought will exacerbate this transition.
Figure 10. Plant community growth curve (percent production by month). WY0502, 5-9BH Extra water sites - LL, Ov, CyO, SL.
Jan
Feb
Mar
Apr
May
Jun
Jul
Aug
Sep
Oct
Nov
Dec
J
F
M
A
M
J
J
A
S
O
N
D
5
35
30
10
5
10
5
State 3 Mixed Shrub/Inland Saltgrass Sod Plant Community
Community 3.1 Mixed Shrub/Inland Saltgrass Sod Plant Community
This plant community is the result of frequent and severe grazing with periodic overflows and no fire or brush control. This plant community is dominated by a dense short grass sod and includes a mosaic shrub overstory. Greasewood and rubber rabbitbrush are the primary overstory species in this plant community. Shrubs comprise less than 25% of the annual production.
The dominant grasses are inland saltgrass, mat muhly, and blue grama. Noxious weeds such as Russian knapweed, leafy spurge, or Canada thistle may invade the site. Plant diversity is moderate to poor.
When compared to the Historic Climax Plant Community, the tall and medium grasses are absent. Short warm season grasses are dominant and weedy annuals are common. Shrubs will have increased as a percentage of the total production, but will not dominate as the sod prevents a homogeneous shrub cover. Noxious weeds, such as Russian knapweed, are present if a seed source is available. Areas of bare ground may have increased in patches and total production has decreased.
The total annual production (air-dry weight) of this state is about 480 pounds per acre, but it can range from about 300 lbs. /acre in unfavorable years to about 600 lbs. /acre in above average years.
The sod component of this plant community is extremely resistant to change and continued frequent and severe grazing or the removal of grazing does not seem to affect the plant composition or structure of the plant community. The biotic integrity of this state is mostly not functional as plant diversity is poor, especially the herbaceous species. However, the vegetative structure may still be partially intact as the shrub component is still within a reasonable percentage of the total composition.
This sod bound plant community is very resistant to water infiltration. While this sod protects the site itself, excessive runoff increases erosion on bare ground and can cause rills, channels and gully erosion. Water flow patterns are obvious in the bare ground areas and shrubs and sod patches are pedestalled. Rill channels are noticeable in the interspaces and gullies may be establishing where rills have concentrated. The watershed may or may not be functioning, as runoff is excessive and erosional processes are accelerated.
Transitional pathways leading to other plant communities are as follows:
• Grazing land mechanical treatment (chiseling, etc.) and brush management followed by prescribed grazing and, if necessary, seeding will return this plant community to near Historic Climax Plant Community.
• Frequent and severe grazing with no overflow and no fire will convert this plant community to the Dense Shrub/Bare Ground Sod Plant Community. Prolonged drought will exacerbate this transition.
Figure 11. Plant community growth curve (percent production by month). WY0502, 5-9BH Extra water sites - LL, Ov, CyO, SL.
Jan
Feb
Mar
Apr
May
Jun
Jul
Aug
Sep
Oct
Nov
Dec
J
F
M
A
M
J
J
A
S
O
N
D
5
35
30
10
5
10
5
State 4 Dense Shrub/Bare Ground Plant Community
Community 4.1 Dense Shrub/Bare Ground Plant Community
This plant community evolved under frequent and severe grazing with the absence of fire and an interruption in overflow or an extended period of drought. Greasewood and rubber rabbitbrush are the dominant species of this plant community. Tall and medium grasses have been eliminated. The interspaces between shrubs have expanded leaving the amount of bare ground more prevalent and more soil surface exposed to erosive elements.
The annual grasses and forbs, such as cheatgrass, foxtail barley, kochia, halogeton, and Russian thistle make up the dominant understory along with noxious weeds such as Russian knapweed. Total annual production is mostly from shrubs and these weedy annuals. Shrubs make up greater than 25% of the total annual production. When compared with the Mixed Shrub/Inland Saltgrass Sod Plant Community, the annual production is similar as the shrub production compensates for the decline in the herbaceous production.
The total annual production (air-dry weight) of this state is about 450 pounds per acre, but it can range from about 350 lbs. /acre in unfavorable years to about 600 lbs. /acre in above average years.
This plant community is resistant to change as the stand becomes more decadent. These areas may actually be more resistant to fire as less fine fuels are available and the bare ground between the shrubs has increased. Continued frequent and severe grazing or the removal of grazing does not seem to affect the plant composition or structure of the plant community. Annual grasses, weedy species and bare ground compromise the biotic integrity. Plant diversity is poor and the potential for native grasses to reproduce is absent. The shift in the vegetative structure and function is extreme and the biotic integrity is lost.
The soil of this state is not well protected as erosion has accelerated because of increased bare ground. Water flow patterns and pedestalling are obvious. Infiltration is reduced and runoff has increased. Rill channels may be noticeable in the interspaces and gullies may be establishing where rills have concentrated.
Transitional pathways leading to other plant communities are as follows:
• Brush management, followed by prescribed grazing and seeding if necessary, will return this plant community at or near HCPC. If prescribed fire is used as a means to reduce or remove the shrubs, sufficient fine fuels will need to be present. This may require deferment from grazing prior to treatment. Since both greasewood and rubber rabbitbrush are difficult to remove or control, repeated treatments or a combination of treatments may be necessary. Post management is critical to ensure success. This can range from two or more years of rest to partial growing season deferment, depending on the condition of the understory at the time of treatment and the growing conditions following treatment. In the case of an intense wildfire that occurs when desirable plants are not completely dormant, the length of time required to reach the HCPC may be increased and seeding of natives is recommended.
• Prescribed grazing or possibly long-term prescribed grazing will return this plant community Mixed Shrub/Inland Saltgrass Plant Community.
Figure 12. Plant community growth curve (percent production by month). WY0502, 5-9BH Extra water sites - LL, Ov, CyO, SL.
Jan
Feb
Mar
Apr
May
Jun
Jul
Aug
Sep
Oct
Nov
Dec
J
F
M
A
M
J
J
A
S
O
N
D
5
35
30
10
5
10
5
State 5 Inland Saltgrass Sod Plant Community
Community 5.1 Inland Saltgrass Sod Plant Community
This plant community is the result of long-term improper grazing use plus fire or some form of brush management. This state is dominated by inland saltgrass sod. Intermittent areas of bare ground have increased and extend between the patches of sod.
When compared to the Historic Climax Plant Community, the tall and medium grasses are absent. Short warm season grasses are dominant and weedy annuals are common. Noxious weeds, such as Russian knapweed, are present if a seed source is available.
The total annual production (air-dry weight) of this state is about 280 pounds per acre, but it can range from about 100 lbs. /acre in unfavorable years to about 350 lbs. /acre in above average years.
This sod is extremely resistant to change and continued frequent and severe grazing or the removal of grazing does not seem to affect the plant composition or structure of the plant community. The biotic integrity of this state is not functional and plant diversity is extremely low.
This sod bound plant community is very resistant to water infiltration. While this sod protects the site itself, excessive runoff increases erosion on bare ground areas and can cause rill channels and gully erosion. Water flow patterns are obvious in the bare ground areas and pedestalling is apparent along the sod edges. Rill channels are noticeable in the interspaces and gullies may be establishing where rills have concentrated. The watershed is not normally functioning, as runoff is excessive and erosional processes are accelerated.
Transitional pathways leading to other plant communities are as follows:
• Grazing land mechanical treatment (chiseling, etc.) followed by prescribed grazing and reseeding native species, will return this plant community to near Historic Climax Plant Community condition.
• Frequent and severe grazing with the occasional overflows and no fire will convert this state to the Mixed Shrub/Inland Saltgrass Sod Plant Community.
Figure 13. Plant community growth curve (percent production by month). WY0502, 5-9BH Extra water sites - LL, Ov, CyO, SL.
Jan
Feb
Mar
Apr
May
Jun
Jul
Aug
Sep
Oct
Nov
Dec
J
F
M
A
M
J
J
A
S
O
N
D
5
35
30
10
5
10
5
Additional community tables
Table 5. Community 1.1 plant community composition
Animal Community – Wildlife Interpretations
Historic Climax Plant Community: The predominance of grasses in this plant community favors grazers and mixed-feeders, such as bison, deer, and antelope. Suitable thermal and escape cover for wildlife is available as quantities of woody plants are adequate. In addition, topographical variations provide some escape cover as well. When found adjacent to sagebrush dominated states, this plant community may provide brood rearing/foraging areas for sage grouse, as well as lek sites. Other birds that would frequent this plant community include western meadowlarks, horned larks, and golden eagles as well as upland game birds. Many grassland obligate small mammals would occur here.
Alkali Sacaton/Inland Saltgrass/Greasewood Plant Community: This plant community exhibits a moderate level of plant species diversity due to the accumulation of salts in the soil. It provides both thermal and escape cover for deer and antelope especially if other woody communities are nearby. Other birds that would frequent this plant community include western meadowlarks, horned larks, and golden eagles as well as upland game birds. Many grassland obligate small mammals would occur here.
Mixed Shrub/Inland Saltgrass Sod Plant Community: These communities provide some foraging and cover for deer, antelope, and other large ungulates. This plant community, especially if proximal to other woody cover, may be used by sage grouse and other game birds for foraging and cover.
Dense Shrub/Bare Ground Plant Community: This plant community can provide important winter foraging and cover for mule deer and antelope during that time. The plant community composition comprises little diversity, and thus, is less apt to meet the seasonal needs of large grazers. It may provide some foraging opportunities and cover for sage grouse, pheasant, and partridge.
Inland Saltgrass Sod Plant Community: This plant community may be used by the same large grazers that would use the Historic Climax Plant Community. However, the plant community composition is less diverse and productive, thus, is less apt to meet the seasonal needs of these animals. It may provide some foraging opportunities for sage grouse when it occurs proximal to woody cover.
Animal Community – Grazing Interpretations
The following table lists suggested stocking rates for cattle under continuous season-long grazing under normal growing conditions. These are conservative estimates that should be used only as guidelines in the initial stages of the conservation planning process. Often, the current plant composition does not entirely match any particular plant community (as described in this ecological site description). Because of this, a field visit is recommended, in all cases, to document plant composition and production. More precise carrying capacity estimates should eventually be calculated using this information along with animal preference data, particularly when grazers other than cattle are involved. Under more intensive grazing management, improved harvest efficiencies can result in an increased carrying capacity. If distribution problems occur, stocking rates must be reduced to maintain plant health and vigor.
* - Continuous, season-long grazing by cattle under average growing conditions.
Grazing by domestic livestock is one of the major income-producing industries in the area. Rangeland in this area may provide yearlong forage for cattle, sheep, or horses. During the dormant period the forage for livestock use needs to be supplemented with protein because the quality does not meet minimum livestock requirements.
Hydrological functions
Water is the principal factor limiting forage production on this site. This site is dominated by soils in hydrologic group B and C, with localized areas in hydrologic group D. Infiltration ranges from moderate to rapid. Runoff potential for this site varies from moderate to high depending on soil hydrologic group and ground cover. In many cases, areas with greater than 75% ground cover have the greatest potential for high infiltration and lower runoff. An example of an exception would be where short-grasses form or a strong sod dominates the site. Areas where ground cover is less than 50% have the greatest potential to have reduced infiltration and higher runoff (refer to Part 630, NRCS National Engineering Handbook for detailed hydrology information).
Rills and gullies should not typically be present. Water flow patterns should be barely distinguishable if at all present. Pedestals are only slightly present in association with bunchgrasses. Litter typically falls in place, and signs of movement are not common. Chemical and physical crusts may be present. Cryptogamic crusts are present, but only cover 1-2% of the soil surface.
Recreational uses
This site provides hunting opportunities for upland game species and big game such as deer and antelope. The wide varieties of plants which bloom from spring until fall have an esthetic value that appeals to visitors.
Wood products
No appreciable wood products are present on the site.
Other products
None noted.
Supporting information
Inventory data references
Information presented here has been derived from NRCS inventory data. Field observations from range trained personnel were also used. Other sources used as references include: USDA NRCS Water and Climate Center, USDA NRCS National Range and Pasture Handbook, and USDA NRCS Soil Surveys from various counties.
Inventory Data References
Data Source Number of Records Sample Period State County
SCS-RANGE-417 19 1965-1986 WY Park & others
Approval
Scott Woodall, 10/04/2019
Rangeland health reference sheet
Interpreting Indicators of Rangeland Health is a qualitative assessment protocol used to
determine ecosystem condition based on benchmark characteristics described in the Reference Sheet. A suite of 17 (or
more) indicators are typically considered in an assessment. The ecological site(s) representative of an assessment
location must be known prior to applying the protocol and must be verified based on soils and climate. Current plant
community cannot be used to identify the ecological site.
Author(s)/participant(s)
Ray Gullion
Contact for lead author
ray.gullion@wy.usda.gov
Date
02/19/2008
Approved by
Marji Patz
Approval date
Composition (Indicators 10 and 12) based on
Annual Production
Indicators
Number and extent of rills:
Rills should not be present
Presence of water flow patterns:
Barely observable
Number and height of erosional pedestals or terracettes:
Essentially non-existent
Bare ground from Ecological Site Description or other studies (rock, litter, lichen, moss, plant canopy are
not bare ground):
Bare ground is 15-25% occurring in small areas throughout site
Number of gullies and erosion associated with gullies:
Active gullies should not be present
Extent of wind scoured, blowouts and/or depositional areas:
None
Amount of litter movement (describe size and distance expected to travel):
Little to no plant litter movement. Plant litter remains in place and is not moved by erosional forces.
Soil surface (top few mm) resistance to erosion (stability values are averages - most sites will show a range
of values):
Plant cover and litter is at 70% or greater of soil surface and maintains soil surface integrity. Soil Stability class is anticipated to be 4 or greater.
Soil surface structure and SOM content (include type of structure and A-horizon color and thickness):
Use Soil Series description for depth and color of A-horizon
Effect of community phase composition (relative proportion of different functional groups) and spatial
distribution on infiltration and runoff:
Grass canopy and basal cover should reduce raindrop impact and slow overland flow providing increased time for infiltration to occur. Healthy deep rooted native grasses enhance infiltration and reduce runoff. Infiltration is Moderate.
Presence and thickness of compaction layer (usually none; describe soil profile features which may be
mistaken for compaction on this site):
No compaction layer or soil surface crusting should be present.
Functional/Structural Groups (list in order of descending dominance by above-ground annual-production or live foliar
cover using symbols: >>, >, = to indicate much greater than, greater than, and equal to):
Dominant:
Mid stature Grasses
Sub-dominant:
Shrubs
Other:
Forbs Short stature Grasses/grasslikes
Additional:
Amount of plant mortality and decadence (include which functional groups are expected to show mortality or
decadence):
Very Low
Average percent litter cover (%) and depth ( in):
Expected annual annual-production (this is TOTAL above-ground annual-production, not just forage annual-production):
1200 lbs/ac
Potential invasive (including noxious) species (native and non-native). List species which BOTH characterize
degraded states and have the potential to become a dominant or co-dominant species on the ecological site if
their future establishment and growth is not actively controlled by management interventions. Species that become
dominant for only one to several years (e.g., short-term response to drought or wildfire) are not invasive
plants. Note that unlike other indicators, we are describing what is NOT expected in the reference state for the
ecological site:
Cheatgrass and other annuals, Greasewood, Rubber rabbitbrush, Inland saltgrass, Exotics and Species found on Noxious Weed List
The Ecosystem Dynamics Interpretive Tool is an information system framework developed by the USDA-ARS Jornada Experimental Range, USDA Natural Resources Conservation Service, and New Mexico State University.
Click on box and path labels to scroll to the respective text.