Natural Resources
Conservation Service
Ecological site DX035X03G100
Salt Meadow
Accessed: 04/02/2026
General information
Provisional. A provisional ecological site description has undergone quality control and quality assurance review. It contains a working state and transition model and enough information to identify the ecological site.
Table 1. Dominant plant species
| Tree |
Not specified |
|---|---|
| Shrub |
Not specified |
| Herbaceous |
(1) Distichlis spicata |
Legacy ID
R035XA100NM
Physiographic features
This site is on nearly level to gently sloping floodplains. It commonly forms a narrow band adjacent to a flowing or intermittent stream. Generally slopes are less than 3 percent. Elevations range from 6,400 to 7,200 feet above sea level. This site is dependent on sub-irrigation and overflow for its moist condition.
Table 2. Representative physiographic features
| Landforms |
(1)
Flood plain
|
|---|---|
| Flooding duration | Brief (2 to 7 days) |
| Flooding frequency | Rare to occasional |
| Ponding duration | Very brief (4 to 48 hours) to brief (2 to 7 days) |
| Ponding frequency | Rare to occasional |
| Elevation | 6,400 – 7,200 ft |
| Slope | 1 – 5% |
| Water table depth | 36 – 72 in |
| Aspect | Aspect is not a significant factor |
Climatic features
Mean annual precipitation varies from 10 to 13 inches. Departures from the average of 3 inches or more are common. June is the driest month. July, August and September are the wettest months, and it is the period when flash floods are to be expected. The vegetation is dependent on sub-irrigation and overflow from the flash floods. In an extended drought period, the water table is affected and results in lowered production of the vegetation.
Temperature varies from a mean annual of 69 degrees F in July to 26 degrees F in January. The maximum is near 100 degrees F and the minimum is near 40 degrees F below zero. The average last killing frost in the fall is the middle of September. Temperatures are usually warm enough to sustain plant growth from April through September.
Wind velocities are relatively light most of the year, and occasionally winds will exceed 25 miles per hour. These stronger winds, which usually occur in the spring and summer, increase transpiration rates of plants and increase evaporation from these moist soils. Soil particles are often displaced from adjacent areas by these strong winds and may cause structural damage to young plants.
Climate data was obtained from the WCCR web site. Using 50% probabilities for freeze-free and frost-free seasons at 28.5 degrees F and 32.5 degrees F respectively.
Table 3. Representative climatic features
| Frost-free period (average) | 119 days |
|---|---|
| Freeze-free period (average) | 145 days |
| Precipitation total (average) | 14 in |
Figure 1. Monthly precipitation range
Figure 2. Monthly average minimum and maximum temperature
Influencing water features
This site is influenced by water from a wetland or stream.
Soil features
The soils in this site are generally deep and well drained. They are affected by sodium. The pH is about 8.0. Surface textures may be loam, fine sandy loam, clay loam and silty clay loam. The subsoil is usually a clay or clay loam. Water intake rate is slow to very slow. Permeability is moderately slow to very slow. Plant roots may be restricted by the sodium content of the soil. Available water-holding capacity is approximately 7 inches in a five-foot profile.
Table 4. Representative soil features
| Surface texture |
(1) Loam (2) Sandy loam (3) Clay loam |
|---|---|
| Family particle size |
(1) Loamy |
| Drainage class | Poorly drained to well drained |
| Permeability class | Moderately slow |
| Soil depth | 60 – 72 in |
| Available water capacity (0-40in) |
3 – 12 in |
| Electrical conductivity (0-40in) |
16 mmhos/cm |
| Sodium adsorption ratio (0-40in) |
30 |
| Soil reaction (1:1 water) (0-40in) |
7.4 – 9 |
| Subsurface fragment volume <=3" (Depth not specified) |
15 – 35% |
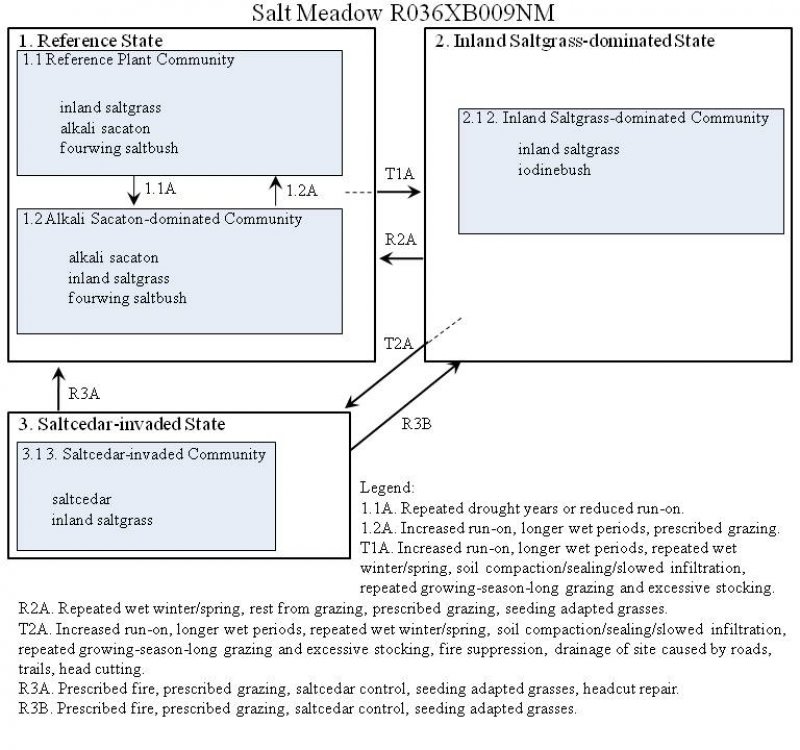
Ecological dynamics
This bottomland site is a grassland plant community characterized by inland saltgrass and alkali sacaton. Fourwing saltbush, the dominant shrub, comprises <5% of the vegetation. Forbs such as seepweed and iodinebush are present in small amounts. When the plant community deteriorates, inland saltgrass, seepweed, iodinebush, and saltcedar dominate amidst large bare–ground interspaces.
Inland saltgrass withstands a shallower water table, ponding, and high salt concentration better than alkali sacaton. Saltcedar likes to have its roots 5 feet or deeper to water table. Recovery from the saltcedar-dominated state requires combined, multiyear treatments--herbicide, root plow, fire, seeding, and follow-up control of resprouts. These communities can be thought of as zonal based on water depth and salt concentrations with Community Phase (CP) 1.1 being surrounded by CP 1.2, CP1.2 surrounded by CP 2.1, and CP 2.1 surrounded by CP 3.1, progressing from CP 1.1 to CP 3.1 as distance to water table increases.
Overview
This site occurs on floodplains adjacent to streams and rivers, and is occasionally flooded for brief periods during the summer. Along the outer edges, this site may intergrade with Salty Bottomland, Clayey Bottomland, or Bottomland sites. The soils are deep, salt-affected, and somewhat poorly drained with a seasonal (April through September) high water table. The reference plant community is a grassland characterized by salt tolerant species such as inland saltgrass and alkali sacaton. Saltgrass is typically the dominant grass on areas that have a high salt content, fine textured soils, and a shallow water table. Alkali sacaton may dominate on soils with lower salt concentrations or where the water table occurs at a greater depth. Overgrazing, soil sealing, soil compaction, or increases in salinity are thought to initiate the transition to the Inland Saltgrass-dominated State. Overgrazing reduces the competitive influence of the more palatable grasses, promotes soil sealing by reducing plant cover and organic matter, and increasing the amount of bare ground. Inland saltgrass possesses the ability to break through compacted soils and survive under conditions of extreme salinity. On areas with high salt concentrations, flooding may help flush salts from the system, provided the site has adequate drainage. Seeding may be necessary to reestablish the more palatable grasses. The introduction of saltcedar propagules may be all that is necessary for saltcedar to establish and dominate some areas. On those areas with a water table less than 4 feet, saltcedar typically occurs as scattered shrub-like trees. On those areas where the water table is deeper (5 to 20 feet) saltcedar may completely dominate in dense stands. Disturbance such as fire, heavy grazing, and drought may encourage saltcedar establishment by reducing the competitive influence of native vegetation. Changes in the timing, intensity, and frequency of flooding may also favor saltcedar establishment. Saltcedar control is costly and may require a combination of control methods and the return of natural flooding regimes.
Catalog of states and community pathways
Reference State
Reference Plant Community: The reference plant community is dominated by inland saltgrass with subdominant alkali sacaton. Other important grass and grasslike species include western wheatgrass, salt sedge, Nuttall’s alkaligrass, and alkali cordgrass. Fourwing saltbush and iodinebush are characteristic shrubs, with desert seepweed typically occurring as the most common forb/sub-shrub. Plant community composition on this site is regulated by water table depth, salinity, and soil texture. Inland saltgrass is favored by high salinity, a shallow water table, and fine-textured soils. Alkali sacaton may attain dominance on soils with lower salt concentrations or on areas where the water table occurs at a greater depth.
Diagnosis: Grass and litter cover is uniform with few large bare areas present. Shrubs are scattered with canopy cover averaging 5%. Evidence of erosion such as pedestalling of grasses, rills and gullies is infrequent.
Additional States:
Inland Saltgrass-dominated State: Dense sod-like areas of inland saltgrass with frequent interspaces of bare salt-crusted ground characterize this state. Iodinebush or fourwing saltbush are scattered between patches of saltgrass. In areas of heavier salt concentrations, iodinebush may be more prevalent.
Diagnosis: Inland saltgrass dominates. Alkali sacaton and western wheatgrass are sparse or absent. Physical and chemical crusts are common.
Transition to Inland Saltgrass-dominated State (T1A) Overgrazing, compaction, soil surface sealing, and increased salinity are thought to initiate this transition. Heavy grazing causes a decrease in the more palatable grasses, providing a competitive advantage for inland saltgrass. The loss of grass also increases the size and frequency of bare patches that often quickly seal over with chemical or physical crusts. Soil crusts can limit seedling establishment and increase salinity at the soil surface by decreasing infiltration and not allowing the water to flush salts from the rooting zone. Excessive trampling or vehicle traffic can cause the formation of a compaction layer in soils, restricting root growth. Inland saltgrass is equipped with a dense network of sharp pointed underground rhizomes enabling it to spread even in heavy compacted soils.3 Presumably, these rhizomes possess the ability to pierce soil crusts. Salinity may increase due to changes in water table depth, drainage, or the amount of water the site receives. Saltgrass can survive under conditions of extreme salinity, in part due to its ability to take up salty water and extrude the salt through specialized glands on the leaves.
Key indicators of approach to transition:
--Decrease in alkali sacaton and western wheatgrass
--Increase in size and frequency of bare patches
--Increased salinity
Restoration Pathway to the Reference State (R2A) Where salinity is the limiting factor, decreasing salt concentrations by flooding may be necessary to reestablish alkali sacaton and western wheatgrass. Compacted soil layers, argillic horizons, or poor drainage may limit this alternative. Seeding, in conjunction with breaking up compaction layers or heavy soil crusts, may be necessary to reestablish grasses. Herbicidal control of dense patches of inland saltgrass prior to seeding may facilitate the establishment of more palatable grasses. Prescribed grazing will help to ensure proper forage use following grass establishment and reduce compaction.
Saltcedar-invaded State: This state is characterized by the presence of saltcedar. On areas where the water table is shallow (<4 feet) saltcedar typically occurs as scattered multi-stemmed trees (7), with an understory dominated by alkali sacaton or inland saltgrass. On areas where the water table is deeper (5-20 feet) saltcedar may eventually dominate forming a dense monoculture (4, 7) with little or no herbaceous vegetation beneath the tree canopy.
Diagnosis: Saltcedar is present on the site. Grass cover is variable ranging from patchy to very sparse. Soil sealing and crusts are present in most bare areas.
Transition to Saltcedar-invaded State (T2A) Disturbance such as fire, grazing, or drought may encourage the establishment of saltcedar by decreasing the vigor of native vegetation and providing competition-free areas. Changes in seasonal timing and rate and volume of run-on water may facilitate the establishment of saltcedar (2). Dams have reduced river volume and caused shifts in the timing of peak flow from spring to summer. The reduced flows may lower the water table, creating ideal conditions for saltcedar establishment. Summer water discharges provide water at times consistent with saltcedar seed production. Increases in salinity due to return of irrigation water to streams and ditches may also promote saltcedar dominance.
Key indicators of approach to transition:
--Increase in size and frequency of bare patches
--Changes in timing and volume of peak discharge
--Increased depth of water table
--Increased soil salinity
Restoration Pathway to the Reference State (R3A) Saltcedar control is costly and often labor intensive. Control programs utilizing herbicide, or herbicide in conjunction with mechanical control or prescribed fire, have proven effective in some instances (1, 5). Seeding may be necessary if adequate seed sources are not present. Rest from grazing, followed by prescribed grazing, will help to ensure grass establishment and proper forage use thereafter. Without restoring historical flow regimes, extensive follow-up management may be necessary to maintain the Reference State (6).
References
1. Duncan, K. W. 1994. Saltcedar: establishment, effects, and management. Wetland Journal 6: 10-13.
2. Everitt. B. L. 1980. Ecology of saltcedar – a plea for research. Environmental Geology 3: 77-84.
3. Hansen, D. J., P. Dayanandan, P.B. Kaufman, and J.D. Brotherson. 1976. Ecological adaptations of salt marsh grass, Distichlis spicata (Gramineae), and environmental factors affecting its growth and distribution. American Journal of Botany 63: 635-650.
4. Horton, J. S., F. C. Mounts, and J. M. Kraft. 1960. Seed germination and seedling establishment of phreatophytic species. Research Paper RM-48. USDA-Forest Service, Rocky Mountain Forest and Range Experiment Station, Ft. Collins, CO.
5. Neill, W. M. 1990. Pp. 91-98, In: M. R. Kunzmann, R. R. Johnson and P. S. Bennett (eds.) Tamarisk control in southwestern United States. Proceedings of Tamarisk Conference, University of Arizona, Tucson, AZ, September 23-3, 1987. Special Report No. 9. National Park Service, Cooperative National Park Resources Studies Unit, School of Renewable Natural Resources, University of Arizona, Tucson, AZ.
6. Smith S. D. and D. A. Devitt. 1996. Physiological ecology of saltcedar: why is it a successful invader? In The Fire Effects Information System [Data base]. U.S. Department of Agriculture, Forest Service, Intermountain Research Station, Intermountain Fire Sciences Laboratory (2003, January), Missoula, MT. Available: http://www.fs.fed.us/database/feis/.
7. Tesky, J.L. 1992 Tamarix ramosissima. In The Fire Effects Information System [Data base]. U.S. Department of Agriculture, Forest Service, Intermountain Research Station, Intermountain Fire Sciences Laboratory (2003, January), Missoula, MT. Available: http://www.fs.fed.us/database/feis/.
State and transition model
More interactive model formats are also available.
View Interactive Models
More interactive model formats are also available.
View Interactive Models
Click on state and transition labels to scroll to the respective text
Ecosystem states
State 1 submodel, plant communities
State 1
Reference State
Community 1.1
Reference Plant Community
Figure 3. Annual production by plant type (representative values) or group (midpoint values)
Table 5. Annual production by plant type
| Plant type | Low (lb/acre) |
Representative value (lb/acre) |
High (lb/acre) |
|---|---|---|---|
| Grass/Grasslike | 1080 | 1440 | 1800 |
| Tree | 60 | 80 | 100 |
| Forb | 60 | 80 | 100 |
| Total | 1200 | 1600 | 2000 |
Table 6. Ground cover
| Tree foliar cover | 0% |
|---|---|
| Shrub/vine/liana foliar cover | 5% |
| Grass/grasslike foliar cover | 0% |
| Forb foliar cover | 0% |
| Non-vascular plants | 0% |
| Biological crusts | 0% |
| Litter | 35% |
| Surface fragments >0.25" and <=3" | 0% |
| Surface fragments >3" | 0% |
| Bedrock | 0% |
| Water | 0% |
| Bare ground | 25% |
Figure 4. Plant community growth curve (percent production by month). NM0009, R036XB009NM Salt Meadow HCPC. R036XB009NM Salt Meadow HCPC Grassland with minor forb and shrub components..
| Jan | Feb | Mar | Apr | May | Jun | Jul | Aug | Sep | Oct | Nov | Dec |
|---|---|---|---|---|---|---|---|---|---|---|---|
| J | F | M | A | M | J | J | A | S | O | N | D |
| 0 | 0 | 3 | 5 | 10 | 10 | 25 | 30 | 12 | 5 | 0 | 0 |
Additional community tables
Table 7. Community 1.1 plant community composition
| Group | Common name | Symbol | Scientific name | Annual production (lb/acre) | Foliar cover (%) | |
|---|---|---|---|---|---|---|
|
Grass/Grasslike
|
||||||
| 1 | 480–560 | |||||
| saltgrass | DISP | Distichlis spicata | 480–560 | – | ||
| 2 | 240–320 | |||||
| alkali sacaton | SPAI | Sporobolus airoides | 240–320 | – | ||
| 3 | 80–160 | |||||
| salt sedge | CAHA5 | Carex hassei | 80–160 | – | ||
| 4 | 48–80 | |||||
| foxtail barley | HOJU | Hordeum jubatum | 48–80 | – | ||
| 5 | 48–80 | |||||
| mat muhly | MURI | Muhlenbergia richardsonis | 48–80 | – | ||
| 6 | 80–160 | |||||
| western wheatgrass | PASM | Pascopyrum smithii | 80–160 | – | ||
| 7 | 80–160 | |||||
| Nuttall's alkaligrass | PUNU2 | Puccinellia nuttalliana | 80–160 | – | ||
| 8 | 240–320 | |||||
| alkali cordgrass | SPGR | Spartina gracilis | 240–320 | – | ||
|
Forb
|
||||||
| 9 | 48–80 | |||||
| Forb (herbaceous, not grass nor grass-like) | 2FORB | Forb (herbaceous, not grass nor grass-like) | 48–80 | – | ||
| iodinebush | ALOC2 | Allenrolfea occidentalis | 48–80 | – | ||
| desert seepweed | SUSU | Suaeda suffrutescens | 48–80 | – | ||
|
Shrub/Vine
|
||||||
| 10 | 48–80 | |||||
| Shrub, deciduous | 2SD | Shrub, deciduous | 48–80 | – | ||
| fourwing saltbush | ATCA2 | Atriplex canescens | 48–80 | – | ||
| pale desert-thorn | LYPA | Lycium pallidum | 48–80 | – | ||
Interpretations
Animal community
Habitat for Wildlife:
This site provides habitats which support a resident animal community that is characterized by pronghorn antelope, coyote, striped skunk, black-tailed jackrabbit, Botta’s pocket gopher, deer mouse, banner-tailed kangaroo rat, killdeer, house finch, western spadefoot toad, short-horned lizard and leopard frog.
When seasonal shallow ponds occur, these sites are utilized by breeding amphibians, waterfowl and blackbirds.
Hydrological functions
The runoff curve numbers are determined by field investigations using hydrologic cover conditions and hydrologic soil groups.
Hydrologic Interpretations
Soil Series------------Hydrologic Group
Catman-----------------------D
Catman Variant---------------D
Gojiya-----------------------D
Sparham----------------------D
Sparham Wet------------------D
Warm Springs-----------------C
Kardewest--------------------C
Recreational uses
These sites have low potential for outdoor recreation.
In years of higher precipitation, the seasonal shallow ponds improve the opportunity for bird watching.
Wood products
This site has no significant potential for wood production.
Other products
Grazing:
This site is well suited for grazing use during all seasons of the year by both small and large animals; however, it is not suited for continuous yearlong grazing by domestic livestock if a balanced, healthy plant community is to be maintained. Periodic summer deferment is needed to maintain the productivity and lessen the probability of wind and water erosion.
Other information
Guide to Suggested Initial Stocking Rate Acres per Animal Unit Month
Similarity Index-------------Ac/AUM
100 - 76------------------2.6 – 3.0
75 – 51-------------------3.3 – 4.3
50 – 26-------------------5.3 – 6.0
25 – 0--------------------6.0+
Supporting information
Type locality
| Location 1: Rio Arriba County, NM | |
|---|---|
| Location 2: Sandoval County, NM | |
| Location 3: San Juan County, NM |
Other references
Data collection for this site was done in conjunction with the progressive soil surveys within the New Mexico and Arizona Plateaus and Mesas 36 Major Land Resource Area of New Mexico. This site has been mapped and correlated with soils in the following soil surveys: McKinley & Sandoval
Characteristic Soils Are:
Catman-------------------Catman Variant Gojiya-------------------Sparham
Sparham,wet--------------Warm Springs
Contributors
Christine Bishop
Don Sylvester
Elizabeth Wright
John Tunberg
Michael Carpinelli
Pete Lefebvre
Peter Lefebvre
Rangeland health reference sheet
Interpreting Indicators of Rangeland Health is a qualitative assessment protocol used to determine ecosystem condition based on benchmark characteristics described in the Reference Sheet. A suite of 17 (or more) indicators are typically considered in an assessment. The ecological site(s) representative of an assessment location must be known prior to applying the protocol and must be verified based on soils and climate. Current plant community cannot be used to identify the ecological site.
| Author(s)/participant(s) | |
|---|---|
| Contact for lead author | |
| Date | |
| Approved by | |
| Approval date | |
| Composition (Indicators 10 and 12) based on | Annual Production |
Indicators
-
Number and extent of rills:
-
Presence of water flow patterns:
-
Number and height of erosional pedestals or terracettes:
-
Bare ground from Ecological Site Description or other studies (rock, litter, lichen, moss, plant canopy are not bare ground):
-
Number of gullies and erosion associated with gullies:
-
Extent of wind scoured, blowouts and/or depositional areas:
-
Amount of litter movement (describe size and distance expected to travel):
-
Soil surface (top few mm) resistance to erosion (stability values are averages - most sites will show a range of values):
-
Soil surface structure and SOM content (include type of structure and A-horizon color and thickness):
-
Effect of community phase composition (relative proportion of different functional groups) and spatial distribution on infiltration and runoff:
-
Presence and thickness of compaction layer (usually none; describe soil profile features which may be mistaken for compaction on this site):
-
Functional/Structural Groups (list in order of descending dominance by above-ground annual-production or live foliar cover using symbols: >>, >, = to indicate much greater than, greater than, and equal to):
Dominant:
Sub-dominant:
Other:
Additional:
-
Amount of plant mortality and decadence (include which functional groups are expected to show mortality or decadence):
-
Average percent litter cover (%) and depth ( in):
-
Expected annual annual-production (this is TOTAL above-ground annual-production, not just forage annual-production):
-
Potential invasive (including noxious) species (native and non-native). List species which BOTH characterize degraded states and have the potential to become a dominant or co-dominant species on the ecological site if their future establishment and growth is not actively controlled by management interventions. Species that become dominant for only one to several years (e.g., short-term response to drought or wildfire) are not invasive plants. Note that unlike other indicators, we are describing what is NOT expected in the reference state for the ecological site:
-
Perennial plant reproductive capability:
Print Options
Sections
Font
Other
The Ecosystem Dynamics Interpretive Tool is an information system framework developed by the USDA-ARS Jornada Experimental Range, USDA Natural Resources Conservation Service, and New Mexico State University.
Click on box and path labels to scroll to the respective text.