Natural Resources
Conservation Service
Ecological site R035XB030NM
Sandy Loam Upland 6-10"
Last updated: 5/20/2025
Accessed: 04/02/2026
General information
Provisional. A provisional ecological site description has undergone quality control and quality assurance review. It contains a working state and transition model and enough information to identify the ecological site.
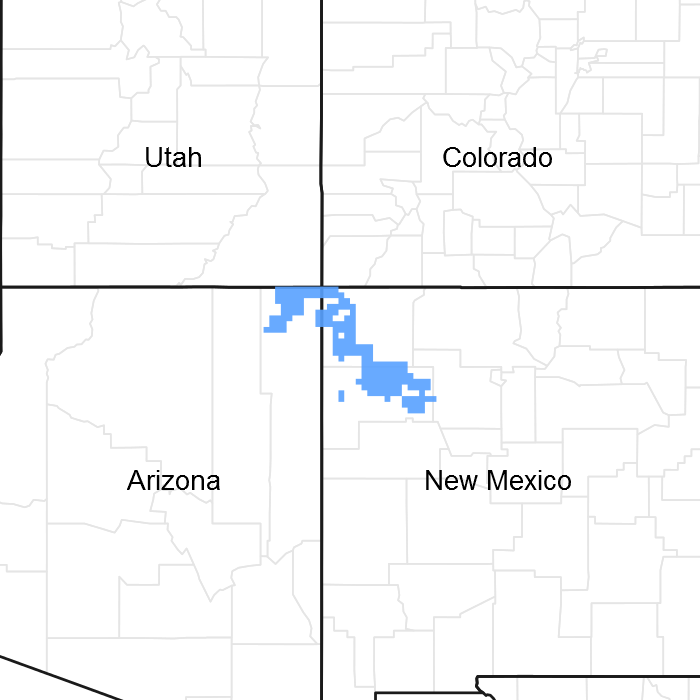
Figure 1. Mapped extent
Areas shown in blue indicate the maximum mapped extent of this ecological site. Other ecological sites likely occur within the highlighted areas. It is also possible for this ecological site to occur outside of highlighted areas if detailed soil survey has not been completed or recently updated.
Ecological site concept
This site occurs on very deep, well-drained soils. Surface textures include loamy fine sand and fine sandy loam. Landforms include elevated stream terraces, fan remnants, and cuestas. Slopes range from 1 to 8 percent.
Table 1. Dominant plant species
| Tree |
Not specified |
|---|---|
| Shrub |
(1) Atriplex canescens |
| Herbaceous |
(1) Achnatherum hymenoides |
Physiographic features
This site occurs on treads of high stream terraces, fan remnants of undulating plateaus, and cuestas. It does not benefit from run-in moisture from adjacent areas, nor does it suffer from excessive loss from runoff. It occurs on all exposures. Slopes range from 1 to 8 percent. Elevations range from 4,700 to 6,100 feet.
Table 2. Representative physiographic features
| Landforms |
(1)
Fan remnant
(2) Cuesta (3) Dip slope |
|---|---|
| Flooding frequency | None |
| Ponding frequency | None |
| Elevation | 4,700 – 6,100 ft |
| Slope | 1 – 8% |
| Water table depth | 60 in |
| Aspect | Aspect is not a significant factor |
Climatic features
Mean annual precipitation varies from 7 to 10 inches. About 60% of this moisture comes as rain from April through October. May and June are the driest months. Most of the moisture from November through March comes as snow. Winds of high velocity during late winter and early spring are common.
Mean temperature for the hottest month, July, is about 83 degrees F. Mean temperature for the coldest month, January, is about 27 degrees F. Extreme temperatures of 104 degrees F and –17 degrees F have been recorded. The frost-free period ranges from 140 to 160 days.
The cool-season plants start growth in March and end with plant maturity and seed dissemination about mid-June. During June, July, August, and September, the warm-season plants make optimum growth taking advantage of the warm temperature and moisture from tropical air out of the Gulf of Mexico. About 40% of the total precipitation is received during these summer months. The other 60% received during the fall-winter-spring months influences cool-season plants.
Table 3. Representative climatic features
| Frost-free period (average) | 160 days |
|---|---|
| Freeze-free period (average) | 165 days |
| Precipitation total (average) | 10 in |
Figure 2. Monthly precipitation range
Figure 3. Monthly average minimum and maximum temperature
Influencing water features
This is an upland site, and is not associated with water features or wetlands. During heavy rain events, this site may receive run-on moisture from landforms above and contribute runoff to landforms below.
Soil features
The soils are very deep and well drained. They are formed in alluvium and eolium derived from sandstone. Surface textures include loamy fine sand and fine sandy loam. The subsoil has textures of very fine sandy loam, fine sandy loam, loamy coarse sand, and loamy sand. Permeability is moderately rapid. Available water holding capacity is low to moderate. Runoff is very low to low, and the hazard of water erosion is very slight to slight. The hazard of soil blowing is severe. The soils are slightly to strongly alkaline (pH 7.4-9.0), nonsaline to slightly saline below 24 inches (EC 0-8), and nonsodic to slightly sodic (SAR 0-13).
Characteristic taxonomic units are:
Shiprock SSA:
120-Nageezi-Denazar (Nageezi part)
173-Shiprock fine sandy loam
205-Shiprock-Farb Complex (Shiprock part)
240-Nageezi loamy fine sand
Other soils included are:
Table 4. Representative soil features
| Surface texture |
(1) Loamy fine sand (2) Fine sandy loam |
|---|---|
| Family particle size |
(1) Loamy |
| Drainage class | Well drained |
| Permeability class | Moderately rapid |
| Soil depth | 60 – 67 in |
| Surface fragment cover <=3" | 8% |
| Surface fragment cover >3" | Not specified |
| Available water capacity (0-40in) |
4 – 6 in |
| Calcium carbonate equivalent (0-40in) |
1 – 30% |
| Electrical conductivity (0-40in) |
8 mmhos/cm |
| Sodium adsorption ratio (0-40in) |
13 |
| Soil reaction (1:1 water) (0-40in) |
7.4 – 9 |
| Subsurface fragment volume <=3" (Depth not specified) |
5% |
| Subsurface fragment volume >3" (Depth not specified) |
Not specified |
Ecological dynamics
This site has a plant community made up primarily of short- and mid-grasses, some shrubs, and a small percentage of forbs. In the original plant community there is a mixture of both cool- and warm-season grasses. Plant species most likely to invade or increase on this site when it deteriorates are cheatgrass and other annual weeds, sixweeks fescue, galleta, and broom snakeweed. Continuous livestock grazing during winter and spring will decrease the cool-season grasses, which are replaced by lower forage value grasses and shrubs
State and transition model
More interactive model formats are also available.
View Interactive Models
Click on state and transition labels to scroll to the respective text
State 1 submodel, plant communities
State 2 submodel, plant communities
State 1
Reference State
Community 1.1
Reference Plant Community
This site has a plant community made up primarily of short- and mid-grasses, some shrubs, and a small percentage of forbs. In the original plant community there is a mixture of both cool- and warm-season grasses. Plant species most likely to invade or increase on this site when it deteriorates are cheatgrass and other annual weeds, sixweeks fescue, galleta, and broom snakeweed. Continuous livestock grazing during winter and spring will decrease the cool-season grasses, which are replaced by lower forage value grasses and shrubs.
Figure 4. Annual production by plant type (representative values) or group (midpoint values)
Table 5. Annual production by plant type
| Plant type | Low (lb/acre) |
Representative value (lb/acre) |
High (lb/acre) |
|---|---|---|---|
| Grass/Grasslike | 240 | 320 | 440 |
| Shrub/Vine | 45 | 60 | 82 |
| Forb | 10 | 20 | 30 |
| Total | 295 | 400 | 552 |
Figure 5. Plant community growth curve (percent production by month). NM0380, R035XB030NM-Sandy Loam Upland 6 to 10 inch-Reference State. R035XB030NM-Sandy Loam Upland 6 to 10 inch-Reference State.
| Jan | Feb | Mar | Apr | May | Jun | Jul | Aug | Sep | Oct | Nov | Dec |
|---|---|---|---|---|---|---|---|---|---|---|---|
| J | F | M | A | M | J | J | A | S | O | N | D |
| 6 | 6 | 7 | 6 | 6 | 5 | 11 | 14 | 12 | 12 | 8 | 7 |
Community 1.2
Shrubland/Grassland
This phase is a relatively balanced mix of shrubs and native grasses.
Pathway P1.1a
Community 1.1 to 1.2
Season-long grazing providing little rest and recovery for preferred grazed plants during critical growing periods, coupled with high utilization.
Pathway P1.2a
Community 1.2 to 1.1
Prescribed grazing.
Conservation practices
| Prescribed Grazing |
|---|
State 2
Current Potential - Introduction of Non-Native Annuals
This phase is characterized by an established community of invasive annuals.
Community 2.1
Mixed Native Grassland
This phase contains a mix of native grasses.
Community 2.2
Shrubland/Grassland
This phase is a relatively balanced mix of shrubs and grasses.
Community 2.3
Warm Season Grasses
This phase is dominated by warm season grasses.
Pathway P2.1b
Community 2.1 to 2.2
Season-long grazing providing little rest and recovery for preferred grazed plants during critical growing periods, coupled with high utilization.
Pathway P2.1a
Community 2.1 to 2.3
Continuous cool-season grazing providing little rest and recovery for preferred grazed plants during critical growing periods, coupled with high utilization.
Pathway P2.2a
Community 2.2 to 2.1
Prescribed grazing
Conservation practices
| Prescribed Grazing |
|---|
Pathway P2.3a
Community 2.3 to 2.1
Prescribed grazing
Conservation practices
| Prescribed Grazing |
|---|
Pathway P2.3b
Community 2.3 to 2.2
Shrub encroachment
Conservation practices
| Prescribed Grazing |
|---|
State 3
Degraded State
This state exhibits evidence of degradation such as excessive bare ground.
State 4
Annuals State
This state is dominated by invasive annuals.
Transition T1A
State 1 to 2
Season-long grazing providing little rest and recovery for preferred grazed plants during critical growing periods, coupled with high utilization.
Transition T2A
State 2 to 3
Season-long grazing providing little rest and recovery for preferred grazed plants during critical growing periods, coupled with high utilization.
Transition T2B
State 2 to 4
Season-long grazing providing little rest and recovery for preferred grazed plants during critical growing periods, coupled with high utilization. Establishment of invasive annuals.
Restoration pathway R3A
State 3 to 2
Prescribed grazing, seeding
Conservation practices
| Range Planting | |
|---|---|
| Prescribed Grazing |
Transition T3A
State 3 to 4
Establishment of invasive annuals.
Restoration pathway R4A
State 4 to 3
Prescribed grazing, seeding
Conservation practices
| Range Planting | |
|---|---|
| Prescribed Grazing | |
| Herbicide resistant weed management |
Additional community tables
Table 6. Community 1.1 plant community composition
| Group | Common name | Symbol | Scientific name | Annual production (lb/acre) | Foliar cover (%) | |
|---|---|---|---|---|---|---|
|
Grass/Grasslike
|
||||||
| 1 | Indian ricegrass | 100–140 | ||||
| Indian ricegrass | ACHY | Achnatherum hymenoides | 100–140 | – | ||
| 2 | galleta | 40–60 | ||||
| James' galleta | PLJA | Pleuraphis jamesii | 40–60 | – | ||
| 3 | blue grama | 20–40 | ||||
| blue grama | BOGR2 | Bouteloua gracilis | 20–40 | – | ||
| 4 | sand dropseed | 0–10 | ||||
| sand dropseed | SPCR | Sporobolus cryptandrus | 0–8 | – | ||
| 5 | Fendler's threeawn | 0–10 | ||||
| Fendler's threeawn | ARPUF | Aristida purpurea var. fendleriana | 0–8 | – | ||
| 6 | Fendler (red) threeawn | 0–5 | ||||
| Fendler threeawn | ARPUL | Aristida purpurea var. longiseta | 0–4 | – | ||
| 7 | squirreltail | 10–20 | ||||
| squirreltail | ELEL5 | Elymus elymoides | 8–20 | – | ||
| 8 | mesa dropseed | 0–10 | ||||
| mesa dropseed | SPFL2 | Sporobolus flexuosus | 0–12 | – | ||
| 9 | sandhill muhly | 0–5 | ||||
| sandhill muhly | MUPU2 | Muhlenbergia pungens | 0–4 | – | ||
| 10 | other perennial grasses | 0–10 | ||||
| Grass, perennial | 2GP | Grass, perennial | 0–12 | – | ||
|
Forb
|
||||||
| 11 | rose heath (smallflower aster) | 0–10 | ||||
| rose heath | CHER2 | Chaetopappa ericoides | 0–8 | – | ||
| 12 | globemallow | 0–5 | ||||
| globemallow | SPHAE | Sphaeralcea | 0–4 | – | ||
| 13 | other perennial forbs | 0–10 | ||||
| Forb, perennial | 2FP | Forb, perennial | 0–12 | – | ||
| 14 | annual forbs | 0–10 | ||||
|
Shrub/Vine
|
||||||
| 15 | fourwing saltbush | 5–20 | ||||
| fourwing saltbush | ATCA2 | Atriplex canescens | 4–20 | – | ||
| 16 | winterfat | 0–20 | ||||
| 17 | plains pricklypear | 0–5 | ||||
| plains pricklypear | OPPO | Opuntia polyacantha | 0–4 | – | ||
| 18 | Greene's rabbitbrush | 0–5 | ||||
| Greene's rabbitbrush | CHGR6 | Chrysothamnus greenei | 0–4 | – | ||
| 19 | broom snakeweed | 5–20 | ||||
| broom snakeweed | GUSA2 | Gutierrezia sarothrae | 4–20 | – | ||
| 20 | other shrubs | 0–10 | ||||
| Shrub (>.5m) | 2SHRUB | Shrub (>.5m) | 0–8 | – | ||
Interpretations
Animal community
This site is well used by wildlife that dig or burrow and those which require open grassland.
Hydrological functions
This site normally receives about 7-10 inches of annual precipitation. Most summer rainfall occurs as brief, sometimes heavy, thunderstorms. Slopes range from 1-8 percent. Permeability is moderately rapid. Runoff is very low to low, and the hazard of water erosion is very slight to slight.
Recreational uses
Open grasslands of the undulating plateaus and cuestas of this site are aesthetically appealing and provide recreational activities such as hunting, horseback riding, and wildlife observation.
Wood products
This site has no significant value for wood products.
Other products
Grazing: This site is suitable for yearlong grazing by all classes of livestock. Grazing systems adapt well to this site and should be used. This site is susceptible to erosion, particularly overgrazed areas, old roads, cattle trails, and high-use areas.
Supporting information
Inventory data references
The potential historic climax plant community has been determined by study of range relict areas or areas protected from excessive grazing. Trends in plant communities going from heavily grazed areas to lightly grazed areas, seasonal use pastures, and historical accounts have also been used.
Type locality
| Location 1: San Juan County, NM | |
|---|---|
| Township/Range/Section | T25N R17W S15 |
| General legal description | Little Water Topographic Quadrangle – 5 miles ESE of Little Water, NM Section 15, Township 25N, Range 17W – Navajo Reservation, NM. |
Contributors
David Trujillo
John Tunberg
Michael Carpinelli
Unknown
Approval
Kendra Moseley, 5/20/2025
Rangeland health reference sheet
Interpreting Indicators of Rangeland Health is a qualitative assessment protocol used to determine ecosystem condition based on benchmark characteristics described in the Reference Sheet. A suite of 17 (or more) indicators are typically considered in an assessment. The ecological site(s) representative of an assessment location must be known prior to applying the protocol and must be verified based on soils and climate. Current plant community cannot be used to identify the ecological site.
| Author(s)/participant(s) | |
|---|---|
| Contact for lead author | |
| Date | 05/23/2025 |
| Approved by | Kendra Moseley |
| Approval date | |
| Composition (Indicators 10 and 12) based on | Annual Production |
Indicators
-
Number and extent of rills:
-
Presence of water flow patterns:
-
Number and height of erosional pedestals or terracettes:
-
Bare ground from Ecological Site Description or other studies (rock, litter, lichen, moss, plant canopy are not bare ground):
-
Number of gullies and erosion associated with gullies:
-
Extent of wind scoured, blowouts and/or depositional areas:
-
Amount of litter movement (describe size and distance expected to travel):
-
Soil surface (top few mm) resistance to erosion (stability values are averages - most sites will show a range of values):
-
Soil surface structure and SOM content (include type of structure and A-horizon color and thickness):
-
Effect of community phase composition (relative proportion of different functional groups) and spatial distribution on infiltration and runoff:
-
Presence and thickness of compaction layer (usually none; describe soil profile features which may be mistaken for compaction on this site):
-
Functional/Structural Groups (list in order of descending dominance by above-ground annual-production or live foliar cover using symbols: >>, >, = to indicate much greater than, greater than, and equal to):
Dominant:
Sub-dominant:
Other:
Additional:
-
Amount of plant mortality and decadence (include which functional groups are expected to show mortality or decadence):
-
Average percent litter cover (%) and depth ( in):
-
Expected annual annual-production (this is TOTAL above-ground annual-production, not just forage annual-production):
-
Potential invasive (including noxious) species (native and non-native). List species which BOTH characterize degraded states and have the potential to become a dominant or co-dominant species on the ecological site if their future establishment and growth is not actively controlled by management interventions. Species that become dominant for only one to several years (e.g., short-term response to drought or wildfire) are not invasive plants. Note that unlike other indicators, we are describing what is NOT expected in the reference state for the ecological site:
-
Perennial plant reproductive capability:
Print Options
Sections
Font
Other
The Ecosystem Dynamics Interpretive Tool is an information system framework developed by the USDA-ARS Jornada Experimental Range, USDA Natural Resources Conservation Service, and New Mexico State University.
Click on box and path labels to scroll to the respective text.