
Natural Resources
Conservation Service
Ecological site R080AY025OK
Depressional Upland
Last updated: 9/19/2023
Accessed: 04/14/2025
General information
Provisional. A provisional ecological site description has undergone quality control and quality assurance review. It contains a working state and transition model and enough information to identify the ecological site.
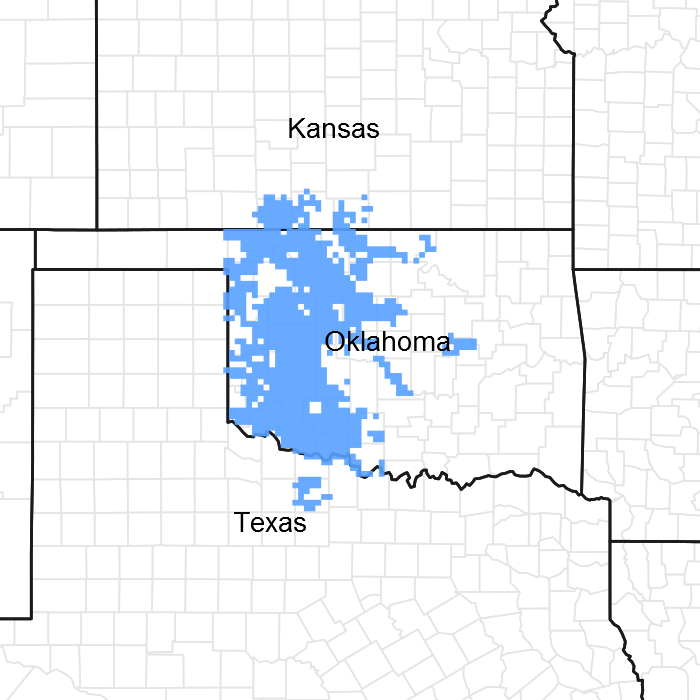
Figure 1. Mapped extent
Areas shown in blue indicate the maximum mapped extent of this ecological site. Other ecological sites likely occur within the highlighted areas. It is also possible for this ecological site to occur outside of highlighted areas if detailed soil survey has not been completed or recently updated.
MLRA notes
Major Land Resource Area (MLRA): 080A–Central Rolling Red Prairies
MLRA 80A is characterized by dark red Permian rocks that are exposed on gently sloping plains. These plains are dissected by rivers that flow from northwest to southeast. Major rivers of this MLRA include the Chikaskia and Bluff rivers in KS, the Salt Fork, Cimarron, North and South Canadian, Washita, Cache, Red River in OK, and branches of the Wichita River in TX. Soils are generally well drained, loamy or clayey deposits overlying Permian sandstones or shales.
Classification relationships
This ecological site is correlated to soil components at the Major Land Resource Area (MLRA) level which is further described in USDA Ag Handbook 296.
Ecological site concept
These sites range from small to broad depressional areas associated with Sandy Loam Upland and Deep Sand ecosites in MLRA 80A. They are sometimes referred to as “Carwile Depressions” as they are unique to delineations of the Carwile soil series. These soils are typically finer in texture than the surrounding soils and will tend to perch water in the upper soil profile for periods during the year. The vegetation of the reference ecological state is composed of a mixture of tallgrass, midgrass, and shortgrass species along with a variety of forbs. Historically, the woody species were limited to only the wettest, fire protected areas. Although, with the absence of fire, many of the sites may experience increased encroachment my woody species.
Across MLRA 80A, a majority of these Carwile depressions have been converted to cropland with the exception of the most sandy areas. Many of the sites that do remain intact have been encroached upon by woody species such as Black Willow, Eastern Cottonwood, and even Hedge in the eastern portions of the MLRA.
While these sites are often inclusional areas and can be quite small in extent, they may warrant special consideration when making management decisions.
Associated sites
| R080AY022OK |
Dune Adjacent sites. Course textured soils of higher relief. Not episaturated. |
|---|
Similar sites
| R080AY094OK |
Wet Sandy Upland Similar landscape. Coarse textured soil. Endosaturated (high water table). |
|---|
Table 1. Dominant plant species
| Tree |
(1) Salix nigra |
|---|---|
| Shrub |
(1) Baccharis salicina |
| Herbaceous |
(1) Panicum virgatum |
Physiographic features
These sites occur on nearly level or concave treads of stream terraces, or depressions of sand sheets on alluvial plains.
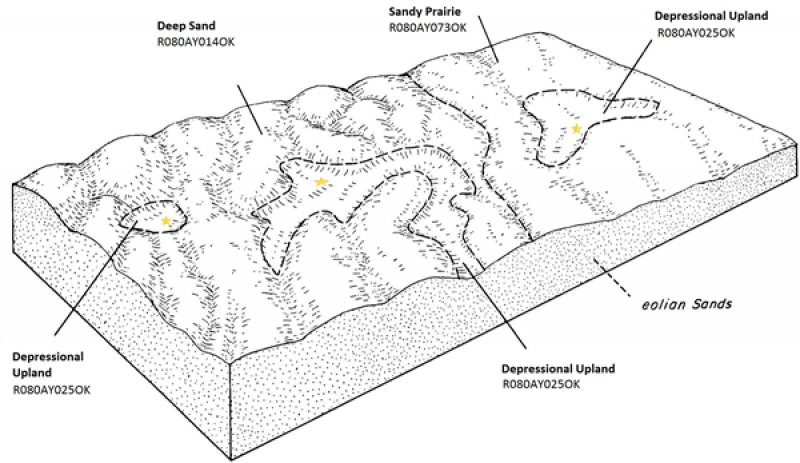
Figure 2. Depressional Upland
Table 2. Representative physiographic features
| Landforms |
(1)
Alluvial plain
> Depression
(2) Sandhills > Depression |
|---|---|
| Runoff class | Very low to low |
| Flooding frequency | None |
| Ponding duration | Long (7 to 30 days) |
| Ponding frequency | Frequent |
| Elevation | 305 – 762 m |
| Slope | 0 – 3% |
| Ponding depth | 0 – 30 cm |
| Water table depth | 0 – 91 cm |
| Aspect | Aspect is not a significant factor |
Climatic features
The climate is characterized by moist, cool, springs; hot, often dry summers; mild autumns; and mild to cold winters. Variation in timing and amounts of precipition from year to year is quite common. Drought cycles range from three to five years duration with occasionally longer periods occurring at unpredictable intervals. Above normal rainfall cycles are usually just as random, but shorter in duration.
Table 3. Representative climatic features
| Frost-free period (characteristic range) | 168-185 days |
|---|---|
| Freeze-free period (characteristic range) | 194-205 days |
| Precipitation total (characteristic range) | 838-889 mm |
| Frost-free period (actual range) | 155-187 days |
| Freeze-free period (actual range) | 190-205 days |
| Precipitation total (actual range) | 787-965 mm |
| Frost-free period (average) | 176 days |
| Freeze-free period (average) | 199 days |
| Precipitation total (average) | 864 mm |
Figure 3. Monthly precipitation range
Figure 4. Monthly minimum temperature range
Figure 5. Monthly maximum temperature range
Figure 6. Monthly average minimum and maximum temperature
Figure 7. Annual precipitation pattern
Figure 8. Annual average temperature pattern
Climate stations used
-
(1) ENID [USC00342912], Enid, OK
-
(2) JEFFERSON [USC00344573], Medford, OK
-
(3) OKEENE [USC00346629], Okeene, OK
-
(4) PONCA CITY MUNI AP [USW00013969], Ponca City, OK
-
(5) CHEROKEE 4W [USC00341724], Cherokee, OK
-
(6) GUTHRIE 5S [USC00343821], Guthrie, OK
Influencing water features
The Carwile soil series is listed on the national hydric soils list. There are sometimes areas of wetland vegetation found on these depressional upland sites due to the presence of ponded and/or saturated surface layers. Consult a trained specialist when attempting to delineate wetland areas.
Wetland description
These sites would be categorized as palustrine systems as they are not associated with lakes or rivers.
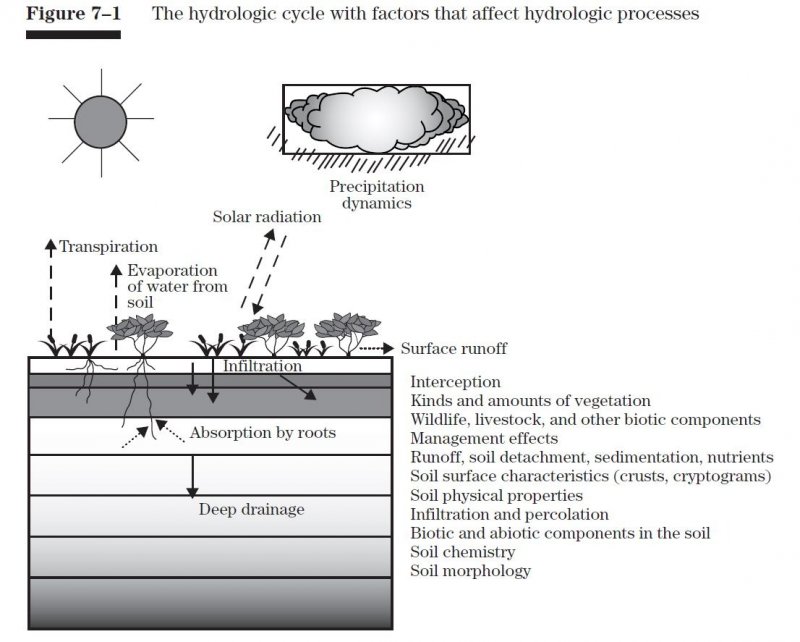
Figure 9.
Soil features
Soils are mapped for each county within the MLRA. Mapunits are representations of the major soil series component(s) and named accordingly. Each Mapunit is spatially represented on a digital soils map as polygons of different shapes and sizes. Within these Mapunits, there are often minor soil series components included. These minor components are soils that occur within a Mapunit polygon but are of small extent (15% or less of the Mapunit area). However, it is difficult to separate these minor soils spatially due to the scale of soil mapping.
Ecological sites are correlated at the component level of the soil survey. Therefore, a single Mapunit may contain multiple Ecological Sites just as it may contain multiple soil components. This is important to understand when investigating soils and Ecological Sites. A soil survey Mapunit may be correlated to a single Ecological Site based on the major component; however, there may be inclusional areas of additional Ecological Sites which are correlated to the minor components of that particular soil Mapunit.
Representative soils for this site include:
Carwile Loam
The Carwile series consists of very deep, poorly drained, slowly permeable soils that formed in loamy alluvium or eolian sediments of Pleistocene age. They are classified as Fine, mixed, superactive, thermic Typic Argiaquolls.They typically occur in concave areas among coarser textured rolling sand hills and dunes. These soils are episaturated (ponded) at depths from 0 to 2 feet below the soil surface for periods of the year due to the slowly permeability of the subsoil.
The Carwile soil series is currently mapped across MLRAs 78C and 80A. However, as these soil surveys are updated, the Carwile soil series mapped in 80A will most likely be re-correlated to a new or different soil series. The ecological dynamics listed in this report will remain the same, regardless of the soil re-correlation activities.
It is important to distinguish these soils from the Daycreek and Goltry series as they are present in similar landscape positions (interdunal). However, Daycreek and Goltry soil have a high water table and are subjected to endosaturation as opposed to the perched (ponded) water of the Carwile series.
Table 4. Representative soil features
| Parent material |
(1)
Alluvium
–
sandstone and shale
|
|---|---|
| Surface texture |
(1) Loam |
| Family particle size |
(1) Clayey |
| Drainage class | Poorly drained |
| Permeability class | Slow to moderate |
| Soil depth | 203 cm |
| Surface fragment cover <=3" | 0 – 1% |
| Surface fragment cover >3" | 0 – 1% |
| Available water capacity (0-101.6cm) |
17.78 – 30.48 cm |
| Calcium carbonate equivalent (0-101.6cm) |
0% |
| Electrical conductivity (0-101.6cm) |
0 mmhos/cm |
| Sodium adsorption ratio (0-101.6cm) |
0 |
| Soil reaction (1:1 water) (0-101.6cm) |
5 – 7.5 |
| Subsurface fragment volume <=3" (Depth not specified) |
0 – 1% |
| Subsurface fragment volume >3" (Depth not specified) |
0 – 1% |
Ecological dynamics
The information in this ecological site description (ESD), including the state-and-transition model (STM), was developed using archeological and historical data, professional experience, and scientific studies. The information is representative of a complex set of plant communities. Not all scenarios or plants are included. Key indicator plants, animals, and ecological processes are described to inform land management decisions.
This ecological site evolved under disturbances from periodic grazing, fluctuating growing conditions, and fire. Historically, large herds of migratory bison traveled across the Great Plains region, often following naturally occurring fires in order to graze the palatable and nutritious regrowth. The reference state for this ecological site represents the historical variability between plant communities. This variability was affected by several different ecological drivers including time since fire, time since grazing, and changes in precipitation patterns.
With the European settlement of the Great Plains, some of these disturbances were removed from the ecosystem while other disturbances were introduced. With settlement came fire suppression. So without these fires, woody species were able to grow unrestricted and become more dominant in some of the resulting plant communities. Fences were also introduced at this time and allowed domestic cattle to be confined to smaller areas for long periods of time. These fences, coupled with the lack of proper grazing management, led to a decline of some more palatable tallgrasses and forb species. As the site deteriorates from abusive grazing, absence of fire, or both, other plant communities may result. These communities include a midgrass/shortgrass community and a shrub dominant community.
Mechanized agriculture also had a profound impact on the ecology of some of these sites. Although the coarse textured soils are not ideal for crop production, many areas were broke out for farming purposes during the first half of the twentieth century. This cultivation permanently changed the soil structure, biota, and hydrology on these sites. These farmed areas became prone to wind erosion and many of them were eventually planted back to native or introduced perennial vegetation.
The reference plant community is the interpretive plant community for this site. This plant community is dominated by warm season, perennial tall and midgrasses. These grass species are intermixed and well distributed over the site. Some plants are strongly rhizomatous and often form colonies six to ten feet across. Production is quite variable from year to year. This site can be very droughty when rainfall is below normal and although the soils may have a higher available water content than the adjacent sandy soils, the clay particles can hold the water and impede use by the plant species. While woody plants may persist on these sites, they were historically limited by the periodic fires that burned across the landscape. Without fire, some woody species may begin to dominate the energy flow of the site and transition the site to an alternative state.
A state-and-transition model diagram for the Depressional Upland ecological site is shown after this narrative. The descriptions of each state, transition, community phase, and community pathway follow the model. The model is based on expert evaluation of available experimental research, field observations, professional consensus, and interpretations. It is likely to change as knowledge increases.
Plant community response differs across the MLRA because of the naturally occurring variability in weather, soils, and aspect. The reference community phase is not necessarily the management goal. Other vegetative states may be desired plant communities if range health assessments are in the moderate category and above. The biological processes on this site are complex. Representative values are therefore presented in a land management context. The species lists are representative. They are not botanical descriptions of all species occurring, or potentially occurring, on this site. They are not intended to cover every situation or the full range of conditions, species, and responses for the site.
Percent species composition by weight, percent canopy cover, and other metrics may be described. Most observers find it easier to visualize or estimate percent canopy for woody species (trees and shrubs) than to visualize or estimate production by weight. Because of the influence of shade and interception of rainfall, canopy cover can drive the transitions between communities and states. Species composition by air-dry weight is used for describing the herbaceous community and the community as a whole. Woody species are included in species composition for the site.
The plant production figures in this report are representative estimates based on limited clipping data, site visits, and professional consensus. As with anything in nature, expect some degree of variability from site to site.
State and transition model
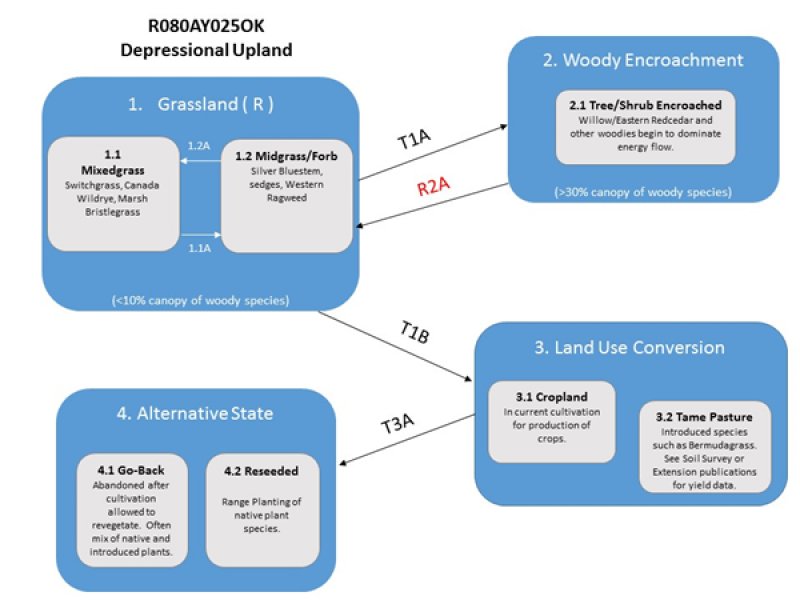
Figure 10. Depressional Upland
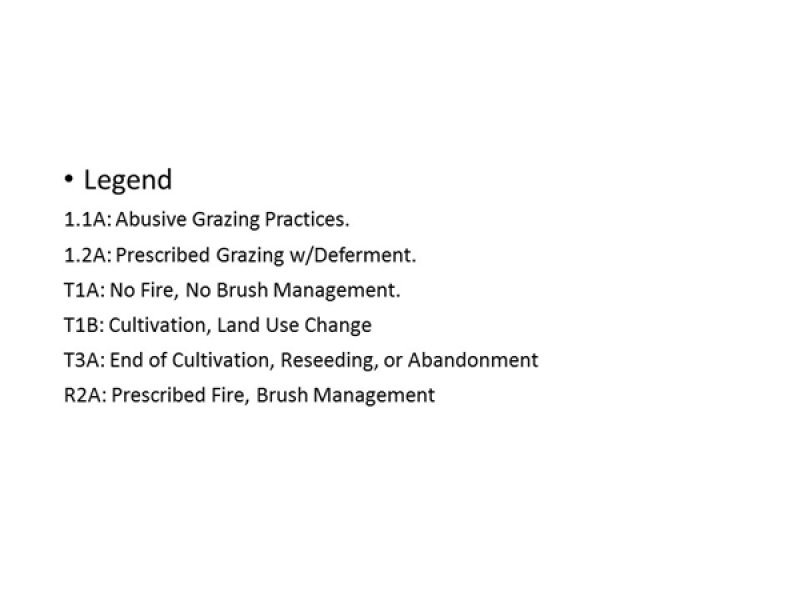
Figure 11. Depressional Upland
More interactive model formats are also available.
View Interactive Models
More interactive model formats are also available.
View Interactive Models
Click on state and transition labels to scroll to the respective text
State 1 submodel, plant communities
State 2 submodel, plant communities
State 3 submodel, plant communities
State 4 submodel, plant communities
State 1
Grassland
This is the representative state for the Depressional Upland ecological site. It represents the natural variability in plant communities under the evolutionary disturbance regime. The plant communities within this state have been subjected to periodic fires and grazing events with varying lengths of rest periods. Woody species, if present, are generally less than 10 percent canopy cover. This ecological state supports a mixture of grasses and forbs and maintains a resilient plant community under natural conditions.
Dominant plant species
-
switchgrass (Panicum virgatum), grass
-
fogfruit (Phyla), other herbaceous
Community 1.1
Mixedgrass

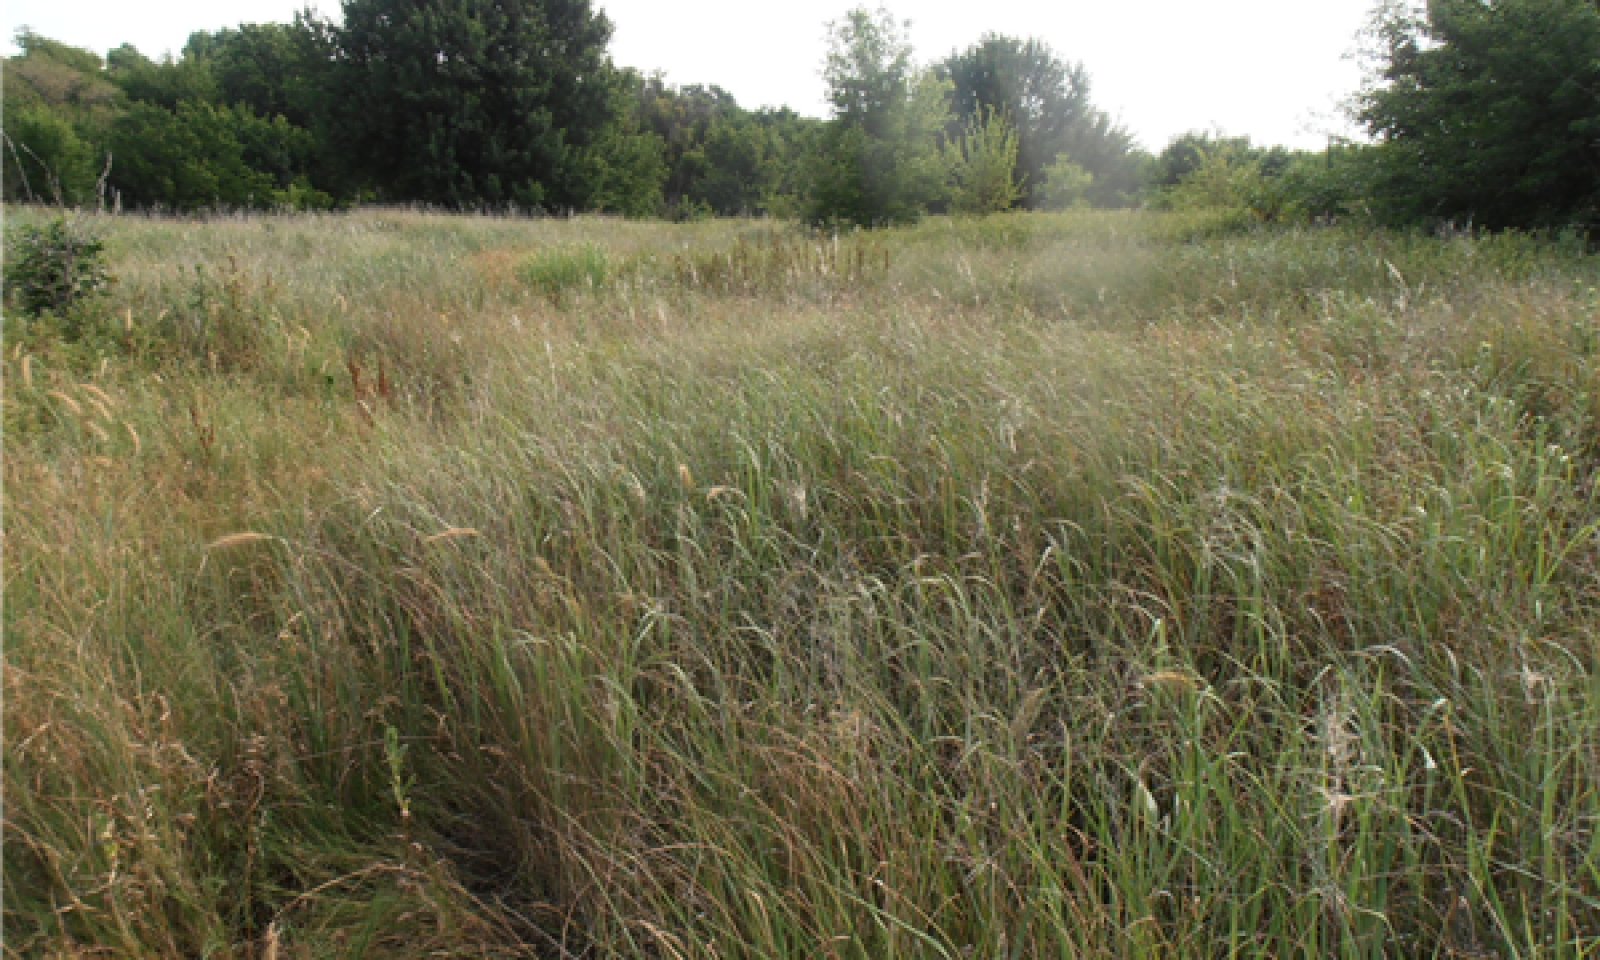
Figure 12. Community 1.1, Carwile Soils, Grant County, OK 2015. Invading Hedge trees around edge of site.
This plant community is dominated by a mixture of grass and forb species adapted to periodically saturated growing conditions. Due to the concave topography of these sites, it is not uncommon to observe distinct changes in species across the site due to the changes in wetness. In the lowest points, hydrophytic species such as Frogfruit (Phyla spp.) smartweed (Polygonum spp.) and spikerush (Eleocharis spp.) are quite common as these areas stay wet for longer periods of time. Some shortgrass species adapted to periodic inundation may also persist in the wettest areas. Mid and tallgrass species including Switchgrass, Western Wheatgrass, and Canada Wildrye thrive in areas across the site. Major forbs may include Blanketflower (Gaillardia spp.), Golden Tickseed (Coreopsis tinctoria), Sagewort (Artemisia ludoviciana), and Western Ragweed (Ambrosia psilostachya). Woody species, if present, may include Black Willow (Salix nigra), Willow Baccharis (Baccharis salcina), and occasionally coralberry (Symphoricarpos orbiculatus) towards the eastern extent of the site. Like most sites in the Great Plains, this plant community evolved under periodic disturbances from fire and grazing. The woody species were restricted by a fire return interval of 2-5 years. After these fires, bison would often move in and graze the fresh new growth of the grasses and forbs before moving on across the landscape allowing the recently grazed areas to rest. This plant community represents the result of this rest period and the recovery of the plant community. Bare ground is typically less than 5 percent with litter residue covering 75 percent of the soil between plants. The abundance of site in this condition are uncertain as many of these sites within MLRA 80A have been farmed at some point in the last century. Every effort has been made to locate and identify representative sites for this plant community, however, many sites were subject to invasion by Hedge trees or Johnsongrass as seen in the pictures.
Figure 13. Annual production by plant type (representative values) or group (midpoint values)
Table 5. Annual production by plant type
| Plant type | Low (kg/hectare) |
Representative value (kg/hectare) |
High (kg/hectare) |
|---|---|---|---|
| Forb | 3379 | 4506 | 5632 |
| Grass/Grasslike | 1564 | 2085 | 2606 |
| Shrub/Vine | 50 | 67 | 84 |
| Tree | 50 | 67 | 84 |
| Total | 5043 | 6725 | 8406 |
Table 6. Ground cover
| Tree foliar cover | 0-5% |
|---|---|
| Shrub/vine/liana foliar cover | 0-5% |
| Grass/grasslike foliar cover | 60-90% |
| Forb foliar cover | 10-40% |
| Non-vascular plants | 10-40% |
| Biological crusts | 0-5% |
| Litter | 60-80% |
| Surface fragments >0.25" and <=3" | 0% |
| Surface fragments >3" | 0% |
| Bedrock | 0% |
| Water | 0-10% |
| Bare ground | 0-10% |
Community 1.2
Midgrass/Forb
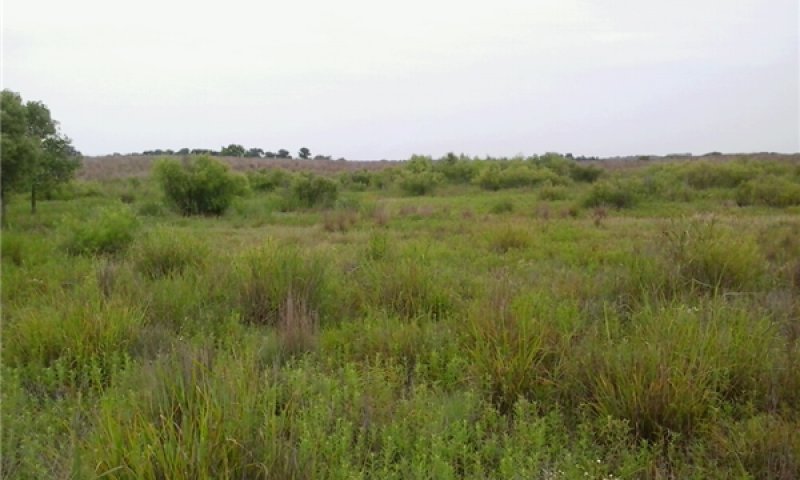
Figure 14. Community Phase 1.2, Carwile Soils, Eastern Woods Co. OK
This plant community phase is usually the result of abusive grazing practices that exceed the carrying capacity for the given site. The plant community has shifted to favor the less palatable plants and the plants that are more resilient under heavy grazing. Litter coverage may be reduced. Hydrophytic plants still occupy the lowest, wettest areas. Threeawn (Aristida spp.), Little Barley (Hordeum pusillum), and Western Ragweed have increased in abundance due to the increased disturbance. This plant community is often found around watering facilities where cattle loiter after drinking. This community phase may be at an increased risk of woody plant encroachment due to the lack of fuel load and continuity for effective prescribed burning.
Pathway 1.1A
Community 1.1 to 1.2


Community Pathway Narrative: Under conditions of abusive grazing above the carrying capacity, the plant community may shift towards the less palatable mid and shortgrass species. Species such as Switchgrass and Wildrye may give way to Sand Dropseed (Sporobolus cryptandrus), Silver Bluestem (Bothriacloa laguroides), Gummy Lovegrass (), and many opportunistic forbs. Depending on the timing of these grazing events, cool season grass and grasslikes may become more abundant also.
Pathway 1.2A
Community 1.2 to 1.1


With adequate rest the shortgrass/forb plant community may be shifted back towards the community described in 1.1. The amount of rest required for this shift depends on the remaining plants and precipitation patterns.
State 2
Woody Encroachment
In this vegetative state, woody species have encroached at levels above 30 percent canopy coverage. These species can intercept rainfall and can begin to shade out some of the herbaceous vegetation. As woody species increase, they can alter the energy flow and hydrology of the site.
Dominant plant species
-
willow (Salix), shrub
-
baccharis (Baccharis), shrub
-
eastern redcedar (Juniperus virginiana), shrub
Community 2.1
Woody
The plant community has transitioned from the reference state and has been influenced by the dominance of woody species. These species may include Black Willow, Willow Baccharis, Eastern Cottonwood, Hedge, and Eastern Redcedar (during dry periods). Due to the periodically wet conditions, this site may be vulnerable to the invasion by Saltcedar (Tamarix spp.) if a seed source is introduced. The increasing woody cover has a negative impact on the herbaceous plant community by shading sunlight and impacting hydrologic flow. These woody species also make suitable perched for avian predators and may reduce the wildlife habitat potential for some species.
State 3
Land Use Conversion
This ecological state is the result if a conversion in land use from rangeland to cropland or tame pasture. The site has been plowed and much of the soil structure in the top six to twelve inches has been compromised. Within this state, soil microbial activity is often decrease and both the energy flow and hydrology have been altered from the reference state.
Dominant plant species
-
Bermudagrass (Cynodon dactylon), grass
Community 3.1
Cropland
This plant community can vary from site to site depending on the production system. Most sites in production are planted to small grains with the rare exception of canola or sorghum. Refer to Ag extension publications or Soil Survey crop production reports for soil specific crop yield data.
Community 3.2
Tame Pasture
This plant community is often a monoculture of an introduced species. Species diversity is low along with potential for wildlife habitat. Consult the local soil survey manuscript or web soil survey for potential yields of introduced species.
State 4
Alternative State
This state represents plant communities that follow cultivation or other soil disturbing activities (pipelines, etc.). The sites may have been replanted to native species or abandoned to let whatever seed source remained take over.
Dominant plant species
-
little bluestem (Schizachyrium scoparium), grass
-
Bermudagrass (Cynodon dactylon), grass
Community 4.1
Go-Back
This plant community is the result of abandonment after cultivation or other soil disturbing event. There is a large amount of variability in plant species and amounts depending on many factors including length of time in cultivation, remnant seedstock, and precipitation patterns. Often, there are large amounts of Silver Bluestem, Little Barley, Annual Forbs, and Brome species.
Community 4.2
Range Planting
Often, when managers wish to convert cropland back to native vegetation, they will develop a seeding mix of desired species. This process of re-establishing native plants may take several years. The species of a reseeded community will vary depending on the planting mix and conditions after the planting. While a successful range planting can re-establish most of the plants of the reference state, soil properties have been altered significantly and the site may not ever regain the full ecological function.
Transition T1A
State 1 to 2
With the removal of fire from the ecosystem, woody plants may increase in abundance. These woody species may continue to encroach and begin to impact the energy flow and hydrology of site if left uncontrolled through prescribed fire or other brush management practices.
Transition T1B
State 1 to 3
In many cases, the Depressional Upland site has been plowed and farmed with the adjacent sandy or sandy loam areas. Once the site has been cultivated, the soil structure has been changed and the microbiology of the soil has been altered from that of the reference state.
Restoration pathway R2A
State 2 to 1
In most instances, a brush management program will need to be implemented to decrease the woody plant density. Following control of the larger woody species, a program of periodic prescribed fire should be implemented in order to control sapling growth and prevent future encroachment.
Transition T3A
State 3 to 4
Once cultivation has ceased on the site, the site may be reseeded to native vegetation or abandoned and left to revegetate naturally.
Additional community tables
Table 7. Community 1.1 plant community composition
| Group | Common name | Symbol | Scientific name | Annual production (kg/hectare) | Foliar cover (%) | |
|---|---|---|---|---|---|---|
|
Grass/Grasslike
|
||||||
| 1 | – | |||||
| switchgrass | PAVI2 | Panicum virgatum | – | – | ||
| western wheatgrass | PASM | Pascopyrum smithii | – | – | ||
| Canada wildrye | ELCA4 | Elymus canadensis | – | – | ||
|
Forb
|
||||||
| 2 | – | |||||
| blanketflower | GAILL | Gaillardia | – | – | ||
| tickseed | COREO2 | Coreopsis | – | – | ||
| sweet sagewort | ARAN3 | Artemisia annua | – | – | ||
| ragweed | AMBRO | Ambrosia | – | – | ||
|
Tree
|
||||||
| 3 | – | |||||
| black willow | SANI | Salix nigra | – | – | ||
| coralberry | SYOR | Symphoricarpos orbiculatus | – | – | ||
Interpretations
Animal community
The plant communities of the reference state have good value for grazing by domestic animals. It also has good value as food and cover for numerous species of wildlife. It provides excellent habitat for northern bobwhite quail. White-tailed deer and wild turkey may frequent the site. A great variety of song birds utilize this site for summer habitat. For more specific guidance, refer to Wildlife Habitat Appraisal Guides that are species specific.
Hydrological functions
These sites exhibit much different hydrology than the surrounding sandhills. They are subjected to runoff from the adjacent areas by both surface movement and subsurface lateral movement of water. This run-on hydrology coupled with the slowly permeable, fine textured subsoil, creates episaturation (perched water table) of the upper soil horizons. Therefore, while the surface may stay wet for extended periods, it actually takes much longer for the water to infiltrate these soils as opposed to the adjacent sandy soils.
Once the sites are cultivated and the soil structure is altered, the hydrology will often change and may not exhibit the same episaturation and water holding capacity of the non-cultivated states.
Recreational uses
Areas around these sites are well known in Oklahoma for its quail hunting. A multitude of mammals and birds frequent this site, so it is a great area to observe and study Oklahoma animal and plant life. This site is used for many common recreational activities such as hiking, camping, bird watching, hunting and horseback riding.
Wood products
There are no marketable wood products associated with these sites.
Other products
NA
Other information
The concepts and descriptions presented in this ESD are the product of a combination of historical descriptions, previous drafts, field work, and professional consensus. This report is not intended serve as a complete botanical description, or cover every possible management scenario. It should be considered a working draft and any analysis, input, or constructive critique is welcomed.
Supporting information
Inventory data references
NRI 1 2003-2006 OK Alfalfa
Field Sampling 1 2015 OK Woods
Field Sampling 1 2015 OK Grant
Type locality
| Location 1: Woodward County, OK | |
|---|---|
| Township/Range/Section | T23 N R19W S2 |
| General legal description | Woodward County, Oklahoma; 1/2 mile east and 3 miles north of Mooreland; 1300 feet north and 100 feet west of SE corner of sec. 2, T. 23 N., R. 19 W |
References
-
Bestelmeyer, B., J.R. Brown, K.M. Havstad, B. Alexander, G. Chavez, and J.E. Herrick. 2003. Development and Use of State and Transition Models for Rangelands. Jornal of Range Management 56:114–126.
-
Fuhlendorf, S.D., D.M. Engle, J. Kerby, and R. Hamilton. 2009. Pyric Herbivory: Rewilding Landscapes through the Recoupling of Fire and Grazing. Conservation Biology 23:588–598.
Other references
Barnes, P. W., and A. T. Harrison. 1982. Species distribution and community
organization in a Nebraska Sandhills mixed prairie as influenced by plant/ soil water
relationships. Oecologia (Bed.) 52: 192-20l.
Harlan, J. R. (1957). Grasslands of Oklahoma.
National Soil Information System (NASIS). Accessed 2013
Noy-Meir, I. 1973. Desert Ecosystems: Environment and Producers. Annual Review of Ecology and Systematics, 4:25-51.
Shantz, H. L. (1923). The natural vegetation of the Great Plains region. Annals of the Association of American Geographers, 13(2), 81-107.
Shiflet, T. N. (1994). Rangeland cover types of the United States (Vol. 152). Denver, CO, USA: Society for Range Management.
USDA NRCS Plants Database. Online.
Contributors
Colin Walden Range Management Specialist Stillwater OK
Dr. Jack Eckroat, Grazing Lands Specialist, NRCS, Oklahoma
Approval
Bryan Christensen, 9/19/2023
Acknowledgments
Site Development and Testing Plan
Future work, as described in a Project Plan, to validate the information in this Provisional Ecological Site Description is needed. This will include field activities to collect low, medium and high intensity sampling, soil correlations, and analysis of that data. Annual field reviews should be done by soil scientists and vegetation specialists. A final field review, peer review, quality control, and quality assurance reviews of the ESD will be needed to produce the final document.
Annual reviews of the Project Plan are to be conducted by the Ecological Site Technical Team.
Rangeland health reference sheet
Interpreting Indicators of Rangeland Health is a qualitative assessment protocol used to determine ecosystem condition based on benchmark characteristics described in the Reference Sheet. A suite of 17 (or more) indicators are typically considered in an assessment. The ecological site(s) representative of an assessment location must be known prior to applying the protocol and must be verified based on soils and climate. Current plant community cannot be used to identify the ecological site.
| Author(s)/participant(s) | Jack Eckroat, Harry Fritzler, Steve Glasgow(edits by Colin Walden 2015) |
|---|---|
| Contact for lead author |
100 USDA Suite 206 Stillwater, OK 74074 |
| Date | 12/12/2018 |
| Approved by | Bryan Christensen |
| Approval date | |
| Composition (Indicators 10 and 12) based on | Annual Production |
Indicators
-
Number and extent of rills:
None -
Presence of water flow patterns:
Very few, some drains visible -
Number and height of erosional pedestals or terracettes:
None -
Bare ground from Ecological Site Description or other studies (rock, litter, lichen, moss, plant canopy are not bare ground):
< 10% This site will have variable bare ground and is controlled by frequency and duration of inundation. -
Number of gullies and erosion associated with gullies:
None -
Extent of wind scoured, blowouts and/or depositional areas:
None -
Amount of litter movement (describe size and distance expected to travel):
Only litter movement would be during high intensity storms. Concave topography should limit movement. -
Soil surface (top few mm) resistance to erosion (stability values are averages - most sites will show a range of values):
Stability Class 4+. Stable with abundant organic matter in surface. -
Soil surface structure and SOM content (include type of structure and A-horizon color and thickness):
Refer to specific description for component sampled. -
Effect of community phase composition (relative proportion of different functional groups) and spatial distribution on infiltration and runoff:
Mixed grass community promotes infiltration. However, the nature of the soils restrict infiltration. The main runoff will be during high rainfall events. -
Presence and thickness of compaction layer (usually none; describe soil profile features which may be mistaken for compaction on this site):
None -
Functional/Structural Groups (list in order of descending dominance by above-ground annual-production or live foliar cover using symbols: >>, >, = to indicate much greater than, greater than, and equal to):
Dominant:
Tallgrass Midgrass Cool Season Perennial GrassSub-dominant:
Annual Forbs Perennial ForbsOther:
ShrubsAdditional:
-
Amount of plant mortality and decadence (include which functional groups are expected to show mortality or decadence):
Some mortality and decadence can be expected but less than 5%. -
Average percent litter cover (%) and depth ( in):
60-80% at a depth of less than 1 inch. Depending on time since fire. -
Expected annual annual-production (this is TOTAL above-ground annual-production, not just forage annual-production):
Total production is about 4500-7500# per acre -
Potential invasive (including noxious) species (native and non-native). List species which BOTH characterize degraded states and have the potential to become a dominant or co-dominant species on the ecological site if their future establishment and growth is not actively controlled by management interventions. Species that become dominant for only one to several years (e.g., short-term response to drought or wildfire) are not invasive plants. Note that unlike other indicators, we are describing what is NOT expected in the reference state for the ecological site:
None. Potentially Hedge, Cedar(if dry enough), willow, and cottonwood. -
Perennial plant reproductive capability:
All species are capable of reproducing annually, both vegetatively and by seed.
Print Options
Sections
Font
Other
The Ecosystem Dynamics Interpretive Tool is an information system framework developed by the USDA-ARS Jornada Experimental Range, USDA Natural Resources Conservation Service, and New Mexico State University.
Click on box and path labels to scroll to the respective text.