
Natural Resources
Conservation Service
Ecological site R080AY097OK
Saline Bottomland
Last updated: 9/19/2023
Accessed: 02/07/2026
General information
Provisional. A provisional ecological site description has undergone quality control and quality assurance review. It contains a working state and transition model and enough information to identify the ecological site.
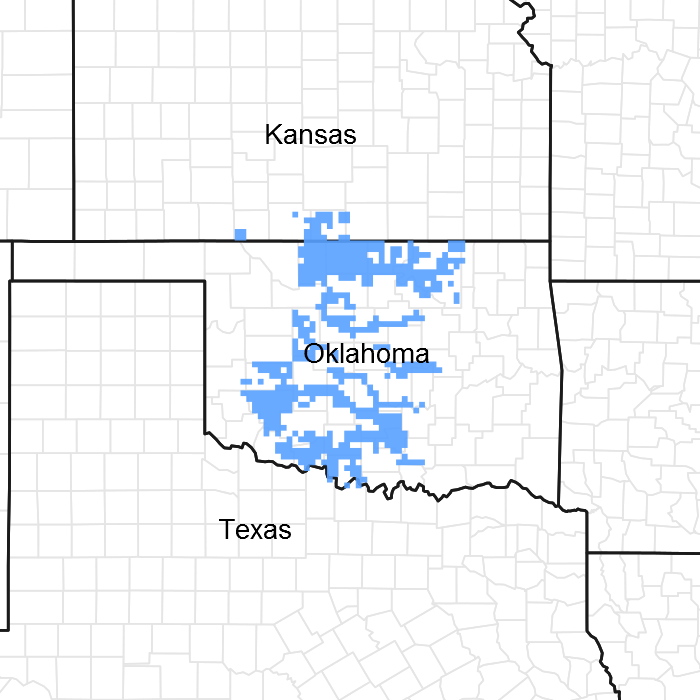
Figure 1. Mapped extent
Areas shown in blue indicate the maximum mapped extent of this ecological site. Other ecological sites likely occur within the highlighted areas. It is also possible for this ecological site to occur outside of highlighted areas if detailed soil survey has not been completed or recently updated.
MLRA notes
Major Land Resource Area (MLRA): 080A–Central Rolling Red Prairies
MLRA 80A is characterized by dark red Permian rocks that are exposed on gently sloping plains. These plains are dissected by rivers that flow from northwest to southeast. Major rivers of this MLRA include the Chikaskia and Bluff rivers in KS, the Salt Fork, Cimarron, North and South Canadian, Washita, Cache, Red River in OK, and branches of the Wichita River in TX. Soils are generally well drained, loamy or clayey deposits overlying Permian sandstones or shales.
Classification relationships
This ecological site is correlated to soil components at the Major Land Resource Area (MLRA) level which is further described in USDA Ag Handbook 296.
Ecological site concept
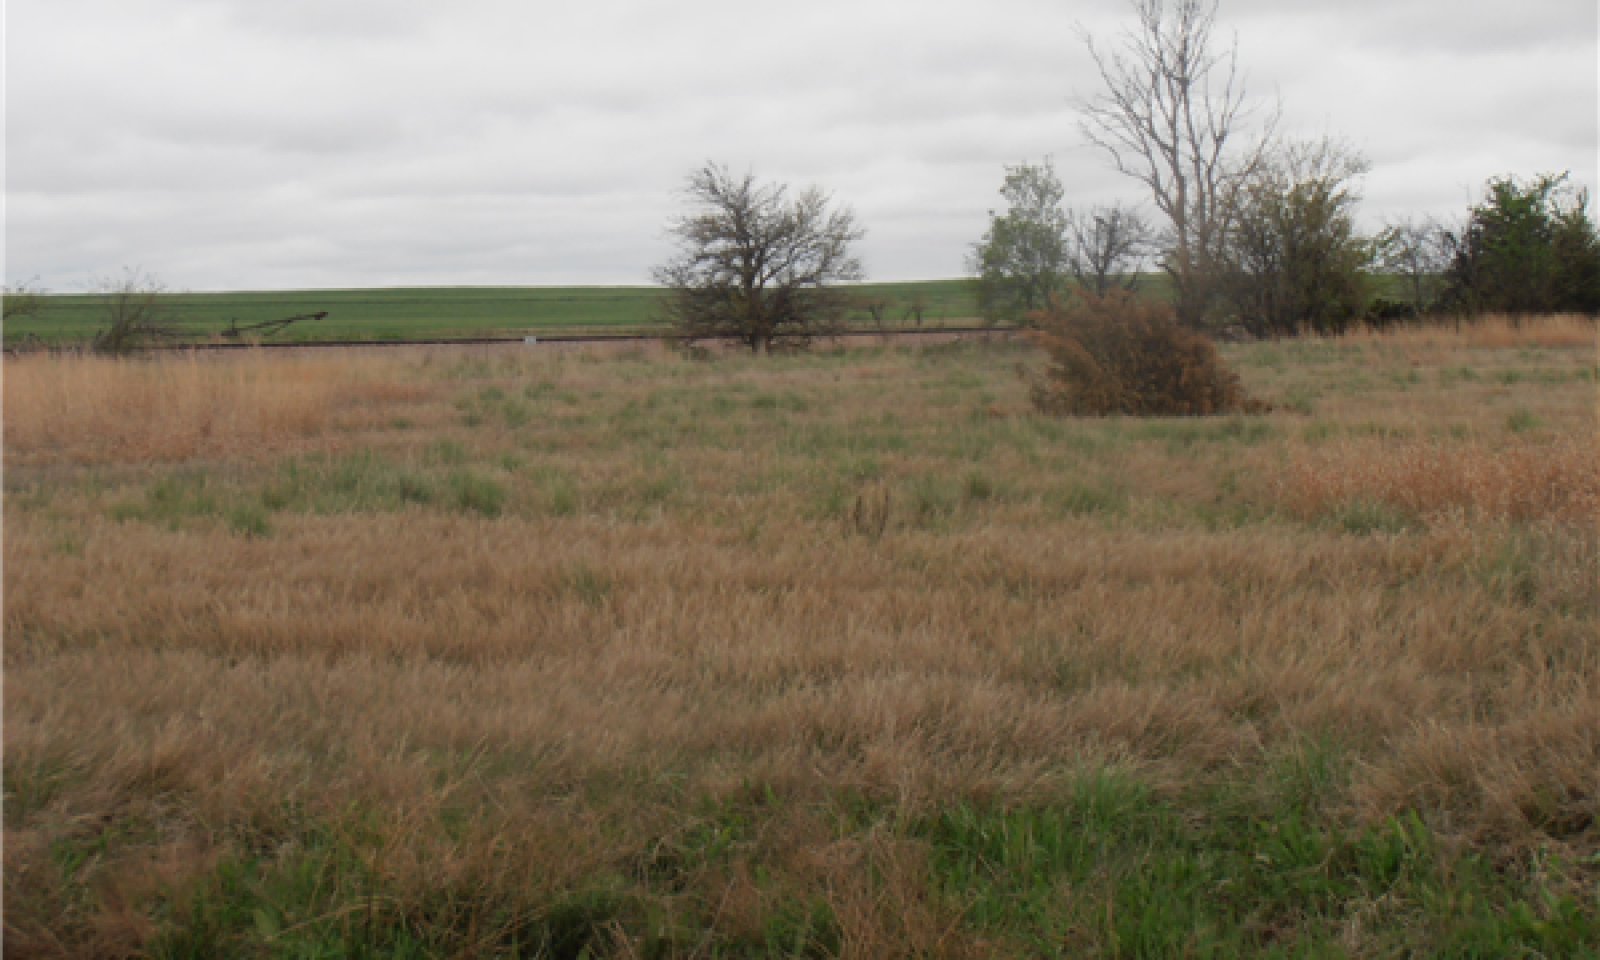
These sites occur as saline areas along floodplains of streams and tributaries and are often mapped in complexes with other soils/ecological sites. The vegetation may vary depending on the local sodium content and overall salinity of the specific site. Occasionally, these sites may be dominated by Alkali Sacaton Sporobolus airoides, Inland saltgrass Distichlis spicata, or other salt tolerant species. Historically, the reference plant community was dominated by primarily herbaceous plant due to the frequency of fires on the prairie.
Associated sites
| R080AY050OK |
Loamy Bottomland Similar landscape. Loamy soils. No salinity. |
|---|---|
| R080AY045OK |
Clay Bottomland Similar Landscape. Clay Soils. No Salinity. |
Similar sites
| R080AY091OK |
Slickspot Sodic areas on uplands. |
|---|
Table 1. Dominant plant species
| Tree |
Not specified |
|---|---|
| Shrub |
Not specified |
| Herbaceous |
(1) Sporobolus airoides |
Physiographic features
These sites occur on floodplains. Slopes range from 0 to 3 percent.
Table 2. Representative physiographic features
| Landforms |
(1)
Alluvial plain
> Flood plain
|
|---|---|
| Runoff class | Negligible to low |
| Flooding duration | Very brief (4 to 48 hours) to brief (2 to 7 days) |
| Flooding frequency | Rare to frequent |
| Elevation | 500 – 1,500 ft |
| Slope | 3% |
| Water table depth | 36 in |
| Aspect | Aspect is not a significant factor |
Table 3. Representative physiographic features (actual ranges)
| Runoff class | Negligible to high |
|---|---|
| Flooding duration | Not specified |
| Flooding frequency | Not specified |
| Elevation | Not specified |
| Slope | Not specified |
| Water table depth | Not specified |
Climatic features
The climate is characterized by moist, cool, springs; hot, often dry summers; mild autumns; and mild to cold winters. Variation in timing and amounts of precipition from year to year is quite common. Drought cycles range from three to five years duration with occasionally longer periods occurring at unpredictable intervals. Above normal rainfall cycles are usually just as random, but shorter in duration.
Table 4. Representative climatic features
| Frost-free period (characteristic range) | 173-187 days |
|---|---|
| Freeze-free period (characteristic range) | 194-203 days |
| Precipitation total (characteristic range) | 33-37 in |
| Frost-free period (actual range) | 157-192 days |
| Freeze-free period (actual range) | 191-208 days |
| Precipitation total (actual range) | 32-39 in |
| Frost-free period (average) | 179 days |
| Freeze-free period (average) | 199 days |
| Precipitation total (average) | 35 in |
Figure 2. Monthly precipitation range
Figure 3. Monthly minimum temperature range
Figure 4. Monthly maximum temperature range
Figure 5. Monthly average minimum and maximum temperature
Figure 6. Annual precipitation pattern
Figure 7. Annual average temperature pattern
Climate stations used
-
(1) WATONGA [USC00349364], Watonga, OK
-
(2) PAULS VALLEY 4 WSW [USC00346926], Pauls Valley, OK
-
(3) ANTHONY [USW00013980], Anthony, KS
-
(4) STILLWATER 5 WNW [USW00053927], Stillwater, OK
-
(5) OKEENE [USC00346629], Okeene, OK
-
(6) WALTERS [USC00349278], Walters, OK
-
(7) KINGFISHER [USC00344861], Kingfisher, OK
-
(8) JEFFERSON [USC00344573], Medford, OK
-
(9) CHEROKEE 4W [USC00341724], Cherokee, OK
Influencing water features
The site occurs on floodplains and is subject to periodic flooding, as well as run off from adjacent upland sites.
Wetland description
NA
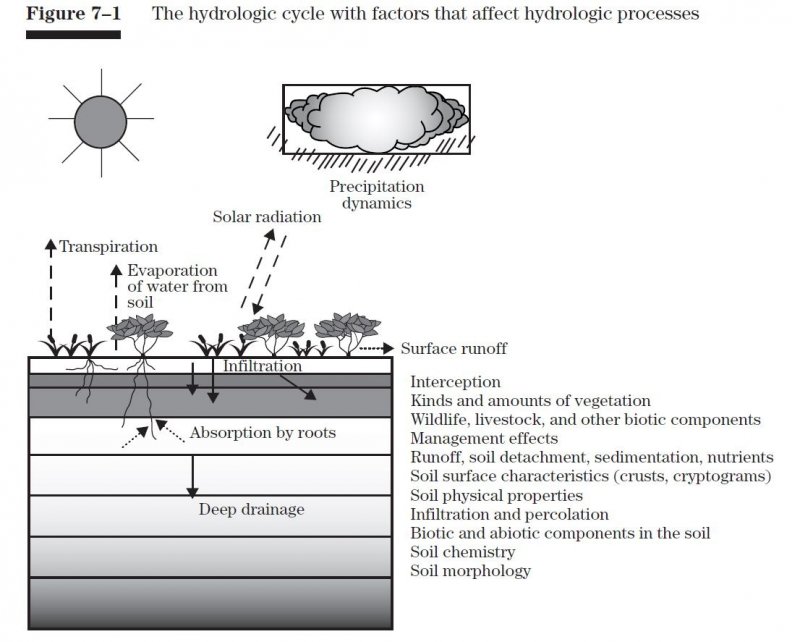
Figure 8.
Soil features
Soils are mapped for each county within the MLRA. Mapunits are representations of the major soil series component(s) and named accordingly. Each Mapunit is spatially represented on a digital soils map as polygons of different shapes and sizes. Within these Mapunits, there are often minor soil series components included. These minor components are soils that occur within a Mapunit polygon but are of small extent (15% or less of the Mapunit area). However, it is difficult to separate these minor soils spatially due to the scale of soil mapping.
Ecological sites are correlated at the component level of the soil survey. Therefore, a single Mapunit may contain multiple Ecological Sites just as it may contain multiple soil components. This is important to understand when investigating soils and Ecological Sites. A soil survey Mapunit may be correlated to a single Ecological Site based on the major component; however, there may be inclusional areas of additional Ecological Sites which are correlated to the minor components of that particular soil Mapunit.
Representative soil components for this site include:
Drummond and Oscar
These are Natric loamy and clayey soils on floodplains with higher salinity than surrounding soils.
Table 5. Representative soil features
| Parent material |
(1)
Alluvium
–
sandstone and shale
|
|---|---|
| Surface texture |
(1) Clay (2) Silt loam (3) Loam |
| Drainage class | Somewhat poorly drained to moderately well drained |
| Permeability class | Very slow to slow |
| Soil depth | 60 – 80 in |
| Surface fragment cover <=3" | 1% |
| Surface fragment cover >3" | 1% |
| Available water capacity (0-40in) |
4 – 8 in |
| Electrical conductivity (0-40in) |
2 – 10 mmhos/cm |
| Sodium adsorption ratio (0-40in) |
5 – 38 |
| Soil reaction (1:1 water) (0-40in) |
7 – 8 |
| Subsurface fragment volume <=3" (Depth not specified) |
1% |
Ecological dynamics
Vegetation communities are highly variable on this site because of irregular relief and resulting differeces in salt content between the higher and lower areas. Reference vegetation consists of various tallgrasses, midgrasses, shortgrasses, forbs, and very few, if any, trees. Vegetation included switchgrass, alkali sacaton, inland saltgrass, western wheatgrass, vine mesquite, and several other salt tolerant species. Inland saltgrass, whorled dropseed, tall dropseed and buffalograss will become more prominent in disturbance scenarios such as prolonged drougth or overgrazing. Most areas are rangeland. If cultivated, the site is used mainly for alfalfa, grain sorghum, soybeans, small grains, and tame pasture.
STATE AND TRANSITIONAL PATHWAYS (DIAGRAM):
The following diagram suggests some pathways that the vegetation on this site might take. There may be other states not shown on the diagram. This information is intended to show what might happen in a given set of circumstances; it does not mean that this would happen the same way in every instance. Local professional guidance should always be sought before pursuing a treatment scenario.
As a site changes in the structure and makeup of the plant community, the changes may be due to management, or to natural occurrences, or both. At some point in time, thresholds may be crossed. This means that once plant community changes have progressed to a certain point, the balance of the community has been altered to the extent that a return to the former state is not possible, that is, not possible unless some form of outside energy is applied to make it happen. These changes take place on all ecological sites, but some sites support communities that are more resistant to change. Also, some sites are more resilient, that is, they tend to heal or restore themselves more easily. Changes in management practices alone, such as prescribed grazing, will not be sufficient to restore former plant communities. An example of an outside energy input might be the implementation of prescribed chemical brush management to decrease the amount of woody shrubs and increase the amount of grasses and forbs. This shift in plant community balance could not be brought about with prescribed grazing alone. The amount of energy required to bring about a change in the plant community balance may vary a great deal depending on the present plant community state and the desired community state.
State and transition model
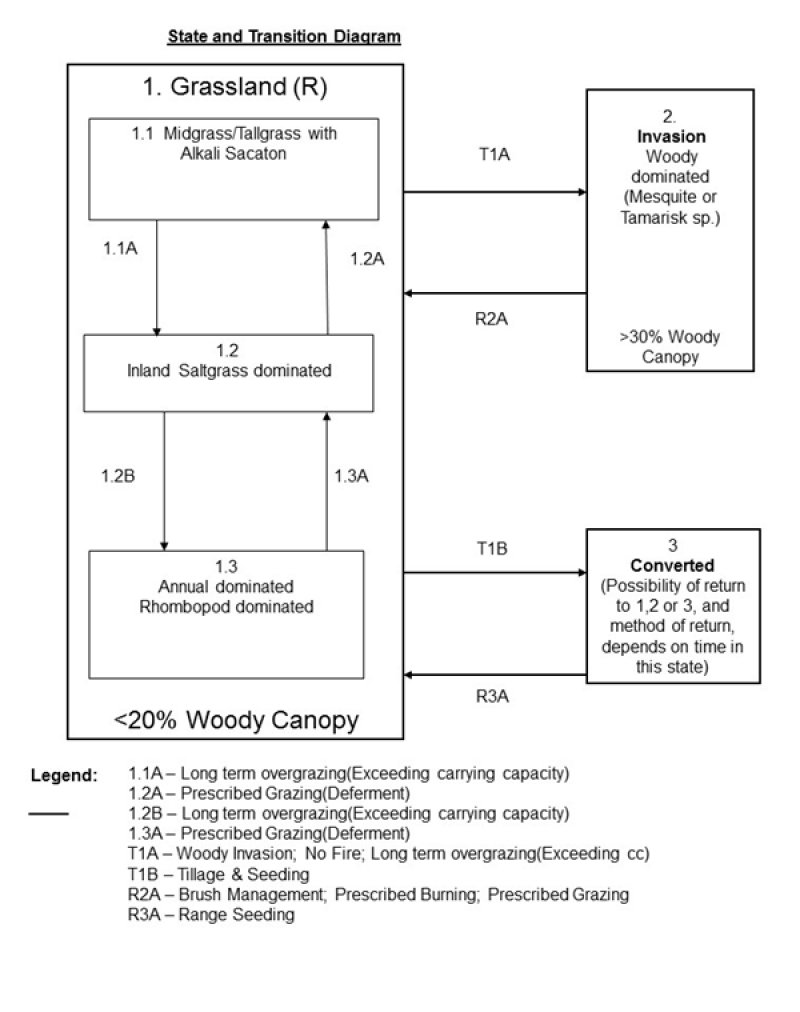
Figure 9. R080AY097OK
More interactive model formats are also available.
View Interactive Models
More interactive model formats are also available.
View Interactive Models
Click on state and transition labels to scroll to the respective text
Ecosystem states
State 1 submodel, plant communities
State 1
Grassland
This is the reference or diagnostic community for the site. The description is based on early range site descriptions, clipping data, professional consensus of experienced range specialists, and analysis of field work.
Dominant plant species
-
alkali sacaton (Sporobolus airoides), grass
-
switchgrass (Panicum virgatum), grass
Community 1.1
Midgrass/Tallgrass

Figure 10. Drummond soils. Garfield County OK
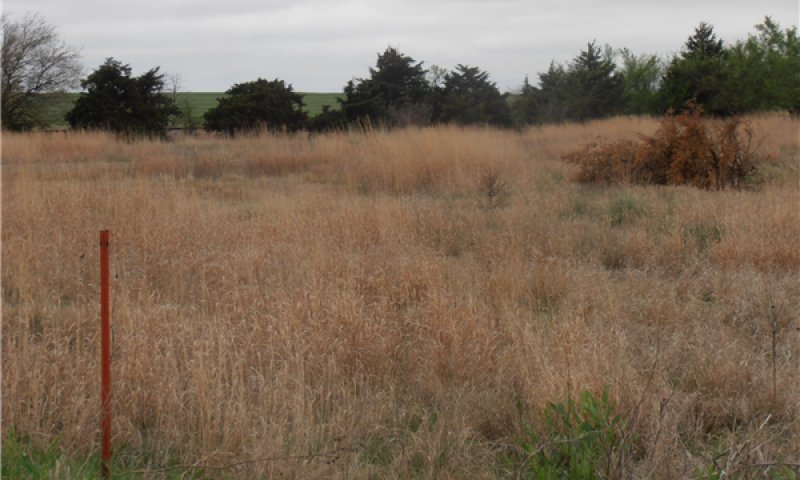
Figure 11. Drummond soils. Garfield County OK
The Reference Community of this site is open midgrass/tallgrass bottomland with a heavy presence of salt tolerant alkali sacaton, depending on salinity. Other important grasses are inland saltgrass, switchgrass, meadow dropseed, whorled dropseed, eastern gamagrass, western wheatgrass, and white tridens. This site also supports a variety of forbs including narrowleaf rhombopod, catclaw sensitivebrier, yellow neptunia, dotted gayfeather, ironweed, curleycup gumweed, curley dock, seacoast sumpweed, western ragweed and others. Shrub and woody plants are honey mesquite, American elm, black willow, willow baccharis and prickly pear. This plant community evolved through the collective influence of extremes of soil salinity, temperature, rain, wind, drought, fire and seasonal migration and herbivory of bison. Annual production is estimated from 2500 to 6000 pounds per acre. Long-term overgrazing usually decreases grasses such as alkali sacaton, eastern gamagrass, switchgrass, western wheatgrass and palatable forbs. Inland saltgrass, honey mesquite, western ragweed, annual grasses, perennial grasses, forbs and woody plants will gradually increase. The rate of vegetation flux on this site is dependent upon management practices and climate. Range management that includes prescribed grazing, prescribed burning, fencing, water development, salt placement, mineral placement, brush control and weed control can restore and maintain this plant community. The production data given herein is based upon years of personal field observations and clipping data. Sometimes, clipping data may be limited, but it is the intent of the authors to give their best account of the vegetative makeup and production of the ecological site. The groupings of plant species is intended to give a general overview of production for particular groups of plants. However, because of ecological site dynamics, upon inspection, a particular species or group of species may exceed or fall below the production figures given. The production of a group has been divided equally amoung the member species. This is done to show the usual relativity of a plant to all other plants within the community. The authors also recognize that, occasionally, particular species may not be present in the plant community and not warrant enough ecological function change to change the reference community.
Figure 12. Annual production by plant type (representative values) or group (midpoint values)
Community 1.2
Inland Saltgrass
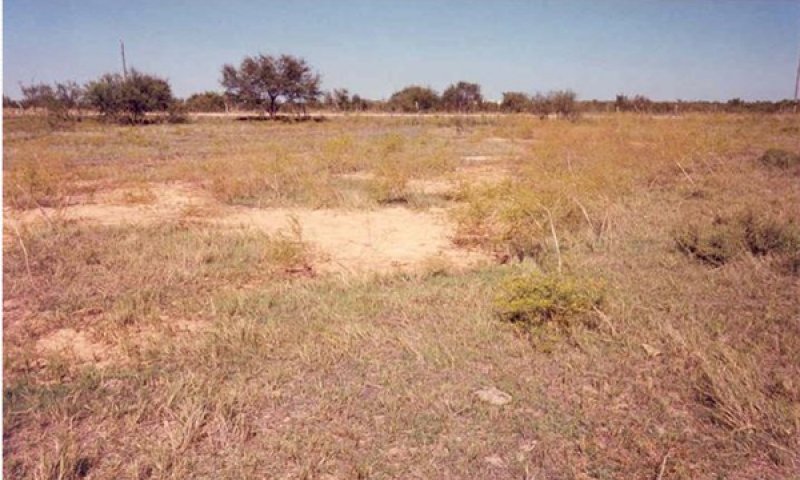
Figure 13. Community Phase 1.2 (old reference photo)
This site is dominated by inland saltgrass. Inland saltgrass can comprise 50 to 75% of the total annual production. Additional small percentages of other perennial grasses such as alkali sacaton, whorled dropseed, meadow dropseed and white tridens can also be present. Continuous heavy grazing contributes to the dominance of inland saltgrass. Applying prescribed grazing and prescribed burning will usually shift the competitive balances and allow switchgrass, alkali sacaton and other more palatable grasses and forbs to increase.
Community 1.3
Annuals
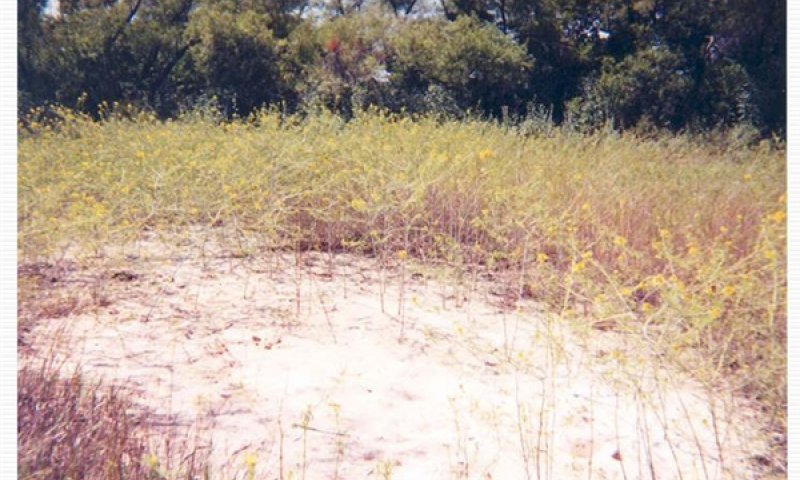
Figure 14. Community Phase 1.3 (old reference photo)
The plant community is dominated by annual species that may include narrowleaf rhombopod, annual threeawn, or others. Some perennial plants persist in states of low vigor.
Pathway 1.1A
Community 1.1 to 1.2


If abusive grazing practices persist, the community may shift towards 1.2 as the less palatable species are able to dominate.
Pathway 1.2A
Community 1.2 to 1.1


Community Phase Pathway 1.2A With the implementation of a prescribed grazing system that includes growing season deferment, the community may shift towards the reference community 1.1.
Pathway 1.2B
Community 1.2 to 1.3


If abusive grazing practices persist, the community may shift towards 1.3 as the less palatable species are able to dominate.
Pathway 1.3A
Community 1.3 to 1.2


With the implementation of a prescribed grazing system that includes growing season deferment for multiple years, the community may shift towards the community 1.2.
State 2
Invasion
This state is the result of invasion by woody species. Most likely tamarisk or eastern redcedar. Theses woody species now dominate ecological processes including hydrologic cycle and energy flow.
Dominant plant species
-
eastern redcedar (Juniperus virginiana), tree
-
alkali sacaton (Sporobolus airoides), grass
State 3
Converted
In many areas, these sites have been cultivated for farming. Although the nature of the soils can prohibit crop growth, they are often farmed with the adjacent soils in the field. Other areas have been planted to introduced pasture species. Contact the survey publications or extension agent for yield data.
Dominant plant species
-
wheat (Triticum), grass
Transition T1A
State 1 to 2
Without fire or brush management. The site will be encroached by woody species that will begin to dominate ecological processes.
Transition T1B
State 1 to 3
Many sites were cultivated for the production of crops. This soil disturbance will cause a transition to the converted state.
Restoration pathway R2A
State 2 to 1
With the implementation of prescribed fire or alternative brush management, the site may be restored to the reference state. Careful grazing management will be necessary to ensure the recovery of the herbaceous species.
Restoration pathway R3A
State 3 to 1
This restoration pathways is not certain. Possibility of returning to the reference state depends on many factors including length of time in cultivation, remaining soil resources, restoration methods, and others. Contact local NRCS office for site specific recommendations.
Additional community tables
Table 6. Community 1.1 plant community composition
| Group | Common name | Symbol | Scientific name | Annual production (lb/acre) | Foliar cover (%) | |
|---|---|---|---|---|---|---|
|
Grass/Grasslike
|
||||||
| 1 | – | |||||
| switchgrass | PAVI2 | Panicum virgatum | – | – | ||
| alkali sacaton | SPAI | Sporobolus airoides | – | – | ||
| western wheatgrass | PASM | Pascopyrum smithii | – | – | ||
| vine mesquite | PAOB | Panicum obtusum | – | – | ||
| dropseed | SPORO | Sporobolus | – | – | ||
| buffalograss | BODA2 | Bouteloua dactyloides | – | – | ||
Interpretations
Animal community
Numerous animal and bird species utilize this site as habitat. Small mammals, song birds, predators, along with traditional game species such as turkey, bobwhite quail, whitetail deer, mule deer, and others frequent this site. The combination of grasses, forbs, trees and woody shrubs that occur in the presumed historic plant community provide suitable habitat for all the above species, at least at some time during the year. Surface water, in the form of ponds, springs, and flowing streams provide water for species that require daily watering. Many different species move in and out of the site. Predators such as coyotes and bobcats may utilize the site for hunting prey and hiding during the day.
Hydrological functions
These sites occur on floodplains and drainageways on deep, alluvial soils. These areas receive run-on water from adjacent upland sites. Run off is usually slow due to the low slopes of the floodplain. The presence of deep rooted tallgrasses can help facilitate percolation of water into the soil profile.
Recreational uses
NA
Wood products
NA
Other products
NA
Other information
NA
Supporting information
Inventory data references
Historic NRCS Range Site Descriptions
Historic Soil Survey Manuscripts
Field Observations
Type locality
| Location 1: Garfield County, OK | |
|---|---|
| General legal description | Garfield County, Oklahoma; three miles northwest of Drummond; 200 feet south and 50 feet east of the northwest corner of sec. 8, T. 21 N., R. 8 W. Latitude 36 degrees, 18 minutes, 57 seconds North; Longitude 98 degrees, 5 minutes, 11 seconds West; NAD 83. |
References
-
Anderson, R.C. 1982. An evolutionary model summarizing the roles of fire, climate, and grazing animals in the origin and maintenance of grasslands. Pages 297–308 in , , and , editors. Grasses and grasslands: systematics and ecology.
Other references
This site was included in an update project during 2013. A vegetative name was added and PE was dropped. Climate data was also updated and the S&T model was formatted. The concepts and vegetative data contained therein was not altered. The entire ESD will be reviewed, updated, and subjected to the QC/QA processes as part of a future project. CW
USDA-NRCS (Formerly Soil Conservation Service) Range Site Descriptions (1960s)
USDA-NRCS (Formerly Soil Conservation Service) Ag Handbook 296 (2006)
Contributors
Dr. Jack Eckroat, Grazing Lands Specialist, NRCS, Oklahoma
Edits by Colin Walden, Soil Survey Office, Stillwater, OK
Approval
Bryan Christensen, 9/19/2023
Acknowledgments
Site Development and Testing Plan
Future work, as described in a Project Plan, to validate the information in this Provisional Ecological Site Description is needed. This will include field activities to collect low, medium and high intensity sampling, soil correlations, and analysis of that data. Annual field reviews should be done by soil scientists and vegetation specialists. A final field review, peer review, quality control, and quality assurance reviews of the ESD will be needed to produce the final document.
Annual reviews of the Project Plan are to be conducted by the Ecological Site Technical Team.
Rangeland health reference sheet
Interpreting Indicators of Rangeland Health is a qualitative assessment protocol used to determine ecosystem condition based on benchmark characteristics described in the Reference Sheet. A suite of 17 (or more) indicators are typically considered in an assessment. The ecological site(s) representative of an assessment location must be known prior to applying the protocol and must be verified based on soils and climate. Current plant community cannot be used to identify the ecological site.
| Author(s)/participant(s) | Mark Moseley, Kay Anderson, Jack Eckroat, Harry Fritzler, Steve Glasgow |
|---|---|
| Contact for lead author | |
| Date | 04/01/2005 |
| Approved by | Bryan Christensen |
| Approval date | |
| Composition (Indicators 10 and 12) based on | Annual Production |
Indicators
-
Number and extent of rills:
There are few, if any, rills and there is no active headcutting and sides are covered with vegetation. -
Presence of water flow patterns:
There is little, if any, evidence of soil deposition or erosion. Water generally flows evenly over the entire landscape. -
Number and height of erosional pedestals or terracettes:
There should not be any evidence of erosional pedestals or terracettes on this site. -
Bare ground from Ecological Site Description or other studies (rock, litter, lichen, moss, plant canopy are not bare ground):
There is ~2% bare ground on this site. Bare areas are small and not connected. In the more saline portions, bare ground may be as much as 10%. -
Number of gullies and erosion associated with gullies:
None, drainages are represented as natural stable channels; vegetation is common with no signs of erosion. -
Extent of wind scoured, blowouts and/or depositional areas:
None. -
Amount of litter movement (describe size and distance expected to travel):
Uniform distribution of litter. Litter rarely moves >6 inches on flatter slopes and may be as much as doubled on steeper slopes, then only during high intensity storms. -
Soil surface (top few mm) resistance to erosion (stability values are averages - most sites will show a range of values):
Surface soil is stabilized where vegetation occurs (Stability Score 5 – 6). Surface soil is moderately stabilized in saline areas (Stability Score 4 or greater). Soils in saline areas typically have a crusty surface. Stability scores based on a minimum of 6 samples tested. -
Soil surface structure and SOM content (include type of structure and A-horizon color and thickness):
A1 horizon: 0 to 8 inches; grayish brown loam, very dark grayish brown, weak fine granular structure. Btn horizon: 8 to 22 inches; brown clay loam, dark brown, weak medium columnar structure. -
Effect of community phase composition (relative proportion of different functional groups) and spatial distribution on infiltration and runoff:
Infiltration and runoff are not affected by any changes in plant community composition and distribution. (Tallgrass dominated). Any changes in infiltration and runoff can be attributed to other factors (e.g. compaction). -
Presence and thickness of compaction layer (usually none; describe soil profile features which may be mistaken for compaction on this site):
There is usually no compaction layer. Clayey soil layers may be mistaken for a compaction layer. -
Functional/Structural Groups (list in order of descending dominance by above-ground annual-production or live foliar cover using symbols: >>, >, = to indicate much greater than, greater than, and equal to):
Dominant:
Midgrasses, TallgrassesSub-dominant:
Cool-Season Perennial Grasses, Forbs, ShortgrassesOther:
Shrubs, Trees, AnnualsAdditional:
-
Amount of plant mortality and decadence (include which functional groups are expected to show mortality or decadence):
There is some plant mortality and decadence on the perennial grasses, especially in the absence of fire and herbivory, but usually <5%. -
Average percent litter cover (%) and depth ( in):
Litter should cover 70% of the area between plants with accumulations of ~ 1 inch deep. -
Expected annual annual-production (this is TOTAL above-ground annual-production, not just forage annual-production):
Normal production is 2,500 - 6,000 pounds per year. -
Potential invasive (including noxious) species (native and non-native). List species which BOTH characterize degraded states and have the potential to become a dominant or co-dominant species on the ecological site if their future establishment and growth is not actively controlled by management interventions. Species that become dominant for only one to several years (e.g., short-term response to drought or wildfire) are not invasive plants. Note that unlike other indicators, we are describing what is NOT expected in the reference state for the ecological site:
No invasive species. Invasives might include: eastern redcedar, salt cedar, Russian olive, annuals and non-natives. -
Perennial plant reproductive capability:
All plants capable of reproducing at least every 3 years. Seed stalks, stalk length, and seedheads are numerous and what would be expected. Overall health of plants is what would be expected.
Print Options
Sections
Font
Other
The Ecosystem Dynamics Interpretive Tool is an information system framework developed by the USDA-ARS Jornada Experimental Range, USDA Natural Resources Conservation Service, and New Mexico State University.
Click on box and path labels to scroll to the respective text.