
Natural Resources
Conservation Service
Ecological site R084BY174TX
Sandy Loam 29-33" PZ
Last updated: 9/21/2023
Accessed: 02/07/2026
General information
Provisional. A provisional ecological site description has undergone quality control and quality assurance review. It contains a working state and transition model and enough information to identify the ecological site.
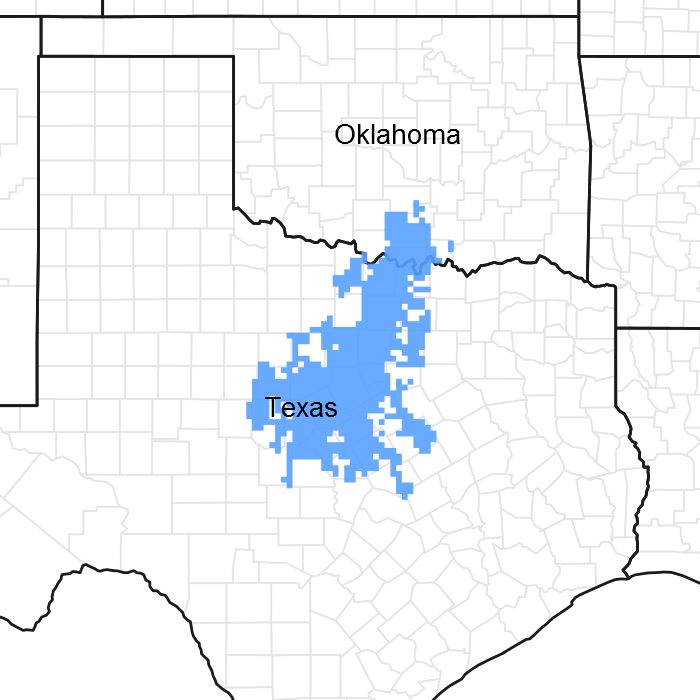
Figure 1. Mapped extent
Areas shown in blue indicate the maximum mapped extent of this ecological site. Other ecological sites likely occur within the highlighted areas. It is also possible for this ecological site to occur outside of highlighted areas if detailed soil survey has not been completed or recently updated.
MLRA notes
Major Land Resource Area (MLRA): 084B–West Cross Timbers
MLRA 84B lies primarily in northern Texas with about 25 percent extending into southern Oklahoma. It is characterized by nearly level to strongly sloping, dissected plains with narrow valleys that deepen eastward. Soils are generally deep and formed in sediments of Cretaceous age. It is believed that the Cross Timbers ecosystem is one the least disturbed forest types remaining in the Eastern US. Even so, there are many instances of soil erosion still evident from past attempts at cultivation.
Classification relationships
This ecological site is correlated to soil components at the Major Land Resource Area (MLRA) level which is further described in USDA Ag Handbook 296.
Ecological site concept
This site has a sandy loam or loamy surface layer and loamy or clayey underlying layer and is moderately well drained to well-drained. The slopes range from 0.5 to 7 percent but are dominantly 3 to 5 percent. The reference plant community for the site is a hardwood savannah with a tall and midgrass understory with forbs. This “reference” plant community is disturbance driven and requires periodic fire to maintain the savannah community. When fire is removed from the system, the site is at risk of encroachment of woody species and buildup of leaf litter, altering the plant community and driving it towards a woodland system with little understory production.
Associated sites
| R084BY170TX |
Loamy Bottomland 29-33" PZ Alluvial soils on floodplains. Lower position on landscape. Higher Production |
|---|---|
| R084BY171TX |
Loamy Sand 29-33" PZ Loamy sands on uplands. Lower Production. |
| R084BY168TX |
Claypan 29-33" PZ Dense clay subsoils. |
Similar sites
| R084BY171TX |
Loamy Sand 29-33" PZ Loamy sands on uplands. Lower Production. |
|---|---|
| R084BY168TX |
Claypan 29-33" PZ Dense clay subsoils over shale. |
Table 1. Dominant plant species
| Tree |
(1) Quercus stellata |
|---|---|
| Shrub |
(1) Smilax |
| Herbaceous |
(1) Sorghastrum nutans |
Physiographic features
This site occurs on treads and risers of stream terraces and paleoterraces, as well as base slopes, side slopes, and interfluves of low ridges and hillslopes in the West Cross Timbers. Slopes are typically less than 12 percent.
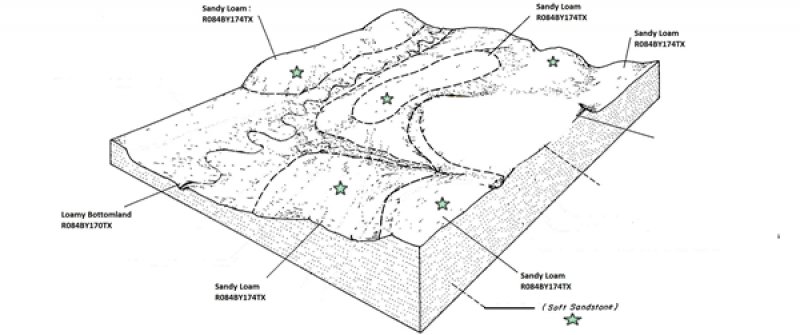
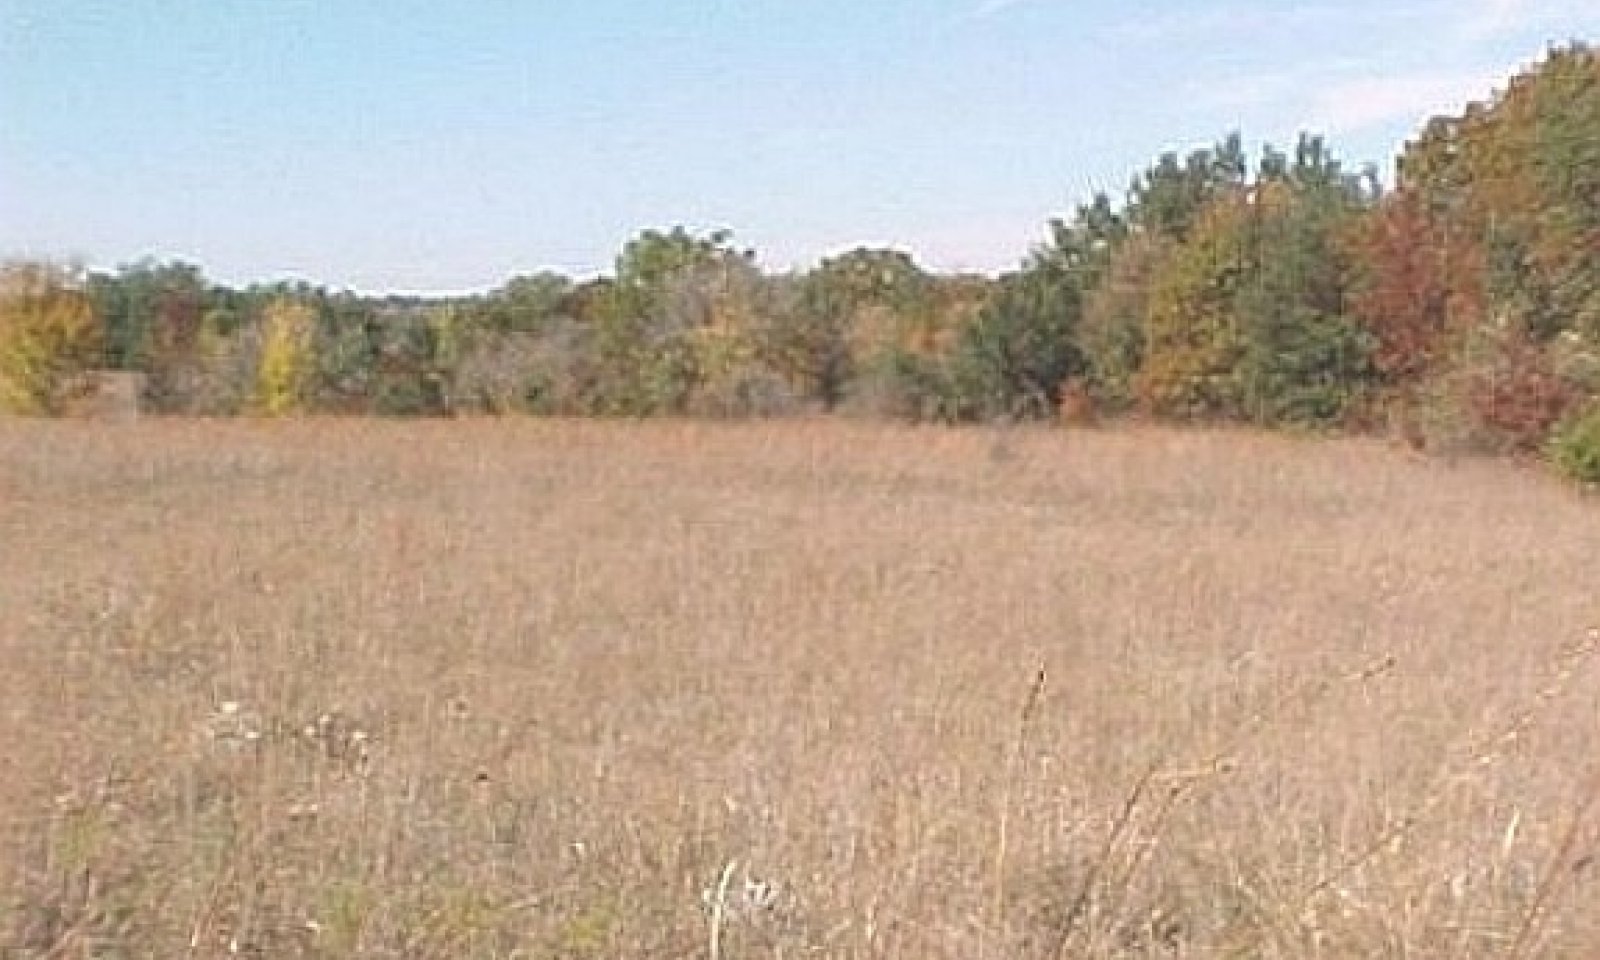
Figure 2. R084BY174TX Sandy Loam
Table 2. Representative physiographic features
| Landforms |
(1)
Alluvial plain
> Stream terrace
(2) Hills > Hillslope (3) Hills > Ridge (4) Alluvial plain remnant > Paleoterrace |
|---|---|
| Runoff class | Low to medium |
| Elevation | 600 – 2,100 ft |
| Slope | 12% |
| Water table depth | 20 in |
| Aspect | Aspect is not a significant factor |
Table 3. Representative physiographic features (actual ranges)
| Runoff class | Negligible to high |
|---|---|
| Elevation | Not specified |
| Slope | Not specified |
| Water table depth | Not specified |
Climatic features
The climate is subtropical. Precipitation varies from an average of 33 inches in the eastern part of the Cross Timbers to 29 inches in the western part. Winters are dry and summers are hot and humid. Tropical maritime air masses control the weather during the spring, summer and fall. Large variations in temperature sometimes accompany polar air masses in winter.
Table 4. Representative climatic features
| Frost-free period (average) | 211 days |
|---|---|
| Freeze-free period (average) | 234 days |
| Precipitation total (average) | 37 in |
Figure 3. Monthly precipitation range
Figure 4. Monthly average minimum and maximum temperature
Figure 5. Annual precipitation pattern
Figure 6. Annual average temperature pattern
Climate stations used
-
(1) BRIDGEPORT [USC00411063], Bridgeport, TX
-
(2) MARIETTA 5SW [USC00345563], Marietta, OK
-
(3) BOWIE [USC00410984], Bowie, TX
-
(4) DECATUR [USC00412334], Decatur, TX
-
(5) EAGLE MTN LAKE [USC00412677], Fort Worth, TX
-
(6) EASTLAND [USC00412715], Eastland, TX
-
(7) GLEN ROSE 2 W [USC00413591], Glen Rose, TX
-
(8) STEPHENVILLE [USW00003969], Stephenville, TX
-
(9) HEALDTON 3 E [USC00344001], Wilson, OK
-
(10) MADILL [USC00345468], Madill, OK
-
(11) RISING STAR 1S [USC00417633], Rising Star, TX
-
(12) PROCTOR RSVR [USC00417300], Comanche, TX
-
(13) WEATHERFORD [USC00419532], Weatherford, TX
-
(14) MINERAL WELLS AP [USW00093985], Millsap, TX
Influencing water features
These sites may receive some runoff from adjacent areas and also shed water to areas lower on the landscape. The presence of deep rooted tallgrasses can help facilitate infiltration of water into the soil profile. These sites are not associated with wetlands.
Wetland description
NA
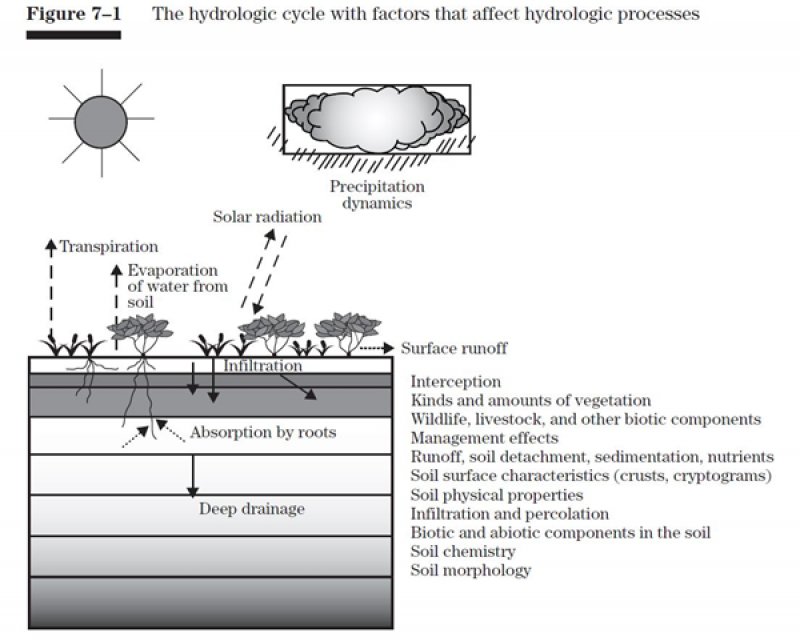
Figure 7.
Soil features
Soils are mapped for each county within the MLRA. Mapunits are representations of the major soil series component(s) and named accordingly. Each Mapunit is spatially represented on a digital soils map as polygons of different shapes and sizes. Within these Mapunits, there are often minor soil series components included. These minor components are soils that occur within a Mapunit polygon but are of small extent (15% or less of the Mapunit area). However, it is difficult to separate these minor soils spatially due to the scale of soil mapping.
Ecological sites are correlated at the component level of the soil survey. Therefore, a single Mapunit may contain multiple Ecological Sites just as it may contain multiple soil components. This is important to understand when investigating soils and Ecological Sites. A soil survey Mapunit may be correlated to a single Ecological Site based on the major component; however, there may be inclusional areas of additional Ecological Sites which are correlated to the minor components of that particular soil Mapunit.
Representative soil components for this ecological site include: Bastsil, Bastrop, Cisco, Duffau, Hassee (thick surface phase), May, Minwells, Paluxy, Silawa, and Weatherford
The site is characterized by deep permeable sandy loam soils with good infiltration.
Table 5. Representative soil features
| Parent material |
(1)
Alluvium
–
sandstone and siltstone
(2) Residuum – sandstone and siltstone |
|---|---|
| Surface texture |
(1) Fine sandy loam (2) Very fine sandy loam (3) Sandy clay loam |
| Drainage class | Moderately well drained to well drained |
| Permeability class | Moderately slow to moderately rapid |
| Soil depth | 40 – 72 in |
| Surface fragment cover <=3" | 10% |
| Surface fragment cover >3" | 10% |
| Available water capacity (0-40in) |
6 – 13 in |
| Calcium carbonate equivalent (0-40in) |
10% |
| Electrical conductivity (0-40in) |
2 mmhos/cm |
| Sodium adsorption ratio (0-40in) |
2 |
| Soil reaction (1:1 water) (0-40in) |
5.1 – 8.4 |
| Subsurface fragment volume <=3" (Depth not specified) |
10% |
| Subsurface fragment volume >3" (Depth not specified) |
10% |
Ecological dynamics
The historic aspect of this site is a hardwood savanna with a tall and midgrass understory with forbs. Undoubtedly though, the historic landscape also had some areas that were very thick and difficult for early travels to cross. Historical writings refer to this area as the “Cross Timbers”, because it was so difficult to cross and these areas were extensive.
Historically, this site was inhabited by grassland wildlife species such as bison, elk, white-tailed deer, bear, grassland birds, bob white quail, and small mammals. Also present were predators such as wolf, coyote, and lion.
Fire, set by lightning and Native Americans, along with herbivory were major disturbances that shaped and maintained this community. Fire played a role in the ecology of the site as is true for most of the grasslands of the Great Plains. The main effect of fire on this site was to reduce the less fire tolerant trees and woody shrubs and cactus (Opuntia spp.) and favor the grasses and forbs. Fire would improve nutrient quality of the plants, attract grazers, diversify the plant community and recycle nutrients.
It is perceived that bison would follow the fires which burned about every 3 – 5 years. They would heavily graze post-burn until forage or water was scarce, then move to other burned areas. The interaction of fire and grazing create diversity in this site for a year or two post burn. The site could burn any time of year that fuel was available and there was an ignition source. The heavy grazing impact would remove plant material permitting sunlight to reach the soil surface. This provided opportunity for many short lived forbs and grasses to germinate which diversified the landscape. Grazers would also recycle nutrients to the soil surface through dung. Even though the grazing would have been very heavy, it was of short term and followed by recovery period. The heavily grazed areas, because of healthy root systems and soil litter, would then recover to pre-burn/graze condition in a few years until burned again. Over time, the grasses would increase in dominance with the forbs and diversity decreasing.
Long-term droughts that occur only three to four times in a century will effect some change in historic plant communities. Short-term droughts are common and usually do not have a lasting effect in changing stable plant communities, although production will be affected.
The collective influence of fire, grazing, and weather extremes created a “shifting mosaic” in the site that would in all probability had mature grasses mixed in with low seral stage landscapes. Over time, the low seral stage landscapes would recover until a grazing/burning disturbance would occur again.
Hydrologically, the site contributes runoff to the various draws, creeks, and streams that are common in the MLRA. If the perennial grass cover is maintained in good vigor, then maximum infiltration occurs and runoff is reduced. More water getting into the ground means a healthier, more productive plant community. If infiltration is minimal, then the effect is an artificially shallow soil with plant roots retreating to near the soil surface. More perennial grass cover means less runoff may result but the runoff that does occur is less laden with sediment. Overall watershed protection is enhanced by a healthy grassland community, as is nutrient cycling.
When a brush canopy shades the ground sufficiently it tends to favor cool season annual species. Once a state of brush and cool-season annuals is reached, recovery to a good perennial grass cover is unlikely without major input with brush management and sometimes reseeding.
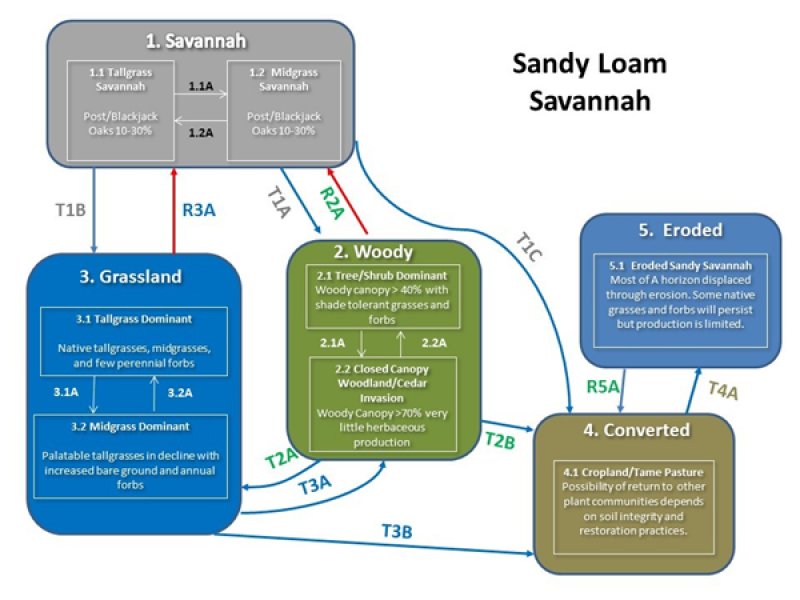
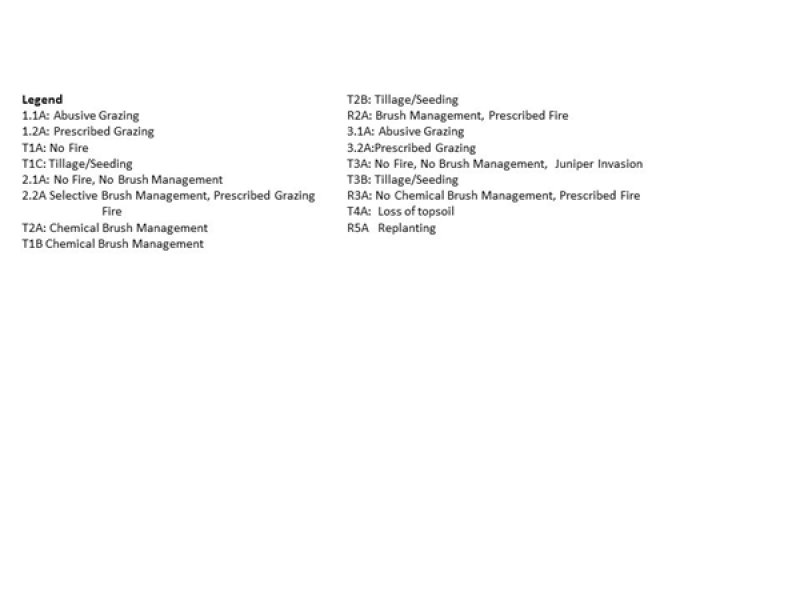
A State and Transition Model for the Sandy Loam Savanna Ecological Site (R084BY174TX) is depicted in Figure 1. Descriptions of each state, transition, plant community, and pathway follow the model. Experts base this model on available experimental research, field observations, professional consensus, and interpretations. It is likely to change as knowledge increases.
Plant communities will differ across the MLRA because of the naturally occurring variability in weather, soils, and aspect. The Reference Plant Community is not necessarily the management goal. Other vegetative states may be desired plant communities as long as the Range Health assessments are in the moderate and above category. The biological processes on this site are complex. Therefore, representative values are presented in a land management context. The species lists are representative and are not botanical descriptions of all species occurring, or potentially occurring, on this site. They are not intended to cover every situation or the full range of conditions, species, and responses for the site.
Both percent species composition by weight and percent canopy cover are described as are other metrics. Most observers find it easier to visualize or estimate percent canopy for woody species (trees and shrubs). Canopy cover can drive the transitions between communities and states because of the influence of shade and interception of rainfall. Species composition by dry weight is used for describing the herbaceous community and the community as a whole. Woody species are included in species composition for the site. Calculating similarity index requires use of species composition by dry weight.
The following diagram suggests some pathways that the vegetation on this site might take. There may be other states not shown on the diagram. This information is intended to show what might happen in a given set of circumstances. It does not mean that this would happen the same way in every instance. Local professional guidance should always be sought before pursuing a treatment scenario.
State and transition model
More interactive model formats are also available.
View Interactive Models
Click on state and transition labels to scroll to the respective text
State 1 submodel, plant communities
State 2 submodel, plant communities
State 3 submodel, plant communities
State 4 submodel, plant communities
State 5 submodel, plant communities
State 1
Savannah State - Reference
The Savanna community is a mixture of trees, shrubs, grasses and forbs. This state fluctuates over time depending upon fire frequency and the severity of grazing.
Dominant plant species
-
post oak (Quercus stellata), tree
-
saw greenbrier (Smilax bona-nox), shrub
-
Indiangrass (Sorghastrum nutans), grass
Community 1.1
Tallgrass/Oak Savannah Community

Figure 8. 1. 1 Tallgrass/Oak Savannah Community
The Tallgrass Savannah plant community is the diagnostic or reference plant community for this site. The community is dominated by warm-season perennial tallgrasses with post oak. The major perennial grass species are well dispersed through the community. Perennial forbs and shrubs are well represented throughout the community. This plant community evolved with a short duration of heavy use by large herbivores followed by long rest periods due to herd migration along with occasional fire. With the removal of fire without some other means of controlling the increase of woody plants the historic community will change to the shrubland transition state. This change will also occur with continuous grazing but the grass community will change faster.
Figure 9. Annual production by plant type (representative values) or group (midpoint values)
Table 6. Annual production by plant type
| Plant type | Low (lb/acre) |
Representative value (lb/acre) |
High (lb/acre) |
|---|---|---|---|
| Grass/Grasslike | 2400 | 3600 | 4800 |
| Forb | 300 | 450 | 600 |
| Tree | 210 | 315 | 420 |
| Shrub/Vine | 90 | 135 | 150 |
| Total | 3000 | 4500 | 5970 |
Figure 10. Plant community growth curve (percent production by month). TX5510, Post Oak Savannah. Post Oak Savannah with native perennial warm season grasses at a historic climax plant community..
| Jan | Feb | Mar | Apr | May | Jun | Jul | Aug | Sep | Oct | Nov | Dec |
|---|---|---|---|---|---|---|---|---|---|---|---|
| J | F | M | A | M | J | J | A | S | O | N | D |
| 2 | 2 | 8 | 10 | 20 | 23 | 5 | 3 | 10 | 10 | 5 | 2 |
Community 1.2
Midgrass Savannah Community
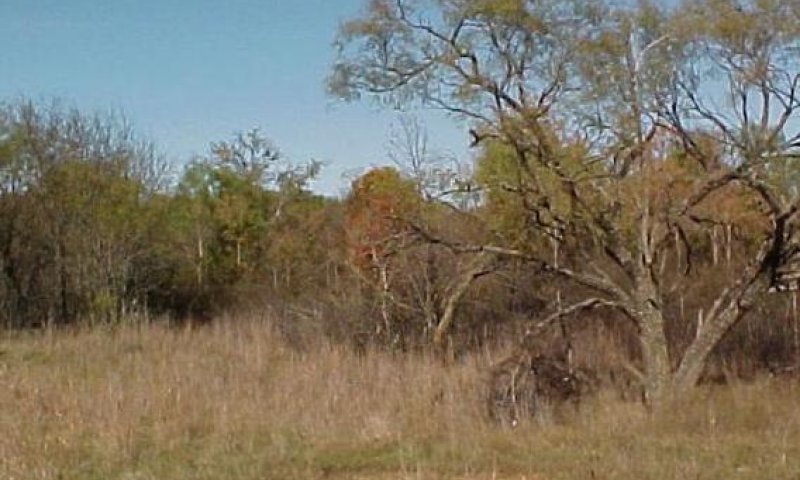
Figure 11. 1.2 Tallgrass/Shrubland Transition Community
Within this community phase, the more palatable tallgrasses and forbs have decreased. They have been replaced by species such as tall dropseed, silver bluestem, and sideoats grama. The less palatable annual forbs, such as broomweed and western ragweed have increased also. Total herbaceous production may remain the same as the reference community, however, the composition has been altered significantly. Often, within this community phase, the structure and amount of fine fuels have been altered. This leads do a decrease in the effectiveness of prescribed fire and increase in woody plants especially in the understory. Increaser brush (mesquite, juniper, yaupon, etc.) may become established. Cedar elm, bumelia, and hackberry may also increase. Cool-season grasses increase as brush canopy increases responding to shading. The plant community consists of about a 20 to 30 percent canopy of mature postoak with an understory canopy of shrubs including young postoak. The herbaceous plant community consists of about 50 to 70 percent grasses with the rest being forbs. Without prescribed burning or brush management, community will continue to shift toward the Woody State (2) once overstory canopy exceeds 30 percent. Once this threshold is crossed, prescribed grazing to build fuel load will be ineffective due to sunlight being captured by the woody plants and not the grasses.
Figure 12. Annual production by plant type (representative values) or group (midpoint values)
Table 7. Annual production by plant type
| Plant type | Low (lb/acre) |
Representative value (lb/acre) |
High (lb/acre) |
|---|---|---|---|
| Grass/Grasslike | 2000 | 3000 | 3600 |
| Tree | 400 | 640 | 830 |
| Shrub/Vine | 300 | 450 | 600 |
| Forb | 300 | 410 | 540 |
| Total | 3000 | 4500 | 5570 |
Figure 13. Plant community growth curve (percent production by month). TX5511, Shrubland Transition. Increasing percentage of shrubs invading site (20-50 % canopy).
| Jan | Feb | Mar | Apr | May | Jun | Jul | Aug | Sep | Oct | Nov | Dec |
|---|---|---|---|---|---|---|---|---|---|---|---|
| J | F | M | A | M | J | J | A | S | O | N | D |
| 0 | 1 | 3 | 10 | 30 | 25 | 8 | 5 | 10 | 5 | 2 | 1 |
Pathway 1.1A
Community 1.1 to 1.2


Abusive grazing practices and removal of fire from the system can initiate a shift from the Tallgrass/Oak Savannah Community to the Midgrass Savannah Community. Fire frequency is the driver for this shift. The fire frequency requires an ignition source such as lightning or by prescribed burning. The intensity of the fire is mainly dependent upon fuel loading. Therefore the main driver for the change is prescribed grazing which has the major impact on available fine fuels and species composition. Historic fire return interval is estimated to be three to five years. Longer than this favors woody species.
Pathway 1.2A
Community 1.2 to 1.1


Prescribed grazing including some type of growing season deferment can provide enough grass fuel for prescribed fire but the recovery may also need an integrated approach of selective brush management and prescribed fire.
Conservation practices
| Brush Management | |
|---|---|
| Prescribed Burning | |
| Prescribed Grazing |
State 2
Woody State
The Woody State is a mixture of trees, shrubs, grasses and forbs. The overstory canopy is between 40 and 70 percent. The understory canopy is about 20 – 30 percent but varies greatly. Very little understory grasses or forbs exist.
Dominant plant species
-
oak (Quercus), tree
-
elm (Ulmus), tree
-
hackberry (Celtis), tree
-
Ashe's juniper (Juniperus ashei), tree
-
saw greenbrier (Smilax bona-nox), shrub
-
little bluestem (Schizachyrium scoparium), grass
-
wildrye (Elymus), grass
-
Texas wintergrass (Nassella leucotricha), grass
Community 2.1
Tree/Shrub Dominant Community
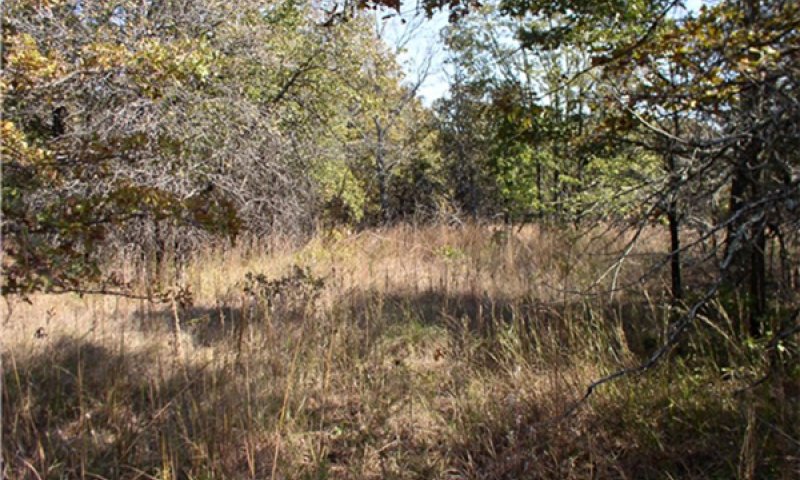
Figure 14. Community 2.1
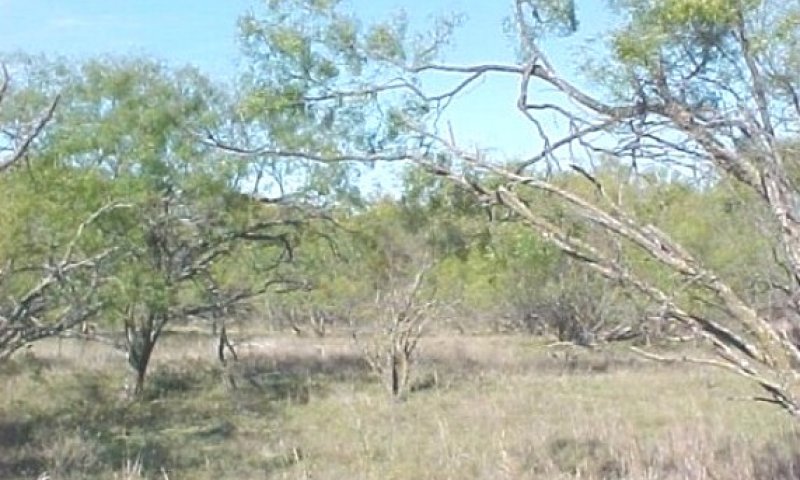
Figure 15. 2.1
The Tree/Shrub Dominant community (2.1) has a canopy of woody plants exceeding 30 to 40 percent. As this community ages, post oak matures and other woody species increase. Warm season perennial tallgrasses such as Indiangrass and little bluestem have all but disappeared. In the early stages of this transition stage little bluestem tends to dominate the grasses. However, as brush canopy continues to increase, cool-season grasses increase accordingly as they are more tolerant to low light conditions than is the little bluestem.
Figure 16. Annual production by plant type (representative values) or group (midpoint values)
Table 8. Annual production by plant type
| Plant type | Low (lb/acre) |
Representative value (lb/acre) |
High (lb/acre) |
|---|---|---|---|
| Tree | 930 | 1305 | 1740 |
| Forb | 895 | 1260 | 1680 |
| Grass/Grasslike | 895 | 1260 | 1680 |
| Shrub/Vine | 480 | 675 | 900 |
| Total | 3200 | 4500 | 6000 |
Figure 17. Plant community growth curve (percent production by month). TX5512, Oak Shrubland Transition. Continued increase of invader species and post oaks maturity. Approximately 50-80 percent canopy cover..
| Jan | Feb | Mar | Apr | May | Jun | Jul | Aug | Sep | Oct | Nov | Dec |
|---|---|---|---|---|---|---|---|---|---|---|---|
| J | F | M | A | M | J | J | A | S | O | N | D |
| 1 | 1 | 3 | 10 | 30 | 30 | 5 | 5 | 8 | 5 | 1 | 1 |
Community 2.2
Closed Canopy Woodland/Cedar Invasion Community
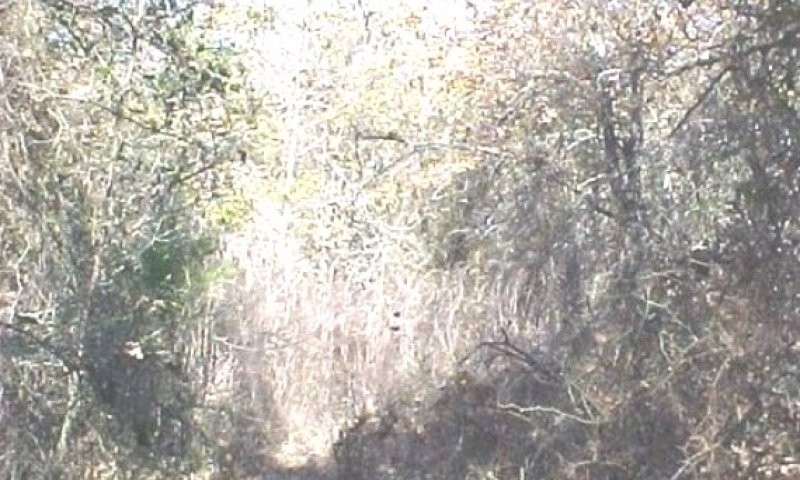
Figure 18. 2.2 Closed Canopy Community
This plant community is a closed overstory, greater than 80 percent canopy, dominated by Woodies . Species present in various amounts are blackjack oak, cedar elm, hackberry, mesquite and juniper. Understory shrubs and sub-shrubs include yaupon, hawthorns, American beautyberry, greenbriar, poison ivy, Virginia creeper and grapes. The herbaceous understory is almost nonexistent. Shade tolerant species such as purpletop tridens, Canada wildrye, and Texas wintergrass occur in small amounts. Small isolated clearings will contain little bluestem, perennial three-awns, and small amounts of other grasses. Abusive grazing by domestic livestock has accelerated the shift. Rest from grazing will not restore the understory grasses as shade is now the driving factor.
Figure 19. Annual production by plant type (representative values) or group (midpoint values)
Table 9. Annual production by plant type
| Plant type | Low (lb/acre) |
Representative value (lb/acre) |
High (lb/acre) |
|---|---|---|---|
| Tree | 1400 | 2100 | 2800 |
| Shrub/Vine | 1120 | 1680 | 2240 |
| Forb | 170 | 250 | 335 |
| Grass/Grasslike | 110 | 170 | 225 |
| Total | 2800 | 4200 | 5600 |
Figure 20. Plant community growth curve (percent production by month). TX5513, Postoak Woodland. Postoak dominated closed overstory with over 80 percent canopy cover..
| Jan | Feb | Mar | Apr | May | Jun | Jul | Aug | Sep | Oct | Nov | Dec |
|---|---|---|---|---|---|---|---|---|---|---|---|
| J | F | M | A | M | J | J | A | S | O | N | D |
| 1 | 1 | 2 | 10 | 50 | 14 | 5 | 5 | 5 | 5 | 1 | 1 |
Pathway 2.1A
Community 2.1 to 2.2


The Closed Canopy Community (2.2) has developed due to the absence of fire or other method of brush suppression.
Pathway 2.2A
Community 2.2 to 2.1


The Tree/Shrub Dominant community (2.1) can be restored by selective brush management to open up the overstory canopy allowing sunlight to reach the warm season grasses. Prescribed burning can do the same thing but will require many years of burning due to the fuel load being mainly leaf litter and not much fine fuel. Leaf litter fires do not burn with as high an intensity as does the grasses.
State 3
Grassland State
This state is mainly a native grassland. The woody species have been removed by broadcast chemical means.
Dominant plant species
-
little bluestem (Schizachyrium scoparium), grass
-
big bluestem (Andropogon gerardii), grass
Community 3.1
Tallgrass Dominant
This community consists of tallgrass species, usually little bluestem, Indiangrass and big bluestem. Other species include sideoats grama and other midgrasses, forbs and legumes. The composition resembles the Savanna (1) State just without the trees and shrubs. Very few woody species occur depending upon the effectiveness of the original brush treatment. The woody species will return in 10 – 15 years unless a maintenance plan integrating fire, chemicals, or strategic grazing with animals such as goats are skillfully used. Prescribed grazing will maintain the tallgrass component to keep fuel for maintenance burning and keep a healthy grass cover. A healthy grass cover will compete with the recovering woody plants for sunlight and moisture resources.
Figure 21. Annual production by plant type (representative values) or group (midpoint values)
Table 10. Annual production by plant type
| Plant type | Low (lb/acre) |
Representative value (lb/acre) |
High (lb/acre) |
|---|---|---|---|
| Grass/Grasslike | 2135 | 3050 | 3900 |
| Forb | 175 | 250 | 325 |
| Shrub/Vine | 75 | 100 | 130 |
| Tree | 75 | 100 | 130 |
| Total | 2460 | 3500 | 4485 |
Community 3.2
Midgrass Dominant
This community consists of some tallgrass species, usually little bluestem. There is an increase of mid grass species such as sideoats grama, buffalograss, blue grama and several other short grasses that are resistant to abusive grazing. There is an increase of annual forbs that increase with the percentage of bare ground. Annual threeawn also increases as do other opportunistic plants. The midgrass community captures less rainfall than does the tallgrass community resulting in less effective rainfall. Very few woody species occur depending upon the effectiveness of the original brush treatment. However, the woody species will return in 10 – 15 years unless a maintenance plan integrating fire, chemicals, or strategic grazing with animals such as goats are skillfully used.
Pathway 3.1A
Community 3.1 to 3.2
The shift to the 3.2 community is driven by abusive grazing which prevents the tallgrass species from restoring their root systems. As the tall grasses are reduced, there is a corresponding increase of mid and short grasses depending upon how long the more palatable plants are used and how severely they are grazed. Droughts will hasten the decline.
Pathway 3.2A
Community 3.2 to 3.1
Prescribed grazing is essential to restoring the more productive tall grasses. If there are about 15 percent of the tall grasses left, recovery can come within a few years utilizing several grazing strategies as long as the stocking rate is correct for the resource. The recovery of the tall grass species also provides greater options for other practices such as prescribed fire to maintain and enhance the plant production and diversity as well as reducing the structure of the woody species.
State 4
Converted Land State
This State consists of either annually tilled cropland or perennial forage plants. The perennial plants can be either native or introduced depending upon management goals.
Dominant plant species
-
Bermudagrass (Cynodon dactylon), grass
Community 4.1
Converted
Conversion of the original communities to cropland occurred from first settlement by European settlers during the middle 1800’s and continued until early 1900’s. Much remains in converted land today. The early cropping with little regard for erosion control lead to severe erosion and loss of soil quality. Much of this tillage has caused irreversible changes in the soil health; at least within a management timeframe. Current farming techniques and knowledge has increased greatly but there is still much damage to overcome. While restoration of this site to some semblance of the tallgrass is possible with seeding, prescribed grazing, and prescribed burning, a complete restoration of the historic plant community in a reasonable time is very unlikely. There are many native species in the historic plant community that are not available in the marketplace but a stand of native grasses can be achieved. Many times retired cropland is planted to introduced grasses or just let go to recover on its own. The seeding of introduced grasses requires supplemental fertility to meet management production goals. If the decision is made to plant introduced species, care should be taken to prevent them from spreading to the land of others if they are aggressive introduced species. Refer to cropland capability classes for production potentials and limitations. Because of the variety of species planted and the variability in soil health, production estimates are difficult to predict. A monitoring system and recordkeeping is a valuable learning tool.
State 5
Eroded
This State is identified by sheet and rill erosion and usually gullies. Compaction layers prevent deep moisture penetration allowing mainly threeawn and other low successional grasses and forbs to persist. Bare ground is obvious.
Dominant plant species
-
sideoats grama (Bouteloua curtipendula), grass
-
threeawn (Aristida), grass
Community 5.1
Eroded Savannah
If the land is “go back”, there will usually be a dominance of threeawn and other low functional plants. If the land has been tilled for any length of time, there will not be any residual seedlings left to reestablish. When topsoil is lost, the land will erode so that it will never recover to its original soil health. The plant community is composed of low order grasses and forbs. Production figures are very hard to estimate as it depends upon the degree of soil damage and the existing composition of plants.
Transition T1A
State 1 to 2
With the removal of fire and without some other means of managing the increase of woody plants, the historic community will transition to the Tree/Shrub Dominant (2) state. Most of the sunlight energy is now absorbed by the overstory of woody plants and is depressing the production of the understory grasses and forbs. This change will occur regardless of grazing but will happen faster with grazing pressure that removes the fine fuel that could be used for prescribed burning.
Transition T1B
State 1 to 3
The driver for this transition is high energy brush management activities using either mechanical removal or broadcast chemical treatment.
Transition T1C
State 1 to 4
The driver for this transition is land clearing and tillage. The land may then be planted to annual crops or introduced forage species.
Restoration pathway R2A
State 2 to 1
The Woody Plant State (2) can be somewhat restored by using a combination of brush management methods such as mechanical, selective herbicides, coupled with prescribed burning, but will require many years. Not always can the Woody State be fully recovered to the Savanna State but a resemblance can be achieved given enough time and favorable weather. The overstory of oak must be opened up in a mosaic pattern, generally following the terrain features for optimal effect. Once the canopy reduction has been done to about a 30 percent overstory, warm season grasses will respond, usually without replanting. With the recovery of the warm season component, a regime of fire can be used to maintain a desired plant community.
Conservation practices
| Brush Management | |
|---|---|
| Prescribed Burning | |
| Range Planting | |
| Prescribed Grazing |
Transition T2A
State 2 to 3
The driver for this transition is high energy brush management activities using either mechanical removal of the woody species or broadcast chemical treatment.
Transition T2B
State 2 to 4
The driver for this transition is land clearing and tillage. The land may then be planted to annual crops or introduced forage species.
Restoration pathway R3A
State 3 to 1
The Grassland State will continue to have woody species recover on the site as they were there historically. Brush management efforts are rarely 100 percent effective. A restoration to the Savanna State (1) is somewhat difficult but with skillful application of fire, grazing, and possibly selective brush management, a reasonable restoration can be achieved. The main driver is to cease applying broadcast chemical controls.
Transition T3A
State 3 to 2
The driver for this transition is to not do any woody plant management. No fire, No brush management.
Transition T3B
State 3 to 4
The driver for this transition is land clearing and tillage. The land may then be planted to annual crops or to perennial forage species.
Transition T4A
State 4 to 5
The driver for this transition excessive soil loss due to a lack of plant cover. Due to the bare ground, significant and visible gullies form and rainfall effectiveness is very low.
Restoration pathway R5A
State 5 to 4
The Eroded Sandy Loam Savanna can be stabilized with replanting of adapted plants and very careful management to foster the stand. Erosion control practices may also be needed to stabilize the soil long enough to get a stand. Soil temperatures will be high until plants become established. The soil surface will be exposed to raindrop impact. The living organisms in the soil needed to restore soil health will be very slow to recover due to the harsh condition in this plant community. This plant community, because of the severe soil damage, will never be restored to the historic plant community but with care and skilled management, a useful cover of perennial plants can be established.
Additional community tables
Table 11. Community 1.1 plant community composition
| Group | Common name | Symbol | Scientific name | Annual production (lb/acre) | Foliar cover (%) | |
|---|---|---|---|---|---|---|
|
Grass/Grasslike
|
||||||
| 1 | Tallgrass | 900–1800 | ||||
| little bluestem | SCSC | Schizachyrium scoparium | 900–1800 | – | ||
| 2 | Tallgrass | 150–300 | ||||
| big bluestem | ANGE | Andropogon gerardii | 150–300 | – | ||
| 3 | Tallgrass | 300–600 | ||||
| Indiangrass | SONU2 | Sorghastrum nutans | 300–600 | – | ||
| 4 | Tallgrass | 150–300 | ||||
| switchgrass | PAVI2 | Panicum virgatum | 150–300 | – | ||
| 5 | Midgrass | 150–300 | ||||
| sideoats grama | BOCU | Bouteloua curtipendula | 150–300 | – | ||
| 6 | Midgrass | 150–300 | ||||
| silver beardgrass | BOLAT | Bothriochloa laguroides ssp. torreyana | 150–300 | – | ||
| 7 | Cool-season grass | 150–300 | ||||
| Scribner's rosette grass | DIOLS | Dichanthelium oligosanthes var. scribnerianum | 150–300 | – | ||
| 8 | Cool-season grasses | 150–300 | ||||
| Canada wildrye | ELCA4 | Elymus canadensis | 0–150 | – | ||
| Virginia wildrye | ELVI3 | Elymus virginicus | 0–150 | – | ||
| Texas wintergrass | NALE3 | Nassella leucotricha | 0–150 | – | ||
| western wheatgrass | PASM | Pascopyrum smithii | 0–150 | – | ||
| Texas bluegrass | POAR | Poa arachnifera | 0–150 | – | ||
| 9 | Mid/Shortgrasses | 150–300 | ||||
| threeawn | ARIST | Aristida | 0–50 | – | ||
| buffalograss | BODA2 | Bouteloua dactyloides | 0–50 | – | ||
| hairy grama | BOHI2 | Bouteloua hirsuta | 0–50 | – | ||
| fall witchgrass | DICO6 | Digitaria cognata | 0–50 | – | ||
| sand lovegrass | ERTR3 | Eragrostis trichodes | 0–50 | – | ||
| crowngrass | PASPA2 | Paspalum | 0–50 | – | ||
| composite dropseed | SPCOC2 | Sporobolus compositus var. compositus | 0–50 | – | ||
| sand dropseed | SPCR | Sporobolus cryptandrus | 0–50 | – | ||
| purpletop tridens | TRFL2 | Tridens flavus | 0–50 | – | ||
| 10 | Mid/Shortgrasses | 150–300 | ||||
| hooded windmill grass | CHCU2 | Chloris cucullata | 0–75 | – | ||
| cylinder jointtail grass | COCY | Coelorachis cylindrica | 0–75 | – | ||
| Arizona cottontop | DICA8 | Digitaria californica | 0–75 | – | ||
| vine mesquite | PAOB | Panicum obtusum | 0–75 | – | ||
| bristlegrass | SETAR | Setaria | 0–75 | – | ||
| composite dropseed | SPCOC2 | Sporobolus compositus var. compositus | 0–75 | – | ||
|
Forb
|
||||||
| 11 | Forbs | 300–600 | ||||
| Cuman ragweed | AMPS | Ambrosia psilostachya | 0–40 | – | ||
| sagebrush | ARTEM | Artemisia | 0–40 | – | ||
| aster | ASTER | Aster | 0–40 | – | ||
| Berlandier's sundrops | CABE6 | Calylophus berlandieri | 0–40 | – | ||
| whitemouth dayflower | COER | Commelina erecta | 0–40 | – | ||
| prairie clover | DALEA | Dalea | 0–40 | – | ||
| purple prairie clover | DAPU5 | Dalea purpurea | 0–40 | – | ||
| Illinois ticktrefoil | DEIL2 | Desmodium illinoense | 0–40 | – | ||
| ticktrefoil | DESMO | Desmodium | 0–40 | – | ||
| Engelmann's daisy | ENGEL | Engelmannia | 0–40 | – | ||
| beeblossom | GAURA | Gaura | 0–40 | – | ||
| Maximilian sunflower | HEMA2 | Helianthus maximiliani | 0–40 | – | ||
| coastal indigo | INMI | Indigofera miniata | 0–40 | – | ||
| trailing krameria | KRLA | Krameria lanceolata | 0–40 | – | ||
| lespedeza | LESPE | Lespedeza | 0–40 | – | ||
| dotted blazing star | LIPU | Liatris punctata | 0–40 | – | ||
| Nuttall's sensitive-briar | MINU6 | Mimosa nuttallii | 0–40 | – | ||
| yellow puff | NELU2 | Neptunia lutea | 0–40 | – | ||
| largebract Indian breadroot | PECU3 | Pediomelum cuspidatum | 0–40 | – | ||
| amberique-bean | STHE9 | Strophostyles helvola | 0–40 | – | ||
|
Shrub/Vine
|
||||||
| 12 | Shrubs/Vines | 90–150 | ||||
| acacia | ACACI | Acacia | 0–30 | – | ||
| stretchberry | FOPU2 | Forestiera pubescens | 0–30 | – | ||
| algerita | MATR3 | Mahonia trifoliolata | 0–30 | – | ||
| skunkbush sumac | RHTRT | Rhus trilobata var. trilobata | 0–30 | – | ||
| blackberry | RUBUS | Rubus | 0–30 | – | ||
| roundleaf greenbrier | SMRO | Smilax rotundifolia | 0–30 | – | ||
| coralberry | SYOR | Symphoricarpos orbiculatus | 0–30 | – | ||
| grape | VITIS | Vitis | 0–30 | – | ||
| yucca | YUCCA | Yucca | 0–30 | – | ||
|
Tree
|
||||||
| 13 | Trees | 150–300 | ||||
| blackjack oak | QUMA3 | Quercus marilandica | 0–300 | – | ||
| post oak | QUST | Quercus stellata | 0–300 | – | ||
| 14 | Trees | 60–120 | ||||
| hackberry | CELTI | Celtis | 0–30 | – | ||
| hawthorn | CRATA | Crataegus | 0–30 | – | ||
| plum | PRUNU | Prunus | 0–30 | – | ||
| gum bully | SILA20 | Sideroxylon lanuginosum | 0–30 | – | ||
| cedar elm | ULCR | Ulmus crassifolia | 0–30 | – | ||
| Hercules' club | ZACL | Zanthoxylum clava-herculis | 0–30 | – | ||
Interpretations
Animal community
Woody plants provide cover for white tailed deer, bobwhite quail, turkey, and other upland species. These wildlife species have increased along with the brushy plants due to the cover that these plants provide. According to most wildlife biologists, these species prefer a lower successional plant community than was present in historic community. More forbs are needed to meet these species food requirements and woody plants for browse are important for deer. It is often the objective of many land owners to strike a balance in plant community so that these wildlife species can exist along with domestic livestock. This can be accomplished by a carefully thought out grazing and brush management program. It must be realized that managing at a lower successional level may meet some wildlife species requirements very well, but may not be nearly as productive for grazing purposes. Lower successional levels may not be as capable of satisfying ecological functions such as nutrient cycling, hydrologic protection, plant community stability or soil protection. A proper balance can be achieved with careful planning that considers all resources.
Plant Preference by Animal Kind:
This rating system provides general guidance as to animal preference for plant species. It also indicates possible competition between kinds of herbivores for various plants. Grazing preference changes from time to time, especially between seasons, and between animal kinds and classes. Grazing preference does not necessarily reflect the ecological status of the plant within the plant community.
Hydrological functions
State 1. State 1 has optimum rainfall capture and infiltration for the site. Deep rooted plants, tree limbs, and herbaceous grasses all capture rainfall. Their root systems, which naturally die each year leaving behind sub soil water channels, infiltrate a lot of the rainfall into the soil. Probably very little rainfall that soaks into the soil recharges any but temporary, shallow aquifers. Most of the stored moisture is used up by the plants growing on the site. Very little runoff occurs in the state and the runoff that does occur usually does not have a very high sediment load. The herbaceous grasses will protect the topsoil as shingles protect a roof.
State 2. State 2, due to the overstory of trees and the ground surface leaf litter, soaks up most of the rainfall. There may be some concentrated flow on steeper slopes during heavy rainfall events. Very little runoff occurs in this state. If juniper is thick in the understory, it has been shown that as much as 30 percent of the rainfall is entrapped in the foliage only to evaporate into the atmosphere before entering the soil.
State 3. The hydrology in State 3 is very similar to the conditions stated for State 1.
State 4. State 4 has a poor hydrologic cycle especially if the plant community has cropland and the residues are not left on the soil surface. Bare ground leaves the topsoil open to raindrop impact which loosens the soil particle. Once in solution overland flow of the water can carry away sediment. If the land is in permanent pasture and is well managed and does not have any compacted layers, the hydrology is somewhat healthy.
State 5. State 5 has a very poor hydrologic cycle. Extensive bare ground does not protect the soil and concentrated flow patterns excavate a lot of top soil. Soil stability is very poor and effective rainfall is very low.
Recreational uses
Hunting, hiking, camping, equestrian, bird watching and off road vehicle use.
Wood products
Oaks and mesquite are used for firewood and barbecue wood.
Other products
None.
Other information
None.
Supporting information
Inventory data references
Information presented here has been derived from limited NRCS clipping data and field observations of range trained personnel. Lemuel Creswell RMS, Comanche; James Luton RMS, Montague;William Donham, Agronomy, Granbury; Kent Ferguson RMS, Weatherford.
References
-
. 2021 (Date accessed). USDA PLANTS Database. http://plants.usda.gov.
Other references
White-tailed Deer, Their Foods and Management in the Cross Timbers By Kenneth L. Gee, Michael D Porter, Steve Demarais, Fred C. Bryant, and Gary Van Vreede. A Samuel Roberts Noble Foundation Publication, 1991
Contributors
Earl V. Hogan
Mark Moseley NRCS Retired
PES edits by Colin Walden NRCS Soil Survey Region Nine
Approval
Bryan Christensen, 9/21/2023
Acknowledgments
Site Development and Testing Plan:
Future work, as described in a Project Plan, to validate the information in this Provisional Ecological Site Description is needed. This will include field activities to collect low, medium and high intensity sampling, soil correlations, and analysis of that data. Annual field reviews should be done by soil scientists and vegetation specialists. A final field review, peer review, quality control, and quality assurance reviews of the ESD will be needed to produce the final document. Annual reviews of the Project Plan are to be conducted by the Ecological Site Technical Team.
Rangeland health reference sheet
Interpreting Indicators of Rangeland Health is a qualitative assessment protocol used to determine ecosystem condition based on benchmark characteristics described in the Reference Sheet. A suite of 17 (or more) indicators are typically considered in an assessment. The ecological site(s) representative of an assessment location must be known prior to applying the protocol and must be verified based on soils and climate. Current plant community cannot be used to identify the ecological site.
| Author(s)/participant(s) | Colin Walden, Range Management Specialist, Soil Survey Region 9. |
|---|---|
| Contact for lead author | colin.walden@ok.usda.gov |
| Date | 01/26/2018 |
| Approved by | Bryan Christensen |
| Approval date | |
| Composition (Indicators 10 and 12) based on | Annual Production |
Indicators
-
Number and extent of rills:
Minimal evidence of current or past rill formation. -
Presence of water flow patterns:
Few water flow patterns on steep areas. Short and stable, not incising. -
Number and height of erosional pedestals or terracettes:
No pedestals or terracettes present.
-
Bare ground from Ecological Site Description or other studies (rock, litter, lichen, moss, plant canopy are not bare ground):
Bare ground less than 10 percent. Bare areas small and not connected. -
Number of gullies and erosion associated with gullies:
No gullies present. -
Extent of wind scoured, blowouts and/or depositional areas:
No wind scoured areas. -
Amount of litter movement (describe size and distance expected to travel):
Litter movement less than 3 feet. Vegetative cover should restrict litter movement over long distances. Only herbaceous litter less than .25 inches expected to move. -
Soil surface (top few mm) resistance to erosion (stability values are averages - most sites will show a range of values):
Soil stability scores of 5 or greater expected. -
Soil surface structure and SOM content (include type of structure and A-horizon color and thickness):
Duffau - A--0 to 4 inches; dark grayish brown (10YR 4/2) fine sandy loam, very dark grayish brown (10YR 3/2) moist; weak very fine subangular blocky and granular structure;
Refer to soils description for correlated component. -
Effect of community phase composition (relative proportion of different functional groups) and spatial distribution on infiltration and runoff:
Presence of perennial tall and midgrasses help to facilitate percolation into the soil. Some runoff expected on steeper slopes during moderate precipitation events. -
Presence and thickness of compaction layer (usually none; describe soil profile features which may be mistaken for compaction on this site):
No compaction under reference conditions. Beware texture change of Bt horizon not product of compaction. -
Functional/Structural Groups (list in order of descending dominance by above-ground annual-production or live foliar cover using symbols: >>, >, = to indicate much greater than, greater than, and equal to):
Dominant:
Native Tallgrasses (groups 1-4)Sub-dominant:
Forbs (11)
Oaks (13)Other:
All other groupsAdditional:
-
Amount of plant mortality and decadence (include which functional groups are expected to show mortality or decadence):
Possible mortality only during prolonged drought. Less than 5%. -
Average percent litter cover (%) and depth ( in):
Litter expected to be at 75% cover at average .25 inch depth. -
Expected annual annual-production (this is TOTAL above-ground annual-production, not just forage annual-production):
Annual production 4500 lb/acre. Ranging from 3000 to 6000 lbs. -
Potential invasive (including noxious) species (native and non-native). List species which BOTH characterize degraded states and have the potential to become a dominant or co-dominant species on the ecological site if their future establishment and growth is not actively controlled by management interventions. Species that become dominant for only one to several years (e.g., short-term response to drought or wildfire) are not invasive plants. Note that unlike other indicators, we are describing what is NOT expected in the reference state for the ecological site:
Juniper(ashe juniper/eastern redcedar) most common invader. Also greenbriar, poison ivy, and other woodies will increase
without fire. -
Perennial plant reproductive capability:
Plants should be capable of reproducing every year with exception of prolonged growing season drought.
Print Options
Sections
Font
Other
The Ecosystem Dynamics Interpretive Tool is an information system framework developed by the USDA-ARS Jornada Experimental Range, USDA Natural Resources Conservation Service, and New Mexico State University.
Click on box and path labels to scroll to the respective text.
