
Natural Resources
Conservation Service
Ecological site R151XY006LA
Clayey Chenier Brackish Marsh 55-64 PZ
Last updated: 3/24/2025
Accessed: 12/21/2025
General information
Approved. An approved ecological site description has undergone quality control and quality assurance review. It contains a working state and transition model, enough information to identify the ecological site, and full documentation for all ecosystem states contained in the state and transition model.
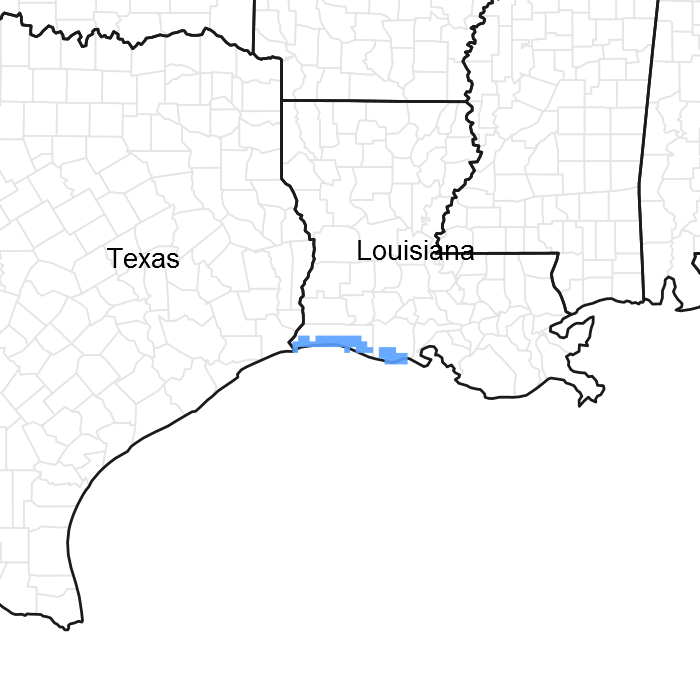
Figure 1. Mapped extent
Areas shown in blue indicate the maximum mapped extent of this ecological site. Other ecological sites likely occur within the highlighted areas. It is also possible for this ecological site to occur outside of highlighted areas if detailed soil survey has not been completed or recently updated.
MLRA notes
Major Land Resource Area (MLRA): 151X–Gulf Coast Marsh
Major land resource area (MLRA)151, Gulf Coast Marsh, is in Louisiana (95 percent), Texas (4 percent), and Mississippi (1 percent). It makes up about 8,495 square miles (22,015 square kilometers). The towns of Gretna, Chalmette, and Marrero, Louisiana, and the city of New Orleans, Louisiana, are in the eastern part of this MLRA. The town of Port Arthur, Texas, is in the western part. Interstate 10 and U.S. Highway 90 cross the area. The New Orleans Naval Air Station is in this MLRA. Fort Jackson, overlooking the mouth of the Mississippi River, and the Jean Lafitte National Historic Park and Preserve are in the MLRA. A number of national wildlife refuges and State parks occur throughout this area. MLRA 151 is a very complex ecosystem with active deltaic development and subsidence with extreme anthropogenic impact by man with construction of flood protection levees and channelization occurring on the eastern portion of the MLRA. The Western portion of the MLRA is more stable in that portions of the landscape is protected naturally by the Chenier's, although there is Anthropogenic affects of the interior due to channelization for navigation.
Classification relationships
Major Land Resource Area (MLRA) and Land Resource Unit (LRU) (USDA-Natural Resources Conservation Service, 2006)
The Natural Communities of Louisiana - (Louisiana Natural Heritage Program - Louisiana Department of Wildlife and Fisheries)
Ecological site concept
These areas are on low ridges on broad coastal brackish marshes at elevations of 2 to 4 feet above sea level. They are flooded with brackish water during storms and high tides. They are also flooded with fresh water during heavy rains. They formed in clayey over load sediments. Slopes range less than 1 percent. This site is a transition site between upland sites and marsh sites having characteristics of both.
Associated sites
| R151XY002LA |
Saline Marsh 55-64 PZ Saline Mineral Marsh occasionally occurs adjacent to the Clayey Chenier Brackish Marsh site. |
|---|---|
| R151XY005LA |
Brackish Firm Mineral Marsh 55-64 PZ Brackish Firm Mineral Marsh frequently occurs adjacent to the Clayey Chenier Brackish Marsh site. |
Similar sites
| R151XY005LA |
Brackish Firm Mineral Marsh 55-64 PZ Brackish Firm Mineral Marsh occupies the same position on the landscape, has similar plant species composition, but is more productive than the Clayey Chenier Brackish Marsh site. |
|---|
Table 1. Dominant plant species
| Tree |
Not specified |
|---|---|
| Shrub |
Not specified |
| Herbaceous |
Not specified |
Physiographic features
These areas are on low ridges on broad coastal brackish marshes at elevations of 2 to 4 feet above sea level. They are flooded with brackish water during storms and high tides. They are also flooded with fresh water during heavy rains. They formed in clayey over load sediments. Slopes range less than 1 percent.
Table 2. Representative physiographic features
| Landforms |
(1)
Marsh
(2) Delta plain |
|---|---|
| Elevation | 2 – 4 ft |
| Slope | 1% |
| Water table depth | 42 in |
| Aspect | Aspect is not a significant factor |
Climatic features
The average annual precipitation is 60 to 65 inches. About 70 percent of the precipitation occurs during the growing season. Rainfall typically occurs as post-frontal precipitation in the winter and heat-convection showers and thunderstorms in the spring and summer. In addition, tropical storms can bring large amounts of rainfall. The freeze-free period averages 325 days and ranges from 290 to 365 dyas, increasing in length from north to south.
Table 3. Representative climatic features
| Frost-free period (average) | 327 days |
|---|---|
| Freeze-free period (average) | 327 days |
| Precipitation total (average) | 63 in |
Figure 2. Monthly precipitation range
Figure 3. Monthly average minimum and maximum temperature
Figure 4. Annual precipitation pattern
Figure 5. Annual average temperature pattern
Influencing water features
INFLUENCING WATER FEATURES
Marsh ecosystems are characterized by unique vegetative and hydrologic factors. Salinity, depth of water, duration of inundation, and slight differences in elevation determine the kinds of plants that can persist in marsh ecosystems. Several factors may affect salinity and/or water depth as well as duration of inundation:
Natural Factors:
• Upstream Hydrology – the duration of flooding is influenced by the volume of water discharged upstream (runoff) in the hydrologic unit. This may be a permanent or transient feature of the water regime.
• Tidal Exchange – all marsh ecosystems are affected to some degree by tidal exchange.
• Salinity – the amount of salt per unit volume of water is a limiting factor in determining which plants can persist in a marsh ecosystem. Measured in parts per thousand (ppt). Relatively few plants can tolerate prolonged exposure or inundation to waters with high salt concentrations.
Soil features
The dominant soil on this ecological site is Mermentau. These areas are on low ridges on broad coastal brackish marshes at elevations of 2 to 4 feet above sea level. They are flooded with brackish water during storms and high tides. They are also flooded with fresh water during heavy rains. They formed in clayey over loamy sediments. Slopes range less than 1 percent.
Taxonomic Classification:
Mermentau - Clayey over loamy, smectitic over mixed, superactive, nonacid, hyperthermic Typic Endoaquepts
Table 4. Representative soil features
| Surface texture |
(1) Clay loam (2) Silty clay loam |
|---|---|
| Family particle size |
(1) Loamy |
| Drainage class | Poorly drained |
| Permeability class | Very slow |
| Soil depth | 72 in |
| Surface fragment cover <=3" | Not specified |
| Surface fragment cover >3" | Not specified |
| Available water capacity (0-40in) |
1.2 – 6 in |
| Calcium carbonate equivalent (0-40in) |
Not specified |
| Electrical conductivity (0-40in) |
4 – 16 mmhos/cm |
| Sodium adsorption ratio (0-40in) |
10 – 35 |
| Soil reaction (1:1 water) (0-40in) |
6.6 – 8.4 |
| Subsurface fragment volume <=3" (Depth not specified) |
5% |
| Subsurface fragment volume >3" (Depth not specified) |
Not specified |
Ecological dynamics
Ecological Dynamics of the Site:
The Clayey Chenier Brackish Marsh ecological site is a poorly drained site. Tidal action impacts the site primarily by restricting drainage during periods of high rainfall. Infiltration rates on the soils of this site vary from very slow to moderately fast. The soils are predominantly clayey overwash over sandy chenier. The soils are trafficable to livestock. During periods of low rainfall, the site is trafficable for farm equipment on a limited basis.
Elevations on the site range from sea level to 5 feet above sea level. During periods of high tides, brackish water may be present at lower elevations. Storm tides can inundate the entire site with saline water. Extensive water control is not needed or practical for management of this site due to the elevation of the majority of the site. The water table varies from at or near the soil surface during seasonal high rainfall to 3 ½ feet below the soil surface during periods of low rainfall.
The Clayey Chenier Brackish Marsh is a dynamic ecosystem which changes constantly, and sometimes rapidly, as a result of natural environmental conditions and climatic events. These variations cause temporary shifts in kinds, amounts, and proportions of secondary vegetation. The historic plant community plant community is a mixture of plants, primarily grasses, which can withstand brief periods of high water and temporary increases in salinity levels. Bunchgrasses are most prominent when the site is properly managed. Gulf cordgrass is the dominant species and marshhay cordgrass is the sub-dominant species. Seashore saltgrass and seashore paspalum are significant, but minor components of this plant community.
Fire and livestock grazing are the primary drivers that cause shifts in species composition, diversity of the plant community, and the extent of desired vegetation. Uncontrolled grazing and lack of fire cause the plant species composition to change and the plant community diversity and structure to diminish. If grazing management and prescribed fire are not carried out properly and in a timely manner, the vegetation will transition through a predictable sequence of plant communities and vegetation states.
Elimination of fire from the ecosystem can result in an unhealthy plant community dominated by senescent vegetation and a loss of plant diversity.
In order to maintain or improve the plant community, livestock grazing must be managed by implementing a planned grazing system. Sustainable stocking rates are the primary factor to consider. Grazing management can be enhanced by manipulation of the time, frequency, intensity, and duration of grazing.
Geese are the primary wildlife species on this site. They prefer the site when it is open and free of woody species. They eat the roots, shoots, and tubers of many plants that are common on this site. Freshly burned areas are especially attractive because of the fresh, tender leaf growth. The regrowth provides high quality vegetation for geese. Burns should be sufficient in size to prevent destructive grazing by geese. Deer may occasionally pass through the area, but this is not a preferred site for deer or furbearers because of a lack of plants that they prefer to graze or browse.
Fire is a natural part of the ecosystem. It is a primary tool for management of marsh ecosystems. Fire is used to remove old growth, encourage vigorous new growth, enhance wildlife habitat, improve forage quality, and increase production potential. Burning also changes the structure of the plant community which can be beneficial to many wildlife species.
Burning should be done when there is at least six inches of water covering the marsh. This cushion of water protects the vegetative reproduction tissues of marsh plants. Unless burning is followed by proper grazing management, the plant community may change radically from a gulf cordgrass and midgrass dominated community to a community of short sod-forming grasses. When fire is excluded or not implemented on a timely basis, the plant community becomes dominated by woody shrubs.
State and Transitional Pathways:
The State and Transition Diagram which follows provides information on some of the most typical pathways that the vegetation on this site can follow as the result of natural events, management inputs, and application of conservation treatments. There may be other plant communities that can exist on this site under certain conditions. Consultation with local experts and professionals is recommended prior to application of practices or management strategies in order to ensure that specific objectives will be met.
State and transition model
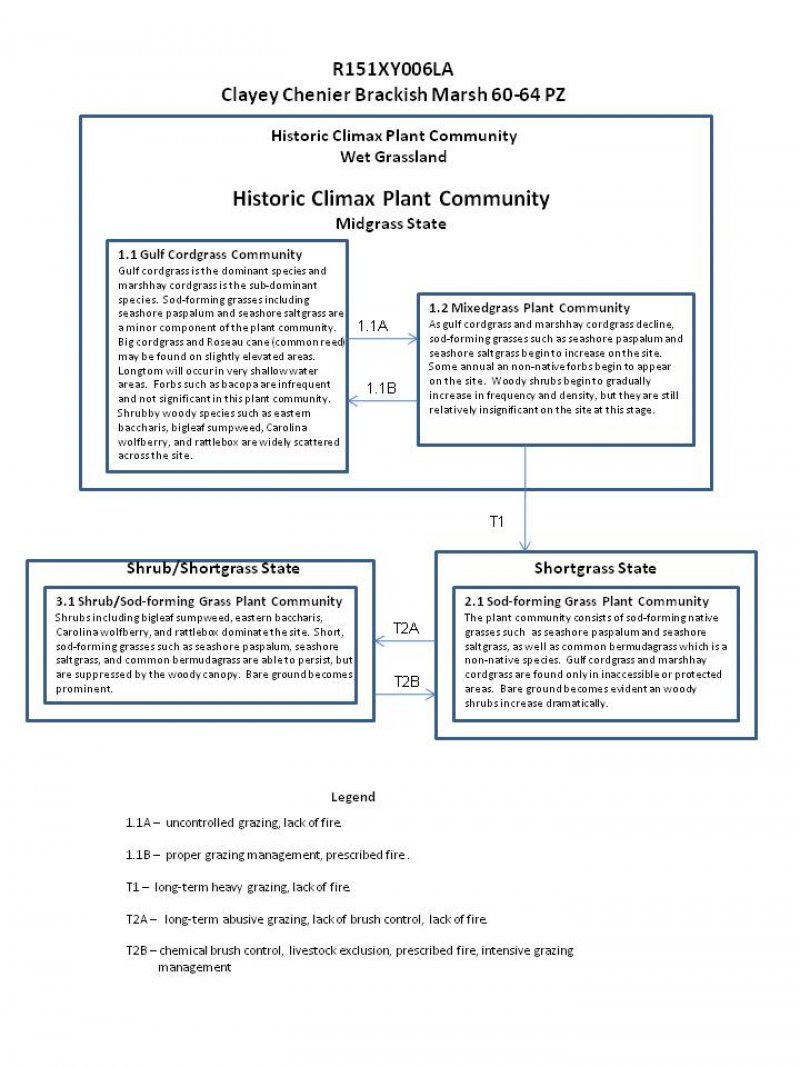
More interactive model formats are also available.
View Interactive Models
More interactive model formats are also available.
View Interactive Models
Click on state and transition labels to scroll to the respective text
Ecosystem states
State 1 submodel, plant communities
State 2 submodel, plant communities
State 3 submodel, plant communities
State 1
Midgrass State
Community 1.1
Gulf Cordgrass Plant Community

Figure 6. CCBM-1.1
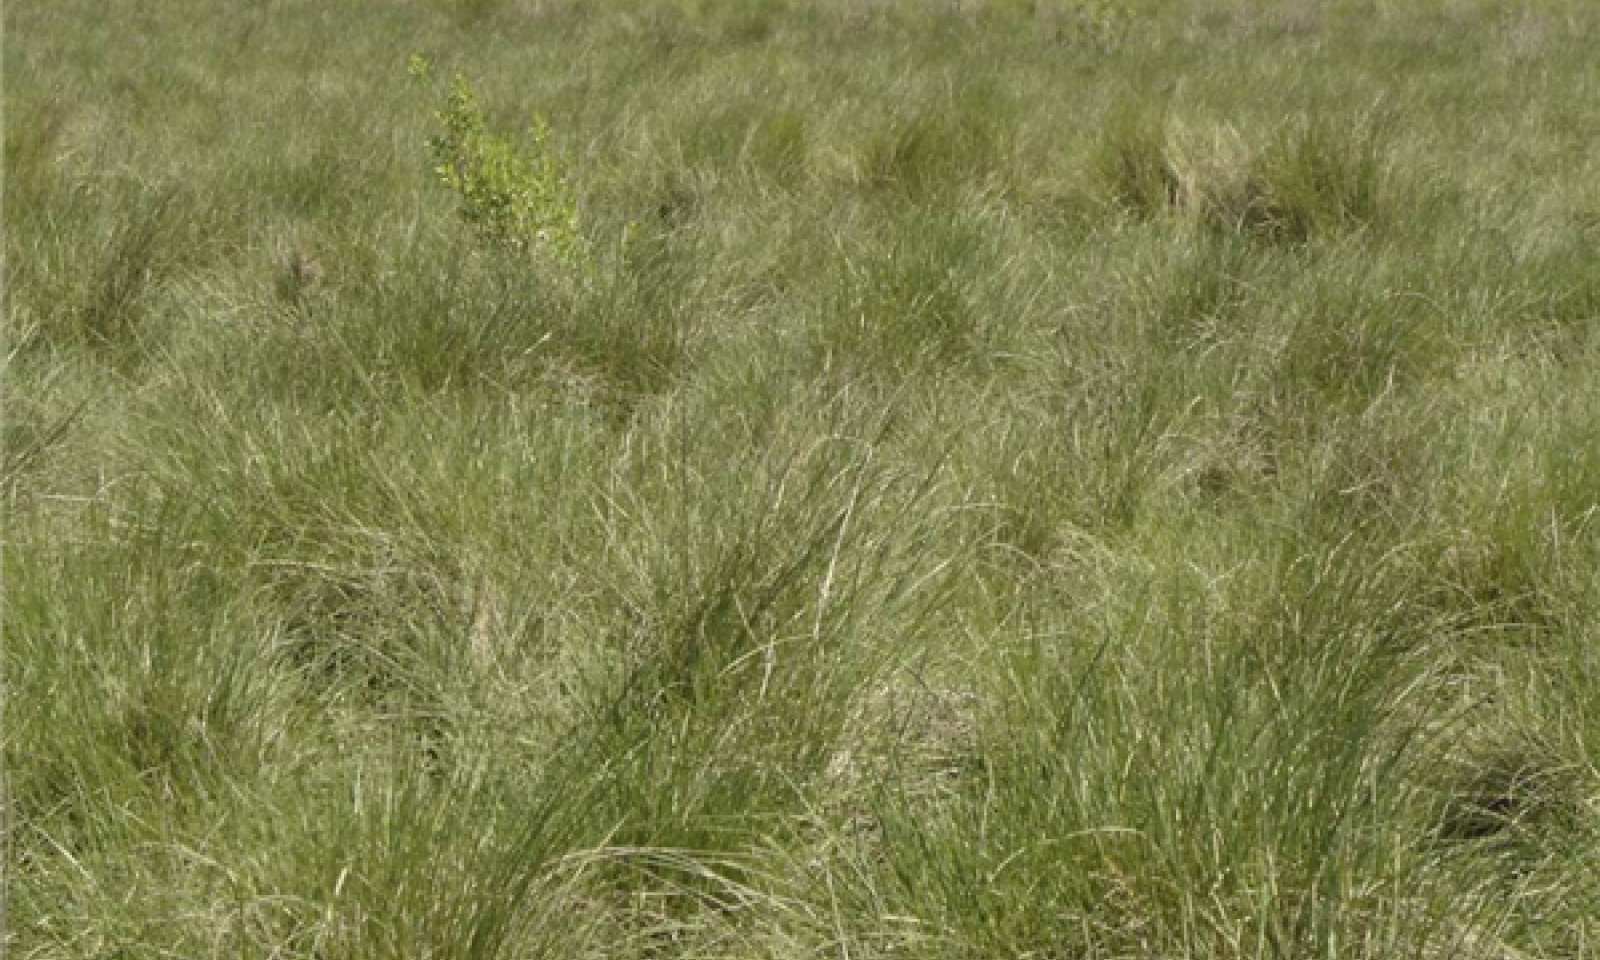
The fire-induced historical plant community is dominated by bunchgrasses. Gulf cordgrass is the dominant species, and marshhay cordgrass is a sub-dominant. Sod-forming grasses such as seashore paspalum and seashore saltgrass are a minor component of the historic community. In this plant community, sod-forming grasses are usually associated with the micro-hydrology of the drainageways on the site. Other plants that occur in minor amounts in this plant community include big cordgrass and Roseau cane (common reed) which are found at the higher elevations, and longtom which grows in areas with up to 2 inches of water.
Figure 7. Annual production by plant type (representative values) or group (midpoint values)
Table 5. Annual production by plant type
| Plant type | Low (lb/acre) |
Representative value (lb/acre) |
High (lb/acre) |
|---|---|---|---|
| Grass/Grasslike | 6500 | 8700 | 11500 |
| Forb | 0 | 100 | 300 |
| Shrub/Vine | 0 | 200 | 200 |
| Total | 6500 | 9000 | 12000 |
Figure 8. Plant community growth curve (percent production by month). LA1511, Louisiana Gulf Coast Marshes. Fresh, Brackish, and Saline Marshes of the Louisiana Gulf Coast .
| Jan | Feb | Mar | Apr | May | Jun | Jul | Aug | Sep | Oct | Nov | Dec |
|---|---|---|---|---|---|---|---|---|---|---|---|
| J | F | M | A | M | J | J | A | S | O | N | D |
| 1 | 3 | 13 | 23 | 25 | 10 | 7 | 5 | 5 | 5 | 2 | 1 |
Community 1.2
Mixed Grass Plant Community
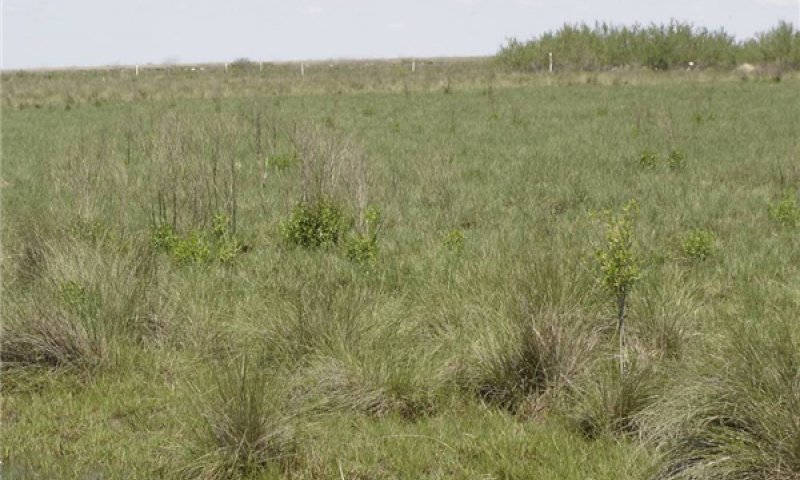
Figure 9. CCBM-1.2
Uncontrolled grazing eventually leads to a decrease in the amount and proportion of bunchgrasses such as gulf cordgrass and marshhay cordgrass. As the bunchgrasses decrease, sod-forming grasses such as seashore paspalum and seashore saltgrass begin to increase on the site. This change usually occurs first in areas where livestock concentrate such as shade, water, feeding facilities, etc. Woody shrubs begin to appear during this phase, but they are relatively insignificant at this point. When an adequate fuel load exists, prescribed fire can be used on this site as management tool to increase the palatability and accessibility of vegetation and to control woody shrubs. Unless burning is followed by proper grazing management, the plant community may change radically from a gulf cordgrass and midgrass dominated community to a community of short sod-forming grasses.
Figure 10. Annual production by plant type (representative values) or group (midpoint values)
Table 6. Annual production by plant type
| Plant type | Low (lb/acre) |
Representative value (lb/acre) |
High (lb/acre) |
|---|---|---|---|
| Grass/Grasslike | 3700 | 5900 | 7500 |
| Shrub/Vine | 200 | 400 | 600 |
| Forb | 100 | 200 | 400 |
| Total | 4000 | 6500 | 8500 |
Figure 11. Plant community growth curve (percent production by month). LA1511, Louisiana Gulf Coast Marshes. Fresh, Brackish, and Saline Marshes of the Louisiana Gulf Coast .
| Jan | Feb | Mar | Apr | May | Jun | Jul | Aug | Sep | Oct | Nov | Dec |
|---|---|---|---|---|---|---|---|---|---|---|---|
| J | F | M | A | M | J | J | A | S | O | N | D |
| 1 | 3 | 13 | 23 | 25 | 10 | 7 | 5 | 5 | 5 | 2 | 1 |
Pathway A
Community 1.1 to 1.2


uncontrolled grazing, lack of fire.
Pathway B
Community 1.2 to 1.1


proper grazing management, prescribed fire.
State 2
Shortgrass State
Community 2.1
Sod-Forming Grass Plant Community
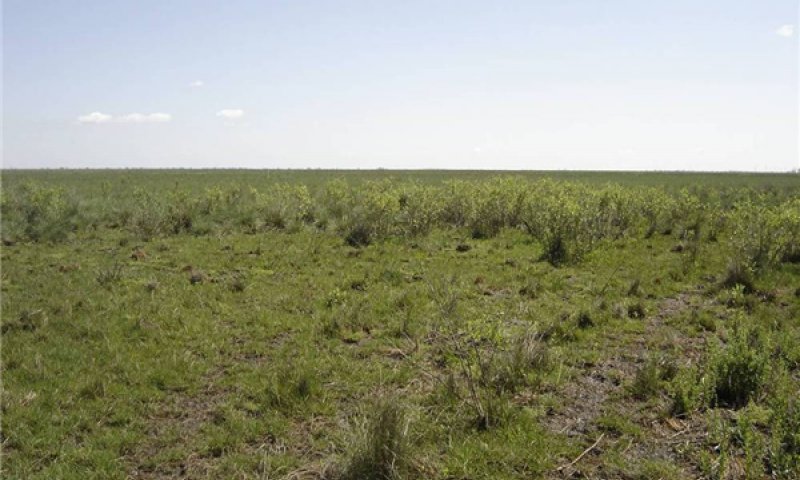
Figure 12. CCBM-2.1
Uncontrolled, long-term heavy grazing by cattle will eventually cause the bunchgrass plant community to become a community dominated by short, sod-forming native grasses, such as seashore saltgrass and seashore paspalum. Bermudagrass, a non-native species encroaches on the site and becomes a significant part of the plant community. This represents a major shift in the plant community. Gulf cordgrass and other scattered bunchgrasses may still exist in inaccessible areas or areas protected by shrubs. Bare ground increases significantly at this stage. This plant community phase is susceptible to erosion because of the relatively high amount of bare ground and the effects of continuous heavy hoof action during wet conditions. Woody shrubs such as bigleaf sumpweed, eastern baccharis, and Carolina wolfberry increase dramatically and rattlebox appears. The use of fire as a management tool is not a major consideration in this plant community because of the lack of sufficient fine fuel. Without an adequate fuel load, fire is not capable of controlling the encroachment and establishment of woody species.
Figure 13. Annual production by plant type (representative values) or group (midpoint values)
Table 7. Annual production by plant type
| Plant type | Low (lb/acre) |
Representative value (lb/acre) |
High (lb/acre) |
|---|---|---|---|
| Grass/Grasslike | 1950 | 3000 | 4100 |
| Shrub/Vine | 100 | 200 | 300 |
| Forb | 50 | 100 | 200 |
| Total | 2100 | 3300 | 4600 |
Figure 14. Plant community growth curve (percent production by month). LA1511, Louisiana Gulf Coast Marshes. Fresh, Brackish, and Saline Marshes of the Louisiana Gulf Coast .
| Jan | Feb | Mar | Apr | May | Jun | Jul | Aug | Sep | Oct | Nov | Dec |
|---|---|---|---|---|---|---|---|---|---|---|---|
| J | F | M | A | M | J | J | A | S | O | N | D |
| 1 | 3 | 13 | 23 | 25 | 10 | 7 | 5 | 5 | 5 | 2 | 1 |
State 3
Shrub/Shortgrass State
Community 3.1
Shrub/Sod-Grass Plant Community
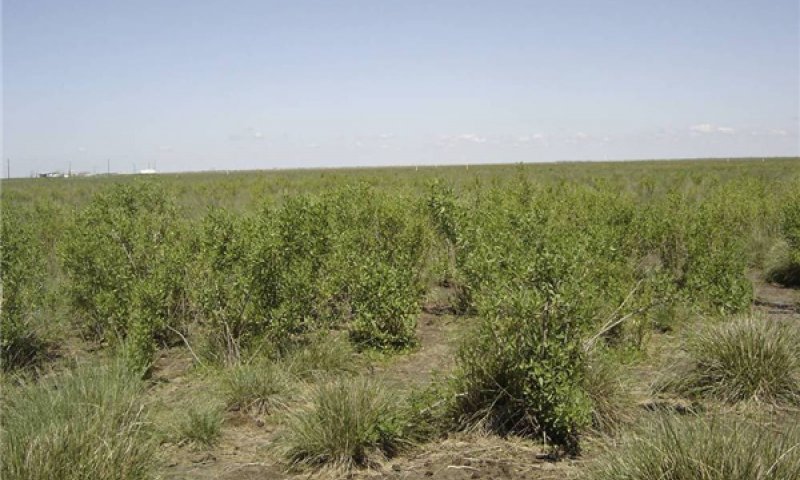
Figure 15. CCBM-3.1
Long-term abusive grazing will eventually result in this site becoming dominated by woody shrubs such as bigleaf sumpweed, eastern baccharis, Carolina wolfberry, and rattlebox. Short, sod-forming grasses such as seashore paspalum, seashore saltgrass, and common bermudagrass are able to persist under abusive grazing conditions, but are suppressed by the woody canopy. This results in increased grazing pressure on the already diminishing forage resource. Bare ground becomes prominent in areas where cattle concentrate. Improved grazing management alone cannot reverse the effects of mismanagement once the site has reached this degraded state. Expensive and extensive chemical brush management is necessary to control noxious shrubs. Grazing management must be carefully planned and intensively managed in order to reclaim and maintain a more desirable plant community for forage production, wildlife habitat, and erosion control. The management system required to accomplish the recovery might include livestock exclusion to develop a sufficient fuel load for prescribed burning, cross fencing to permit controlled grazing and deferment, reduction of stocking rates, and implementation of an intensive grazing management system.
Figure 16. Annual production by plant type (representative values) or group (midpoint values)
Table 8. Annual production by plant type
| Plant type | Low (lb/acre) |
Representative value (lb/acre) |
High (lb/acre) |
|---|---|---|---|
| Grass/Grasslike | 1400 | 2000 | 2800 |
| Shrub/Vine | 400 | 700 | 1000 |
| Forb | 200 | 400 | 600 |
| Total | 2000 | 3100 | 4400 |
Figure 17. Plant community growth curve (percent production by month). LA1511, Louisiana Gulf Coast Marshes. Fresh, Brackish, and Saline Marshes of the Louisiana Gulf Coast .
| Jan | Feb | Mar | Apr | May | Jun | Jul | Aug | Sep | Oct | Nov | Dec |
|---|---|---|---|---|---|---|---|---|---|---|---|
| J | F | M | A | M | J | J | A | S | O | N | D |
| 1 | 3 | 13 | 23 | 25 | 10 | 7 | 5 | 5 | 5 | 2 | 1 |
Transition A
State 1 to 2
long-term heavy grazing, lack of fire.
Transition A
State 2 to 3
long-term abusive grazing, lack of brush control, lack of fire.
Transition B
State 3 to 2
chemical brush control, livestock exclusion, prescribed fire, intensive grazing management
Additional community tables
Table 9. Community 1.1 plant community composition
| Group | Common name | Symbol | Scientific name | Annual production (lb/acre) | Foliar cover (%) | |
|---|---|---|---|---|---|---|
|
Grass/Grasslike
|
||||||
| 1 | Grass/Grasslikes | 6500–12000 | ||||
| gulf cordgrass | SPSP | Spartina spartinae | 3700–7000 | – | ||
| saltmeadow cordgrass | SPPA | Spartina patens | 2500–5000 | – | ||
| seashore dropseed | SPVI3 | Sporobolus virginicus | 400–1200 | – | ||
| saltgrass | DISP | Distichlis spicata | 400–1200 | – | ||
| seashore paspalum | PAVA | Paspalum vaginatum | 400–1200 | – | ||
| big cordgrass | SPCY | Spartina cynosuroides | 0–800 | – | ||
| common reed | PHAU7 | Phragmites australis | 0–600 | – | ||
| longtom | PADE24 | Paspalum denticulatum | 0–200 | – | ||
| torpedo grass | PARE3 | Panicum repens | 50–200 | – | ||
| dwarf spikerush | ELPA5 | Eleocharis parvula | 200–100 | – | ||
| annual rabbitsfoot grass | POMO5 | Polypogon monspeliensis | 0–100 | – | ||
|
Forb
|
||||||
| 2 | Forbs | 0–300 | ||||
| herb of grace | BAMO | Bacopa monnieri | 0–300 | – | ||
|
Shrub/Vine
|
||||||
| 3 | Shrubs | 0–200 | ||||
| eastern baccharis | BAHA | Baccharis halimifolia | 0–100 | – | ||
| Jesuit's bark | IVFR | Iva frutescens | 0–50 | – | ||
| Carolina desert-thorn | LYCA2 | Lycium carolinianum | 0–50 | – | ||
| rattlebox | SEPU7 | Sesbania punicea | 0–50 | – | ||
Interpretations
Animal community
The Clayey Chenier Brackish Marsh provides fair habitat for geese, swamp rabbits, and song birds. Predators such as coyotes and bobcats are present on this site.
Geese arrive in the marsh in October, and stay though the winter until late March before returning to the North. Geese prefer to feed in open areas with very short, tender vegetation. They eat the roots, tubers, and tender leaf growth of plants. Recently burned areas are favored feeding grounds for geese. After seasonal grazing by geese, these areas are heavily disturbed and often denuded. This is not a preferred site for deer because of a scarcity of desirable browse and food plants.
Cattle are grazed in the Clayey Chenier Brackish Marsh. Marsh cattle are often subjected to harsh and strenuous conditions. Insects, disease, standing water, boggy soil conditions, extremely warm temperatures and high humidity, lack of shelter and fresh drinking water sources present unique challenges to cattle grazing in the marsh.
During the summer months, heavy infestations of mosquitoes and deer flies cause discomfort and stress for cattle, and can lead to serious health problems. In the most extreme situations mosquitoes can kill cattle, and are especially hazardous to newborn calves. Seasonal grazing is the normal practice. Most cattle are usually moved into the marsh in late October or early November and moved to intensively managed pasturelands or fresher marsh sites by the end of May.
Hydrological functions
The hydrology of the Clayey Chenier Brackish Marsh ecosystem is dominated by tidal activity of the gulf. Historically, the hydrologic head of natural rivers and bayous buffered tidal flow to inland marshes. The development of deepwater navigation canals, as well as the deepening and realignment of natural riverine systems has provided a conduit for salt water into previously fresher marsh ecosystems. Geologic subsidence is another major factor in salt water intrusion into fresher marshes.
Storm tides can create overland flow which can completely inundate the site. The low infiltration rates on the clay soils on this site can result in ponding or excess water during storms and seasonally high rainfall periods. Surface water drainage is very slow.
Recreational uses
Hunting, camping, boating, tourism, and bird watching offer recreational opportunities for the public as well as economic opportunities for landowners in the marsh. Goose hunting is prevalent in this area. The marsh sites are preferred areas for resident and migratory waterfowl and songbirds. Hunting camps are common in the marsh. There are many state and national wildlife refuges in the marsh. Recreational boating, fishing, and crabbing are common activities in adjacent water bodies. In recent years, bird watching has become increasingly popular with the public. Bird watching potential can be enhanced by constructing observation platforms, boardwalks, etc. to provide access for visitors.
Supporting information
Inventory data references
Production and Composition Data for Native Grazing Lands (SCS-RANGE-417) clipping data was reviewed to determine species occurrence and production on soils that are representative of the Sandy Chenier ecological site. In addition vegetation transect data from Cameron and Vermillion Parishes collected from 1991-1995 was used to determine species occurrence and production on typical Sandy Chenier ecological sites.
Other references
•Allen, Dr. Charles, Dawn Allen Newman, and Dr. Harry Winters. Grasses of Louisiana, 3rd Edition. Allen’s Native Ventures. Pitkin, LA. 2004.
•Ball, D.M., C.S. Hoveland, and G.D. Lacefield. Southern Forages, Third Edition. Potash and Phosphate Institute and Foundation for Agronomic Research. Norcross, GA. 2002.
•Brown, Clair A. Wildflowers of Louisiana and Adjoining States. Louisiana State University Press. Baton Rouge, LA. 1991.
•Chabreck, Robert H. and R.E. Condrey. Common Vascular Plants of the Louisiana Marsh. Sea Grant Publication No. LSU-T-79-003. Louisiana State University Center for Wetland Resources. Baton Rouge, LA. 1979.
•Chabreck, Robert H. Vegetation, Water and Soil Characteristics of the Louisiana Coastal Region. Bulletin 664. Louisiana State University. Baton Rouge, LA. 1972.
•Lee, Stuart. The Value of High Ground in a Coastal Landscape. WaterMarks Number 38. September 2008. www.lacoast.gov/newsletter.htm. Louisiana Coastal Wetlands Conservation and Restoration Task Force. Alexandria, LA. 2008.
•Louisiana Department of Wildlife and Fisheries. The Natural Communities of Louisiana. Louisiana Natural Heritage Program. LDWF. Baton Rouge, LA. 2004
•Post, Lauren C. The Old Cattle Industry of Southwest Louisiana. The McNeese Review. Volume 9. 1957.
•Radford, Albert E., Harry E. Ahles and C. Ritchie Bell. Manual of the Vascular Flora of the Carolinas. The University of North Carolina Press. Chapel Hill, NC. 1987.
•Stutzenbaker, Charles D. Aquatic and Wetland Plants of the Western Gulf Coast. Texas Parks and Wildlife Department, Wildlife Division. Austin, TX. 1999.
•Tarver, David P., John A. Rodgers, Michael J. Mahler, and Robert L. Lazor. Aquatic and Wetland Plants of Florida Second Edition. Bureau of Aquatic Plant Research and Control. Florida Department of Natural Resources. 1979.
•Thomas, R. Dale & Charles M. Allen. Atlas of the Vascular Flora of Louisiana, Vol.I: Ferns & Fern Allies, Conifers, & Monocotyledons. Louisiana Department of Wildlife & Fisheries Natural Heritage Program and The Nature Conservancy. Baton Rouge, LA. 1993.
•Thomas, R. Dale & Charles M. Allen. Atlas of the Vascular Flora of Louisiana, Vol.II: Dicotyledons, Acanthaceae – Euphorbiaceae. Louisiana Department of Wildlife & Fisheries Natural Heritage Program and The Nature Conservancy. Baton Rouge, LA. 1996.
•Thomas, R. Dale & Charles M. Allen. Atlas of the Vascular Flora of Louisiana, Vol.III: Dicotyledons, Fabaceae – Zygophyllaceae. Louisiana Department of Wildlife & Fisheries Natural Heritage Program and The Nature Conservancy. Baton Rouge, LA. 1998.
•United States Department of Agriculture Natural Resources Conservation Service. The PLANTS Database http://plants.usda.gov. USDA NRCS National Plant Data Center. Baton Rouge, LA. 2008.
•United States Department of Agriculture Natural Resources Conservation Service. Cameron-Creole Watershed 2003 Vegetative Monitoring Report. USDA NRCS. Alexandria, LA. 2007.
•United States Department of Agriculture Natural Resources Conservation Service. Ag Handbook 296. Land Resource Regions and Major Land Resource Areas of the United States, the Caribbean, and the Pacific Basin. USDA NRCS Soil Survey Division. Washington, DC. 2006.
•United States Department of Agriculture Natural Resources Conservation Service. Production and Composition Record for Native Grazing Lands. SCS-RANGE-417 data from Cameron, Vermillion, Iberia, St. Mary, Terrebonne, and La Fourche Parishes. 1981-1986.
•United States Department of Agriculture Natural Resources Conservation Service. Published Soil Surveys from Cameron, Vermillion, Iberia, St. Mary, Terrebonne, and La Fourche Parishes. Various publication dates.
•United States Department of Agriculture Natural Resources Conservation Service. Web Soil Survey. http://websoilsurvey.nrcs.usda.gov/app. USDA NRCS Soil Survey Division. Washington, DC. 2008.
•United States Department of Agriculture Soil Conservation Service. Louisiana Wetlands Plant List. USDA SCS Louisiana Bulletin No. 190-7-3. USDA SCS. Alexandria, LA. 1986.
•United States Department of Agriculture Soil Conservation Service. Range Site Descriptions for the Gulf Coast Marsh Major Land Resource Area 151. USDA SCS. Alexandria, LA. Various publication dates.
•United States Department of Agriculture Soil Conservation Service. Submerged and Floating Aquatic Plants of South Louisiana. Alexandria, LA. 1988.
•United States Department of Agriculture Soil Conservation Service. Southern Wetland Flora. USDA SCS South National Technical Center, Fort Worth, TX.
•United States Department of Agriculture Soil Conservation Service. Louisiana’s Native Ranges and Their Proper Use. USDA SCS. Alexandria, LA. 1982.
•United States Department of Agriculture Soil Conservation Service. 100 Native Forage Grasses in 11 Southern States. Agriculture Handbook 389. 1971
•United States Department of Agriculture Soil Conservation Service. Louisiana Range Handbook. USDA SCS. Alexandria, LA. 1956.
•United States Department of Agriculture Soil Conservation Service. Results of Plant Analyses From Samples Sent In During 1950 (Louisiana). USDA Soil Conservation Service Operations Laboratory. Soil Conservation Service. Fort Worth, TX. 1951.
•United States Department of Interior Fish and Wildlife Service. Classification of Wetlands and Deepwater Habitats of the United States. USDI FWS. Washington, DC. 1979.
•United States Department of Interior Fish and Wildlife Service. National List of Plant Species That Occur In Wetlands: Southeast Region (Region 2). USDI FWS Biological Report 88. Washington, DC. 1988.
•Yarlett, Lewis A. Common Grasses of Florida and the Southeast. The Florida Native Plant Society. Spring Hill, FL. 1996.
ACKNOWLEDGEMENTS
Johanna Pate, State Grazing Lands Specialist, USDA Natural Resources Conservation Service, Alexandria, LA.
Contributors
Jack Cutshall And Dan Caudle
Jack R. Cutshall And Dan M. CAudle
Approval
Matthew Duvall, 3/24/2025
Rangeland health reference sheet
Interpreting Indicators of Rangeland Health is a qualitative assessment protocol used to determine ecosystem condition based on benchmark characteristics described in the Reference Sheet. A suite of 17 (or more) indicators are typically considered in an assessment. The ecological site(s) representative of an assessment location must be known prior to applying the protocol and must be verified based on soils and climate. Current plant community cannot be used to identify the ecological site.
| Author(s)/participant(s) | |
|---|---|
| Contact for lead author | |
| Date | 03/24/2025 |
| Approved by | Matthew Duvall |
| Approval date | |
| Composition (Indicators 10 and 12) based on | Annual Production |
Indicators
-
Number and extent of rills:
-
Presence of water flow patterns:
-
Number and height of erosional pedestals or terracettes:
-
Bare ground from Ecological Site Description or other studies (rock, litter, lichen, moss, plant canopy are not bare ground):
-
Number of gullies and erosion associated with gullies:
-
Extent of wind scoured, blowouts and/or depositional areas:
-
Amount of litter movement (describe size and distance expected to travel):
-
Soil surface (top few mm) resistance to erosion (stability values are averages - most sites will show a range of values):
-
Soil surface structure and SOM content (include type of structure and A-horizon color and thickness):
-
Effect of community phase composition (relative proportion of different functional groups) and spatial distribution on infiltration and runoff:
-
Presence and thickness of compaction layer (usually none; describe soil profile features which may be mistaken for compaction on this site):
-
Functional/Structural Groups (list in order of descending dominance by above-ground annual-production or live foliar cover using symbols: >>, >, = to indicate much greater than, greater than, and equal to):
Dominant:
Sub-dominant:
Other:
Additional:
-
Amount of plant mortality and decadence (include which functional groups are expected to show mortality or decadence):
-
Average percent litter cover (%) and depth ( in):
-
Expected annual annual-production (this is TOTAL above-ground annual-production, not just forage annual-production):
-
Potential invasive (including noxious) species (native and non-native). List species which BOTH characterize degraded states and have the potential to become a dominant or co-dominant species on the ecological site if their future establishment and growth is not actively controlled by management interventions. Species that become dominant for only one to several years (e.g., short-term response to drought or wildfire) are not invasive plants. Note that unlike other indicators, we are describing what is NOT expected in the reference state for the ecological site:
-
Perennial plant reproductive capability:
Print Options
Sections
Font
Other
The Ecosystem Dynamics Interpretive Tool is an information system framework developed by the USDA-ARS Jornada Experimental Range, USDA Natural Resources Conservation Service, and New Mexico State University.
Click on box and path labels to scroll to the respective text.