Ecological dynamics
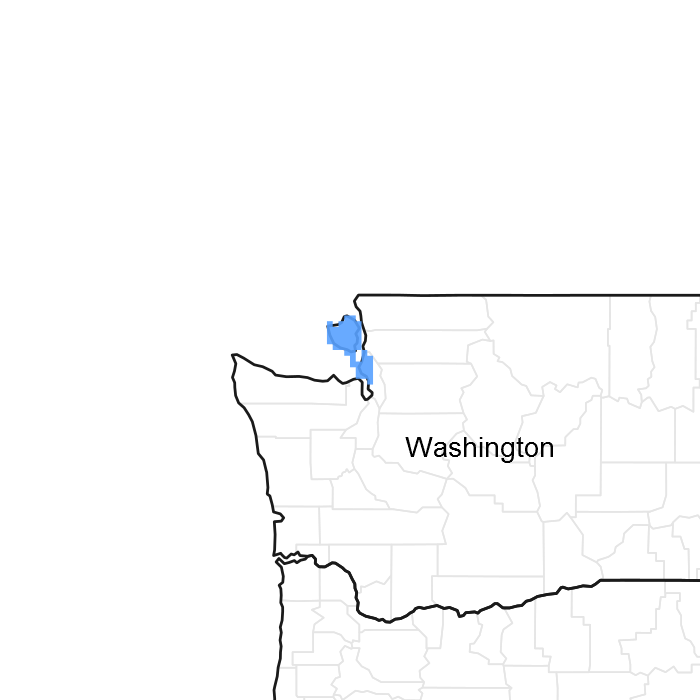
These sites are found within the rainshadow of the Puget Trough, situated mainly on south facing slopes and ridges. The majority of annual precipitation is received from October through to March. Temperatures are high in the summer and the soils generally have low moisture, making them some of the hottest and driest conifer sites in the region. Douglas-fir is the dominant tree species in the historic climax plant community. Pacific madrone will establish itself as a minor component in some instances but may be major component where disturbance has occurred and Douglas-fir has not regenerated successfully.
Natural disturbances such as fires and wind storms have played a role in the development of this site, as have human endeavors such as timber harvesting and conversion to cropland. The natural fire regime appears to be one of low to moderate intensity fires on a 30 to 100 year frequency.
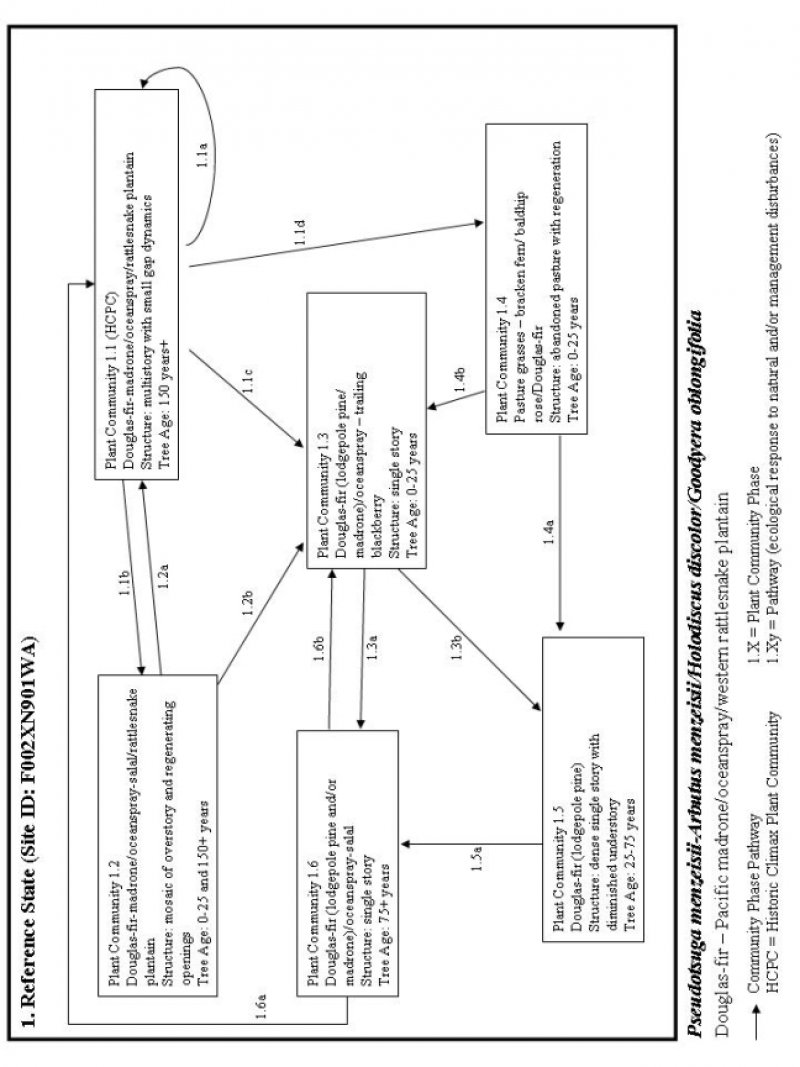
Community 1.1
Douglas-fir, Pacific Madrone, Oceanspray, and Western Rattlesnake Plantain
Structure: multistory with small gap dynamics.
Douglas-fir is the dominant tree species in the historic climax plant community. Pacific madrone will establish itself as a minor component in some instances but may occasionally be major component. As Douglas-fir ages it can withstand more serious fire intensities; additionally, following fire or other stresses, trees generally produce copious amounts of seed. This situation would allow the site to develop into one that contains several age classes of Douglas-fir. Pacific madrone, a thin barked species, will be top-killed by fire but can sprout prolifically from underground burls, provided it receives adequate sunlight. Madrone also favors mineral soil for seedling establishment, competing with coniferous seedlings. If Douglas-fir does not re-occupy the site quickly, Pacific madrone will take advantage of the disturbed mineral soil and become a major component of the community, as will oceanspray. If a seed source is present, lodgepole pine will also become established on these sites.
Forest overstory. Dominated by Douglas-fir with varying amounts of madrone (0-20%); lodgepole pine may be present (up to 30% on some locations); grand fir and western redcedar present in small numbers (<5%)
Forest understory. Shrub species dominate.
Community 1.2
Douglas-fir, Pacific Madrone, Lodgepole Pine, Oceanspray, and Western Rattlesnake Plantain
Structure: mosaic of mature overstory and regenerating openings. Community 1.2 retains some areas that resemble community 1.1 but also contains moderate sized (2-5 acres) areas of regeneration. Either moderate to intense fires, pockets of disease or uneven-aged management (group selection or shelterwood with reserves) can create this type of plant community. Depending on the seed sources that are present, the seedling/sapling patches may contain Douglas-fir, madrone and/or lodgepole pine as well as oceanspray, dwarf rose and dull Oregon-grape. Both harvesting and fire can spur the growth of madrone, which may temporarily dominate in the overstory because it will root-sprout prolifically after disturbance. Lodgepole can out-compete Douglas-fir in height growth early on but a mixed species stand will result if the seedling density isn’t too high. With no further management, some patches may be dominated by shrub species for many years, until their coverage gradually diminishes due to shading by the overstory.
Community 1.3
Oceanspray, Salal, Douglas-fir, Lodgepole Pine and/or Madrone
Structure: single story/shrub. Community 1.3 is forestland in regeneration; species composition depends on the natural seed sources present and the intensity of management. If the regeneration is planted, Douglas-fir would most likely be the species selected. Douglas-fir, lodgepole and madrone are the common tree species available for natural seeding while typical shrubs include oceanspray, trailing blackberry, dwarf rose and dull Oregon-grape.
Community 1.4
Orchardgrass, Bentgrass, Oceanspray, Dwarf Rose, and Douglas-fir
Structure: abandoned pasture with regeneration. Community 1.4 is abandoned crop or pasture land. It will typically include both native and nonnative grass species with shrubs and trees gradually encroaching from the edges. Over time, the shade intolerant species will diminish in cover as the overstory canopy closes.
Community 1.5
Stem Exclusion Douglas-fir and Lodgepole Pine
Structure: single story with diminished understory. Community 1.5 is the ‘stem exclusion’ phase of stand development. The overstory canopy has closed, leading to intense competition for sunlight and a diminished understory. These stands are typically very dense with minimal vertical differentiation. If not thinned, this community will begin to self-thin toward the end of this period.
Community 1.6
Maturing Forest Douglas-fir, Lodgepole Pine, Madrone, Oceanspray, Salal, and Western Rattlesnake Plantain
Structure: single story with scattered openings. Community 1.6 is a maturing forest. Although still having basically a single story appearance, the stand is starting to differentiate vertically. Some sunlight is reaching the forest floor, allowing for an increased understory of mainly shrub species. Cycling between PC 1.6 and PC 1.3, most likely through even- aged management, will generate optimal wood fiber production.
Pathway 1.1A
Community 1.1 to 1.2
This pathway represents a larger disturbance – moderate- to high-intensity fires or major wind storms would be the natural disruptive forces while a group selection or shelterwood (with reserves) harvest would represent the human-initiated community. Areas of regeneration would generally range from 2 to 5 acres in size.
Pathway 1.1B
Community 1.1 to 1.3
This is the pathway of a major disturbance, such as a stand-replacing fire or clear-cut, followed by prescribed fire, with the intention of regeneration.
Pathway 1.1C
Community 1.1 to 1.4
This pathway signifies the conversion of forested land to either cropland or pasture.
Pathway 1.2A
Community 1.2 to 1.1
this pathway indicates growth over time with no additional disturbances. The areas of regeneration pass through the typical stand phases – competitive exclusion, maturation, understory re-initiation – until they resemble the old-growth structure of the PC 1.1.
Pathway 1.2B
Community 1.2 to 1.3
This pathway represents intensive management, such as a change from uneven-aged management to even-aged management. Block harvest with a post-harvest burn leads to a plant community in the stand initiation stage. Site preparation and planting improved seedlings would lead to a single-species stand; no further management would lead to a mixed species stand dependent on natural seed sources.
Pathway 1.3B
Community 1.3 to 1.5
This is the pathway of no management, denoting only growth over time. Without active management it is possible that large areas will be dominated by various shrubs for many years until they are gradually shaded out by the overstory.
Pathway 1.3A
Community 1.3 to 1.6
This pathway represents growth over time in conjunction with active management.
Precommercial and/or commercial thinnings, combined with understory control, would lower stand density, decreasing competition between trees.
Pathway 1.4B
Community 1.4 to 1.3
This pathway indicates active management – restoring the pasture to forest through site preparation and tree planting.
Pathway 1.4A
Community 1.4 to 1.5
This pathway represents the gradual shift from open field to forest. Whatever seed source is present will, over time, fill in the pasture from the edges.
Pathway 1.5A
Community 1.5 to 1.6
This pathway includes growth over time, with or without thinning. If not thinned, mortality of intermediate and suppressed trees will occur.
Pathway 1.6A
Community 1.6 to 1.1
This is the pathway of no further management. Growth over time leads to continued vertical differentiation including occasional pockets of reproduction as well as increased shrubs and forbs.
Pathway 1.6B
Community 1.6 to 1.3
This pathway represents intensive management focusing on wood products. Clear-cutting, prescribed fire or other site preparation and tree planting are the steps to achieve this goal.


