
Natural Resources
Conservation Service
Ecological site R002XN713WA
Tidal Meadow
Last updated: 12/09/2024
Accessed: 02/10/2026
General information
Provisional. A provisional ecological site description has undergone quality control and quality assurance review. It contains a working state and transition model and enough information to identify the ecological site.

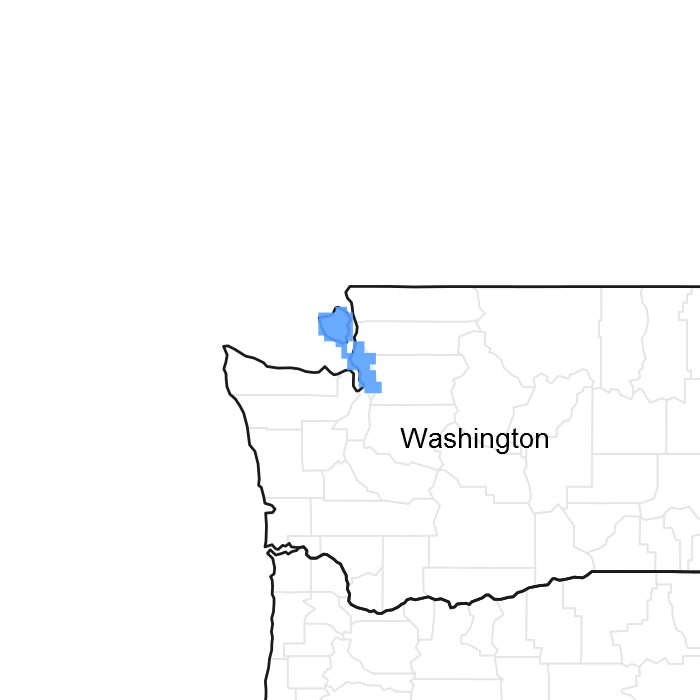
Figure 1. Mapped extent
Areas shown in blue indicate the maximum mapped extent of this ecological site. Other ecological sites likely occur within the highlighted areas. It is also possible for this ecological site to occur outside of highlighted areas if detailed soil survey has not been completed or recently updated.
MLRA notes
Major Land Resource Area (MLRA): 002X–Willamette and Puget Sound Valleys
Major Land Resource Area-[MLRA][LRU]: 002X N Willamette and Puget Sound Valleys, North Puget. The Land Resource Unit (LRU) is described in detail in the reference Washington NRCS Pasture TN-101 Forage Zones available on the eFOTG. For more information on MLRA’s, refer to the following web site: http://www.essc.psu.edu/soil_info/soil_lrr/. Additional information on Common Resource Areas is available on the eFOTG for NRCS Washington: http://efotg.nrcs.usda.gov/efotg_locator.aspx?map=WA and the following website: http://soils.usda.gov/survey/geography/cra.html. This ecological site occurs in the following Common Resource Areas: 2.10 - Fraser Lowland; 2.11 - Eastern Puget Riverine Lowlands; 2.11 - Eastern Puget Mountain River Valleys; 2.12 - San Juan Islands; 2.13 - Olympic Rainshadow; 2.5 - Eastern Puget Uplands; and 2.6 - Central Puget Lowland
Table 1. Dominant plant species
| Tree |
Not specified |
|---|---|
| Shrub |
Not specified |
| Herbaceous |
Not specified |
Physiographic features
Table 2. Representative physiographic features
| Landforms |
(1)
Tidal flat
(2) Depression (3) Estuary |
|---|---|
| Flooding duration | Very brief (4 to 48 hours) |
| Flooding frequency | Very frequent |
| Ponding frequency | None |
| Elevation | 10 ft |
| Slope | 5% |
| Ponding depth |
Not specified |
| Water table depth |
Not specified |
| Aspect | Aspect is not a significant factor |
Climatic features
The average annual precipitation ranges from 18 to 60 inches, although most areas range from 30 to 50 inches. Annual precipitation less than 30 inches occurs in the rainshadow of the Olympic Mountains along the western border of this area. Higher average annual precipitation, 50 to 60 inches, occurs next to the foothills of the surrounding mountains. Most of the precipitation occurs as low intensity, Pacific frontal storms (75%-fall and winter, 15%-spring.) Rain turns to snow at the higher elevations, although accumulations are usually small and of short duration. The number of days with snow on the ground varies from 0 to 9, with an averge of 3 days. Summers are cool and dry. Recorded temperature extremes range from -1 degrees to 107 degrees fahrenheit. See the climate tables in this document for information on temperatures and frost-free periods.
Table 3. Representative climatic features
| Frost-free period (average) | 243 days |
|---|---|
| Freeze-free period (average) | 302 days |
| Precipitation total (average) | 60 in |
Figure 2. Monthly precipitation range
Figure 3. Monthly average minimum and maximum temperature
Influencing water features
Soil features
The soils which support this native plant community typically occur adjacent to marine waters and are affected by daily high tides and salt-water intrusion. These soils characteristically are almost level and have an internal water table very close to the soil surface year around. Typical soil series are Endoaquents and Tacoma.
Table 4. Representative soil features
| Surface texture |
(1) Gravelly sand |
|---|---|
| Drainage class | Very poorly drained |
| Permeability class | Very rapid to moderate |
| Surface fragment cover <=3" | 15% |
| Surface fragment cover >3" | Not specified |
| Available water capacity (0-40in) |
0.4 – 23.6 in |
| Soil reaction (1:1 water) (0-40in) |
5.1 – 6.5 |
| Subsurface fragment volume <=3" (Depth not specified) |
36% |
| Subsurface fragment volume >3" (Depth not specified) |
Not specified |
Ecological dynamics
These ecological sites occur in areas which are cooler than the rest of the immediate Puget Trough area, because they occur on sites exposed to prevailing winds from across unprotected marine waters. Typical native plant species include Tufted Hairgrass (Deschampsia caespitosa), Red Fescue (Festuca rubra), Oregon Gumweed (Grindellia stricta), Douglas aster (Aster subspicatus), Fat Hen (Atriplex patula), Pacific silverweed (Potentilla pacifica), Saltgrass (Distichlis spicata), Seaside Arrowgrass (Triglochin maritimum), Lyngby sedge (Carex lyngbyei), Pickleweed (Salicornia virginica), and Seaside plantain (Plantago maritima).
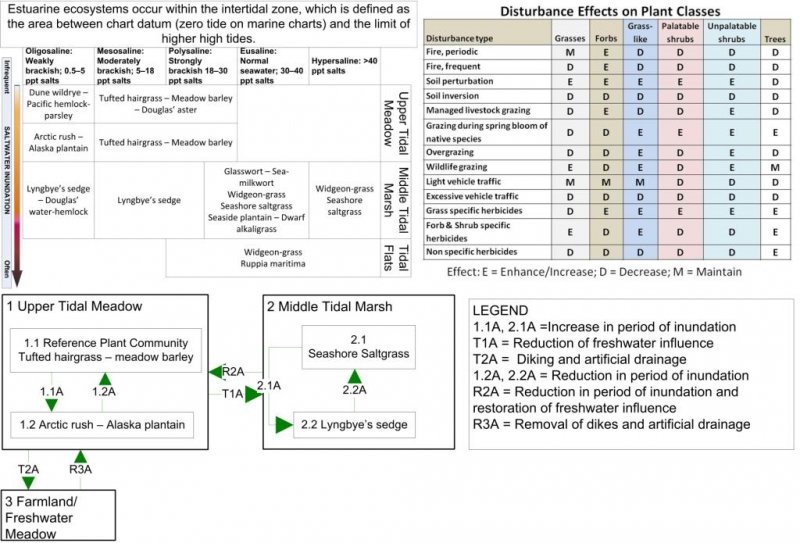
Some disturbance is natural in these plant communities, including: fire, both natural and human caused; soil perturbation resulting from causes such as small mammals, earthworms, root activity; freeze-thaw cycles; and harvest of bulbs and rhizomes; and wildlife grazing. . Disturbances can be reduced or eliminated through actions such as fire control, or cessation of activities such as mowing, soil disturbance, livestock grazing or vehicle access. If no disturbance occurs, this plan community will be invaded by shrub and tree species. Typical shrub and tree species include snowberry, rose, Douglas fire and lodgepole pine. Disturbance will affect the different plant classes in varying ways. Timing of disturbance will also affect shifts in plant communities. The Disturbance Effects on Plant Classes table summarizes some of these effects.
If nonnative species are present in the area, these will invade the site whether or not disturbance is maintained, increased, or eliminated. Their dominance in the community will be affected by the type and intensity of disturbance, as will the dominance of the different plant classes. If disturbance such as tillage, herbicide use, or intensive vehicle traffic eliminates the plant community, then a nonnative plant community will be established, either through planting, or invasion of introduced seral species.
Restoration – It’s possible to reestablish plant communities on suitable soils. Native species can be replanted and the site managed to maintain or increase the percentage cover of these species. The Disturbance Effects table lists appropriate types of disturbance to help establish the desired plant community. If nonnatives are present on the site, there will always be a presence in the community as these species are adapted to a wide range of soils, climates and disturbance regimes. However, the management of disturbance types can affect the balance of species on a site.
The State and Transition Diagram and community concepts are primarily derived from:
MacKenzie, W.H. and J.R. Moran. 2004. Wetlands of British Columbia: a guide to identification. Res. Br., B.C. Min. For., Victoria, B.C. Land Manage. Handb. No. 52.
State and transition model

More interactive model formats are also available.
View Interactive Models
More interactive model formats are also available.
View Interactive Models
Click on state and transition labels to scroll to the respective text
Ecosystem states
State 1 submodel, plant communities
State 2 submodel, plant communities
State 3 submodel, plant communities
State 1
Reference
The soils which support this native plant community typically occur adjacent to marine waters and are affected by extreme high tides and salt-water intrusion. This plant community occurs immediately adjacent to and higher in elevation than Middle Tidal Marsh plant community.
Community 1.1
Tufted Hairgrass and Meadow Barley

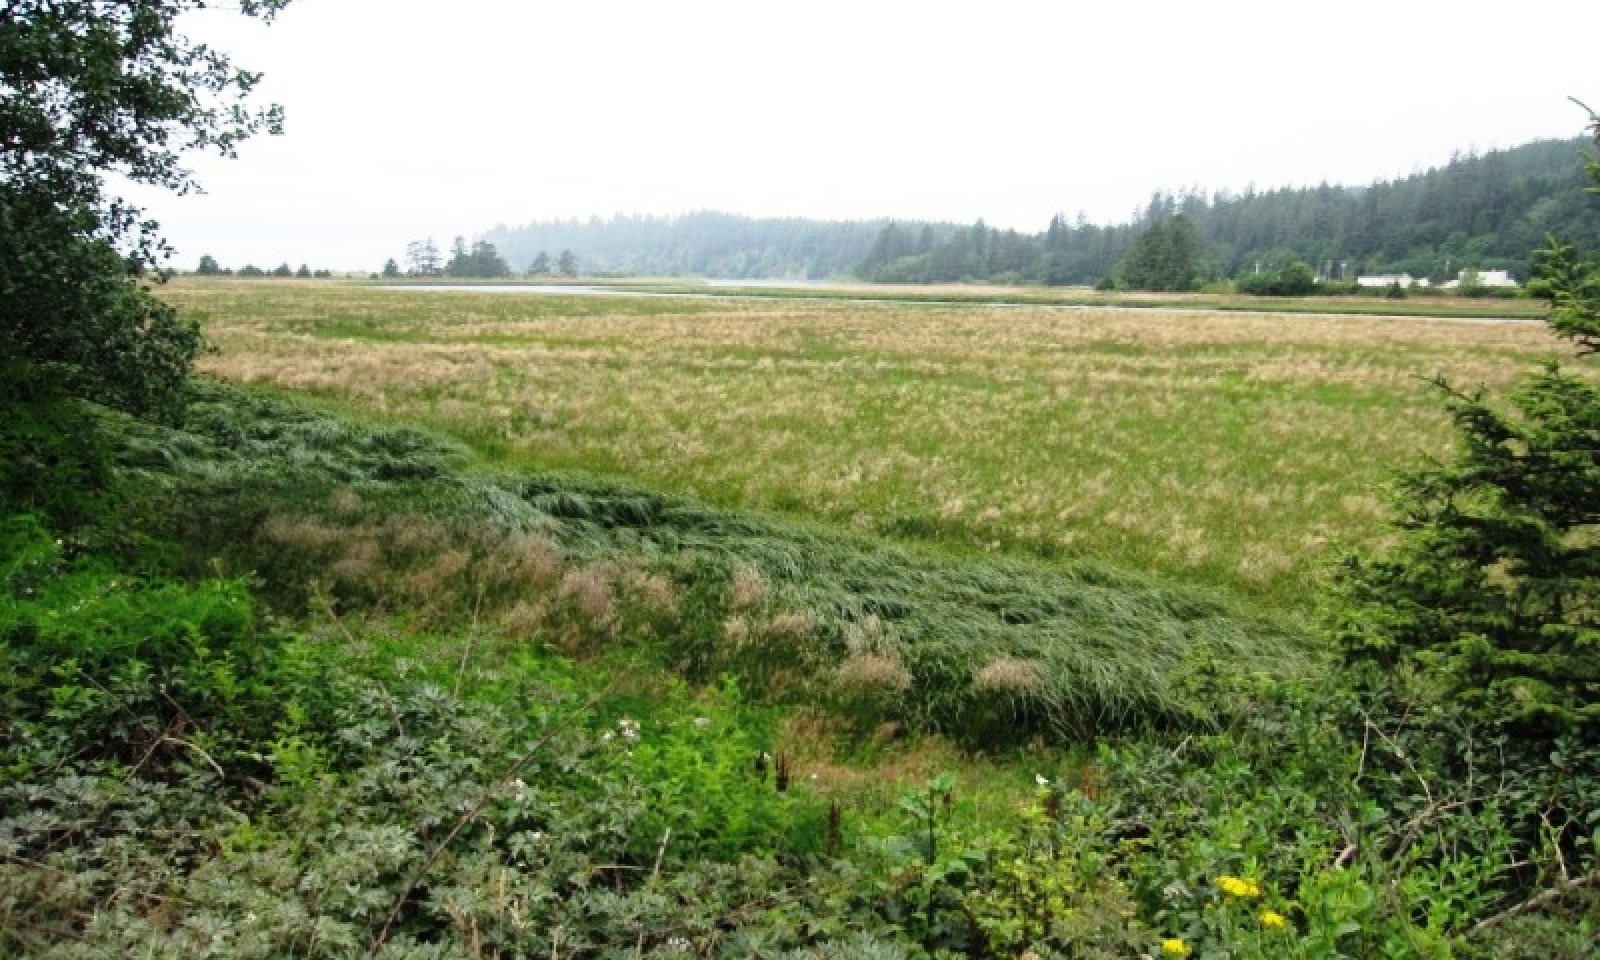
Figure 4. Backshore shrub community view of estuary
The Tufted hairgrass (Deschampsia cespitosa) – Douglas aster (Symphyotrichum subspicatu) plant community phase is widespread in estuaries. The Tufted hairgrass – Douglas aster plant community phase occurs in the Upper tidal meadow zone between the backshore shrub communities and the middle tidal marsh, usually in broad and extensive flats. With weakly brackish conditions and irregular inundation. This community is described as Estuarine Association ED02 in: MacKenzie, W.H. and J.R. Moran. 2004. Wetlands of British Columbia: a guide to identification. Res. Br., B.C. Min. For., Victoria, B.C. Land Manage. Handb. No. 52.
Figure 5. Annual production by plant type (representative values) or group (midpoint values)
Table 5. Annual production by plant type
| Plant type | Low (lb/acre) |
Representative value (lb/acre) |
High (lb/acre) |
|---|---|---|---|
| Grass/Grasslike | 1125 | 1500 | 1875 |
| Forb | 375 | 500 | 625 |
| Total | 1500 | 2000 | 2500 |
Figure 6. Plant community growth curve (percent production by month). WA0225, Winter Water Table. Winter water table within ~12" of soil surface for significant period between Nov 1 - April 1.
| Jan | Feb | Mar | Apr | May | Jun | Jul | Aug | Sep | Oct | Nov | Dec |
|---|---|---|---|---|---|---|---|---|---|---|---|
| J | F | M | A | M | J | J | A | S | O | N | D |
| 0 | 0 | 2 | 8 | 22 | 20 | 18 | 16 | 11 | 3 | 0 | 0 |
Community 1.2
Arctic Rush and Alaska Plantain
Pathway 1.1A
Community 1.1 to 1.2
Increase in period of inundation through processes such as soil subsidence through earthquakes, oxidation of organic matter, or erosion.
Pathway 1.2A
Community 1.2 to 1.1
Reduction in period of inundation through processes such as the accretion of sediment, either from fluvial or oceanic processes.
State 2
Middle Tidal Marsh
The soils which support this native plant community typically occur adjacent to marine waters and are affected by daily high tides and salt-water intrusion.
Community 2.1
Seashore Saltgrass
Community 2.2
Lyngbye's Sedge
Pathway 2.1A
Community 2.1 to 2.2
Increase in period of inundation through processes such as soil subsidence through earthquakes, oxidation of organic matter, or erosion.
Pathway 2.2A
Community 2.2 to 2.1
Reduction in period of inundation through processes such as the accretion of sediment, either from fluvial or oceanic processes.
State 3
Hydrologically Altered
Community 3.1
G002XN102WA or G002XN202WA Forage Suitability Group
Transition T1A
State 1 to 2
Increase in period of inundation through processes such as soil subsidence through earthquakes, oxidation of organic matter, or erosion.
Transition T2A
State 1 to 3
Diking and artificial drainage.
Restoration pathway R2A
State 2 to 1
Reduction in period of inundation and restoration of freshwater influence through processes such as accretion of sediment and decaying organic matter.
Restoration pathway R3A
State 3 to 1
Restoration through removal of dikes and artificial drainage.
Additional community tables
Table 6. Community 1.1 plant community composition
| Group | Common name | Symbol | Scientific name | Annual production (lb/acre) | Foliar cover (%) | |
|---|---|---|---|---|---|---|
|
Grass/Grasslike
|
||||||
| 1 | Perennial grasses | 0 | ||||
| tufted hairgrass | DECE | Deschampsia cespitosa | 0 | – | ||
| saltgrass | DISP | Distichlis spicata | 0 | – | ||
| red fescue | FERU2 | Festuca rubra | 0 | – | ||
| 2 | Grasslike | 0 | ||||
| Lyngbye's sedge | CALY3 | Carex lyngbyei | 0 | – | ||
| arctic rush | JUAR2 | Juncus arcticus | 0 | – | ||
|
Forb
|
||||||
| 3 | Perennial forbs | 0 | ||||
| Pacific silverweed | AREG | Argentina egedii | 0 | – | ||
| spear saltbush | ATPA4 | Atriplex patula | 0 | – | ||
| Oregon gumweed | GRST3 | Grindelia stricta | 0 | – | ||
| goose tongue | PLMA3 | Plantago maritima | 0 | – | ||
| Virginia glasswort | SADE10 | Salicornia depressa | 0 | – | ||
| Douglas aster | SYSU4 | Symphyotrichum subspicatum | 0 | – | ||
| seaside arrowgrass | TRMA20 | Triglochin maritima | 0 | – | ||
Interpretations
Supporting information
Contributors
Martha Chaney
Approval
Kirt Walstad, 12/09/2024
Rangeland health reference sheet
Interpreting Indicators of Rangeland Health is a qualitative assessment protocol used to determine ecosystem condition based on benchmark characteristics described in the Reference Sheet. A suite of 17 (or more) indicators are typically considered in an assessment. The ecological site(s) representative of an assessment location must be known prior to applying the protocol and must be verified based on soils and climate. Current plant community cannot be used to identify the ecological site.
| Author(s)/participant(s) | |
|---|---|
| Contact for lead author | |
| Date | 11/27/2024 |
| Approved by | Kirt Walstad |
| Approval date | |
| Composition (Indicators 10 and 12) based on | Annual Production |
Indicators
-
Number and extent of rills:
-
Presence of water flow patterns:
-
Number and height of erosional pedestals or terracettes:
-
Bare ground from Ecological Site Description or other studies (rock, litter, lichen, moss, plant canopy are not bare ground):
-
Number of gullies and erosion associated with gullies:
-
Extent of wind scoured, blowouts and/or depositional areas:
-
Amount of litter movement (describe size and distance expected to travel):
-
Soil surface (top few mm) resistance to erosion (stability values are averages - most sites will show a range of values):
-
Soil surface structure and SOM content (include type of structure and A-horizon color and thickness):
-
Effect of community phase composition (relative proportion of different functional groups) and spatial distribution on infiltration and runoff:
-
Presence and thickness of compaction layer (usually none; describe soil profile features which may be mistaken for compaction on this site):
-
Functional/Structural Groups (list in order of descending dominance by above-ground annual-production or live foliar cover using symbols: >>, >, = to indicate much greater than, greater than, and equal to):
Dominant:
Sub-dominant:
Other:
Additional:
-
Amount of plant mortality and decadence (include which functional groups are expected to show mortality or decadence):
-
Average percent litter cover (%) and depth ( in):
-
Expected annual annual-production (this is TOTAL above-ground annual-production, not just forage annual-production):
-
Potential invasive (including noxious) species (native and non-native). List species which BOTH characterize degraded states and have the potential to become a dominant or co-dominant species on the ecological site if their future establishment and growth is not actively controlled by management interventions. Species that become dominant for only one to several years (e.g., short-term response to drought or wildfire) are not invasive plants. Note that unlike other indicators, we are describing what is NOT expected in the reference state for the ecological site:
-
Perennial plant reproductive capability:
Print Options
Sections
Font
Other
The Ecosystem Dynamics Interpretive Tool is an information system framework developed by the USDA-ARS Jornada Experimental Range, USDA Natural Resources Conservation Service, and New Mexico State University.
Click on box and path labels to scroll to the respective text.