
Natural Resources
Conservation Service
Ecological site R003XN613WA
Low Mountain Unforested Wetlands
Last updated: 1/29/2025
Accessed: 02/07/2026
General information
Provisional. A provisional ecological site description has undergone quality control and quality assurance review. It contains a working state and transition model and enough information to identify the ecological site.

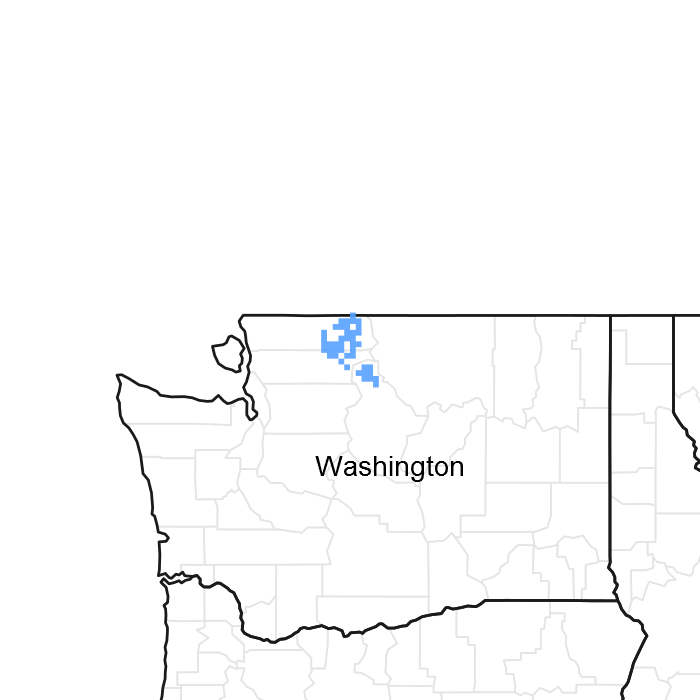
Figure 1. Mapped extent
Areas shown in blue indicate the maximum mapped extent of this ecological site. Other ecological sites likely occur within the highlighted areas. It is also possible for this ecological site to occur outside of highlighted areas if detailed soil survey has not been completed or recently updated.
Classification relationships
This ecological site may be related to the National Park Service North Pacific Lowland Bog & Poor Fen Group.
Associated sites
| F003XN921WA |
Frigid/Udic Coniferous Can be found in a complex with R003XN613WA. |
|---|
Similar sites
| R003XN613WA |
Low Mountain Unforested Wetlands Very similar dynamics but found at higher elevations. |
|---|
Table 1. Dominant plant species
| Tree |
Not specified |
|---|---|
| Shrub |
Not specified |
| Herbaceous |
Not specified |
Physiographic features
This native plant community is generally found in depressions and flat or gently sloping landscape positions at lower elevations of the North Cascades. This site occupies the frigid/aquic soil temperature/moisture regime and are typically wet sites with very low-velocity surface and subsurface flows. This site may also occur on sub-irrigated sites with slopes up to 15%.
This ecological site has only been mapped within the boundary of the North Cascades National Park Complex.
Table 2. Representative physiographic features
| Landforms |
(1)
Flood plain
(2) Depression (3) Terrace |
|---|---|
| Flooding duration | Very brief (4 to 48 hours) to brief (2 to 7 days) |
| Flooding frequency | None to occasional |
| Ponding duration | Brief (2 to 7 days) to long (7 to 30 days) |
| Ponding frequency | None to frequent |
| Elevation | 800 – 2,100 ft |
| Slope | 15% |
| Ponding depth | 4 in |
| Water table depth | 24 in |
| Aspect | Aspect is not a significant factor |
Climatic features
This ecological site receives most of its annual precipitation from October to April in the form of rain and snow that will commonly persist into spring. The mean annual precipitation ranges from 70 to 90 inches (1750 to 2300 mm) and the mean annual temperature ranges from 41 to 47 degrees Fahrenheit (5 to 8 degrees C). Generally this site occupies areas with warm dry summers and cold wet winters.
Precipitation and temperature data in the tables below was extracted from: PRISM Climate Group, Oregon State University, http://prism.oregonstate.edu, created February 2004. Information from the Ross Dam weather station was used by the PRISM Climate Group to generate climate data for the North Cascades region.
Table 3. Representative climatic features
| Frost-free period (average) | 90 days |
|---|---|
| Freeze-free period (average) | 120 days |
| Precipitation total (average) | 85 in |
Figure 2. Monthly precipitation range
Figure 3. Monthly average minimum and maximum temperature
Influencing water features
These general kinds of bog and fen wetlands are distinguished by pH, nutrient availability and hydrologic dynamics. Fens have groundwater within the rooting zone of vascular plants, while bogs have built up peat above the influence of groundwater. The vegetation in true bogs is limited by the water available from precipitation and are only found in areas of high precipitation. This site supports vegetation that tolerates occasional flooding of the site and periodic saturation within the soil profile. As such, seasonally high water tables are common and soils typically display some evidence of anaerobic conditions (redoximorphic features) and periodic flooding by nearby streams.
Soil features
Applicable Soils: Manlywham
The soils that support this native plant community occur in the frigid soil temperature regime and aquic soil moisture regime. These soils are very poorly drained and soil depth is very deep. Generally these soils have a mantle of decomposing organic material overlying alluvium. Under seasonally high water tables, decomposition rates for the organic material are slowed considerably, allowing for an accumulation of these materials over time. Soils show typical hydric soil characteristics, including high organic content and/or low chroma and redoximorphic features. The Manlywham soil series is an Inceptisol with varying thicknesses of decomposing organic material at the surface.
Table 4. Representative soil features
| Surface texture |
(1) Mucky fine sandy loam (2) Mucky loam |
|---|---|
| Family particle size |
(1) Loamy |
| Drainage class | Very poorly drained |
| Permeability class | Moderately rapid to very rapid |
| Soil depth | 60 in |
| Surface fragment cover <=3" | 5% |
| Surface fragment cover >3" | 5% |
| Available water capacity (0-40in) |
1.75 – 4.1 in |
| Soil reaction (1:1 water) (0-40in) |
4.5 – 6.5 |
| Subsurface fragment volume <=3" (Depth not specified) |
5 – 35% |
| Subsurface fragment volume >3" (Depth not specified) |
5 – 15% |
Ecological dynamics
This ecological site is a complex of wetlands that includebogs and fens, emergent graminoid marshes that transition to shrubby and forested swamps in areas of suitable depressional (basins) topography. Some of the specific communities will also be found in the floodplain systems where more extensive bottomlands remain. These wetland plant communities are mostly semi-permanently flooded, but some have seasonal hydrologic flooding. Water is at or above the surface for most of the growing season. The type of community is tied to a specific water regime and particular soil characteristics. Riparian groups are in typically well-drained areas with overbank flooding, groundwater discharge or high water tables associated with flowing water.
State and transition model

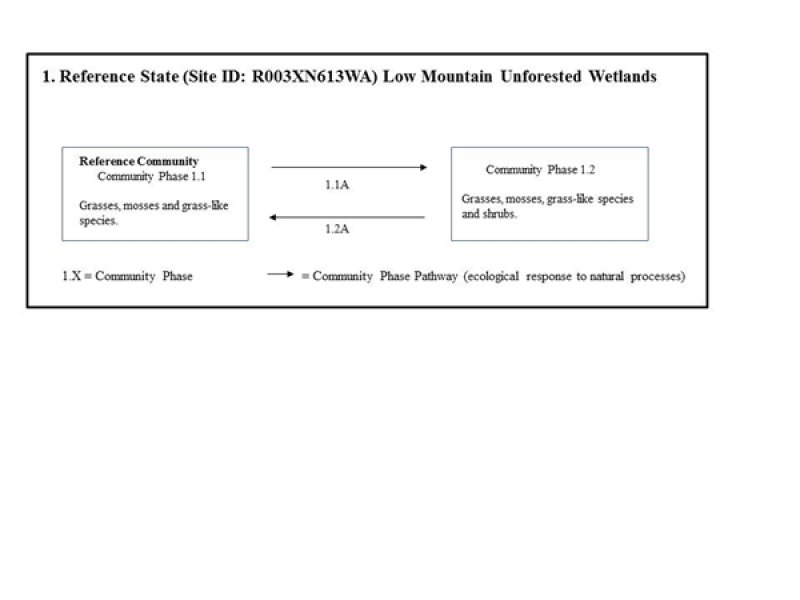
Figure 4. State and Transition Model
More interactive model formats are also available.
View Interactive Models
More interactive model formats are also available.
View Interactive Models
Click on state and transition labels to scroll to the respective text
Ecosystem states
State 1 submodel, plant communities
State 1
Reference
Community 1.1
Grasses, Mosses, Sedges, and Rushes

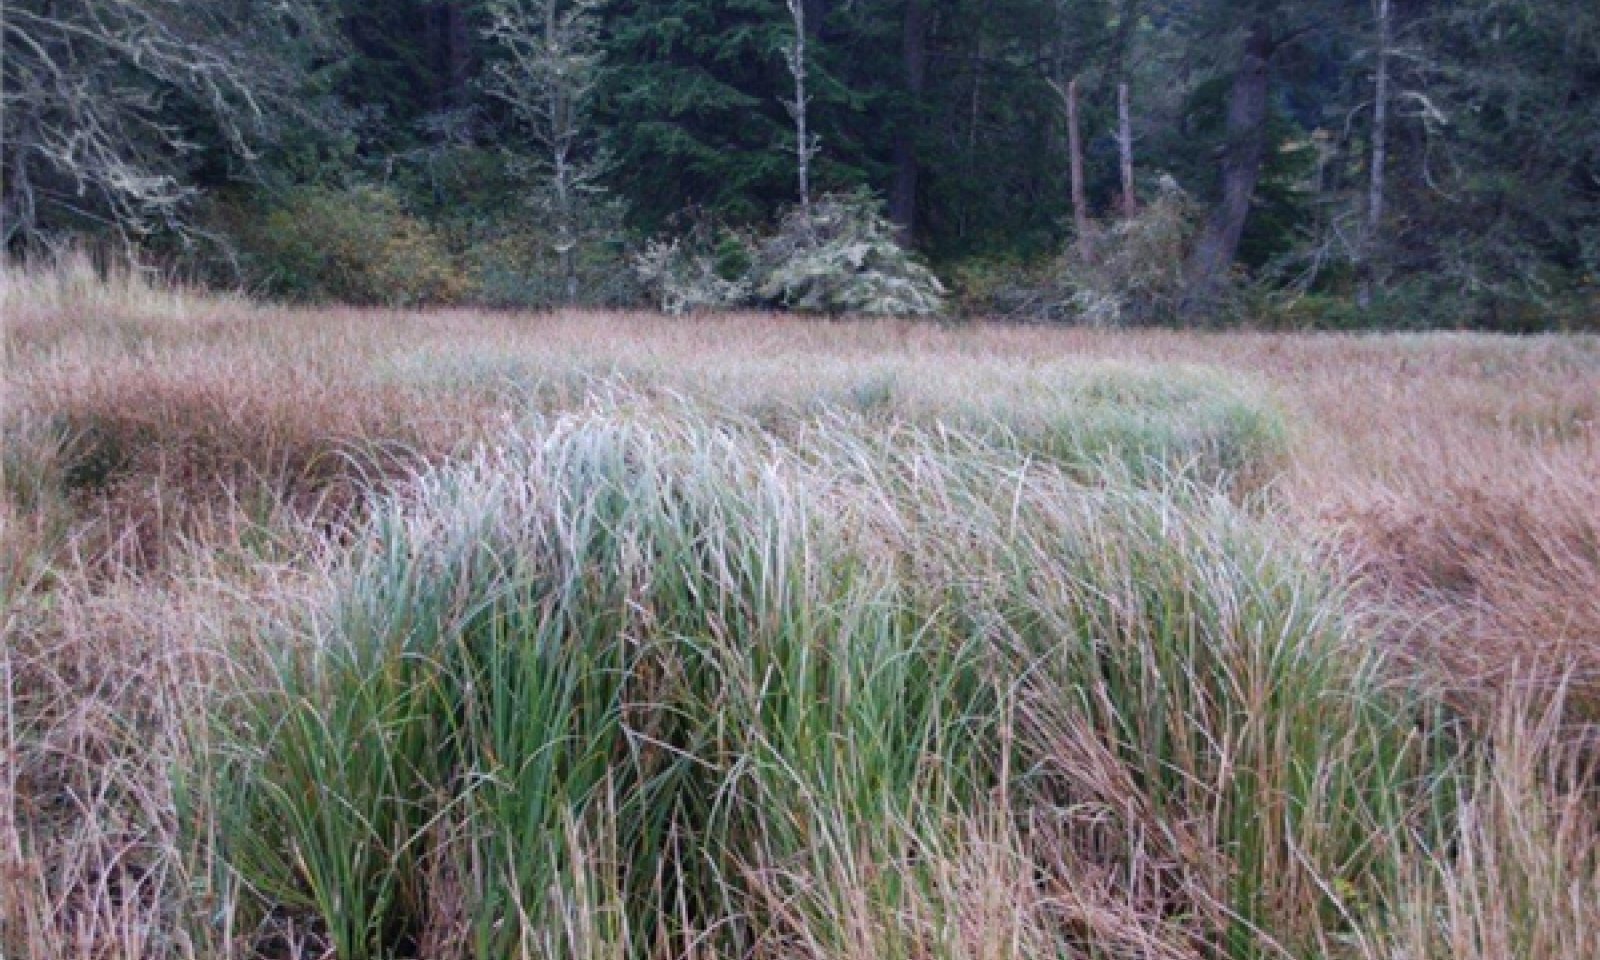
Figure 5. Reference Community
The Reference Community phase is characterized by a water table present during the growing season near or above the soil surface, although better-drained hummocks can occur in the site. Vegetation is characterized by a predominance of grass-like plants, grasses, forbs and moss. Species present and their percent cover in any particular part of the wetland complex are primarily controlled by the proximity of the water table to the soil surface during the growing season. The water table is maintained by either depressional topography, natural blockages to drainage such as landslide or other debris, beaver dams, or periodic fires which reduce the amount of undecomposed organic matter on the soil surface. The edges of the wetland are typically slightly higher in elevation, and these areas, in combination with any hummocks, typically support species that need better drainage, especially shrubs.
Figure 6. Annual production by plant type (representative values) or group (midpoint values)
Table 5. Ground cover
| Tree foliar cover | 0% |
|---|---|
| Shrub/vine/liana foliar cover | 2-10% |
| Grass/grasslike foliar cover | 40-100% |
| Forb foliar cover | 5-40% |
| Non-vascular plants | 5-40% |
| Biological crusts | 0% |
| Litter | 5-25% |
| Surface fragments >0.25" and <=3" | 0-5% |
| Surface fragments >3" | 0-5% |
| Bedrock | 0% |
| Water | 0-20% |
| Bare ground | 0-5% |
Community 1.2
Grasses, Mosses, Grass-likes, and Shrubs.

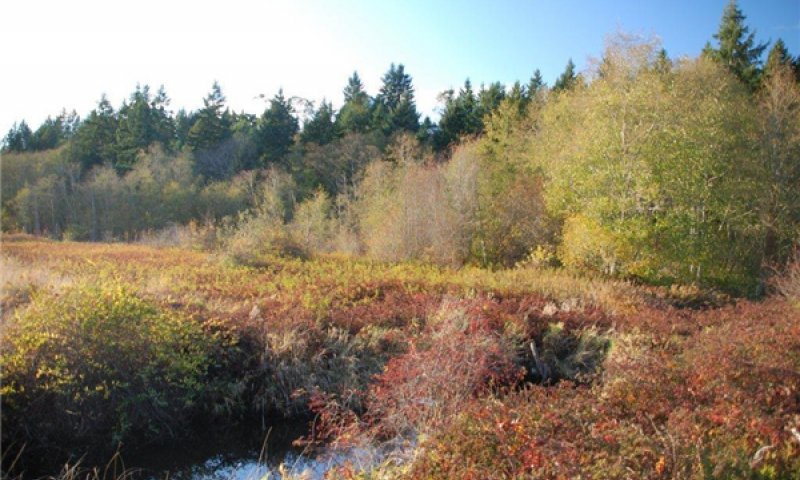
Figure 7. Community phase 1.2 - grasses, mosses, grass-like
Like the Reference Community, this community phase also supports predominantly grass-like plants, grasses, forbs and moss, However, the water table during the growing season is typically near to below the soil surface, allowing species which require better drainage conditions to establish in the site. This slightly lowered water table can result from a buildup of organic matter on the surface into which plants can root, or erosion of materials which hold water on the site, such as beaver dams or landslide or other debris. Control of fire will also promote development of this community. Common plants present on the site include many shrubs and less water-tolerant herbaceous species.
Pathway 1.1A
Community 1.1 to 1.2


This pathway may be caused one of two ways: 1) a lack of the natural fire regime which allows surface layers of undecomposed organic matter and moss to build up allowing for the establishment of a shrub community; or 2) an increase in the depth to water table due to a physical event such as the erosion of a natural impoundment structure.
Pathway 1.2A
Community 1.2 to 1.1


This pathway may be caused one of two ways: 1) a resumption of the natural fire regime which will reduce shrub cover and may burn surface layers of organic matter; or 2) a decrease in the depth to water table due to a physical event such as a landslide or a biotic event such as beaver activity.
Additional community tables
Table 6. Community 1.1 plant community composition
| Group | Common name | Symbol | Scientific name | Annual production (lb/acre) | Foliar cover (%) | |
|---|---|---|---|---|---|---|
|
Grass/Grasslike
|
||||||
| 1 | 0 | |||||
| field horsetail | EQAR | Equisetum arvense | 0 | 0 | ||
| fowl mannagrass | GLST | Glyceria striata | 0 | 0 | ||
| rush | JUNCU | Juncus | 0 | 0 | ||
| bulrush | SCHOE6 | Schoenoplectus | 0 | 0 | ||
| bulrush | SCIRP | Scirpus | 0 | 0 | ||
| panicled bulrush | SCMI2 | Scirpus microcarpus | 0 | 0 | ||
| bur-reed | SPARG | Sparganium | 0 | 0 | ||
| water sedge | CAAQ | Carex aquatilis | 0 | 0 | ||
| slenderbeak sedge | CAAT3 | Carex athrostachya | 0 | 0 | ||
| sedge | CAREX | Carex | 0 | 0 | ||
| tufted hairgrass | DECE | Deschampsia cespitosa | 0 | 0 | ||
| spikerush | ELEOC | Eleocharis | 0 | 0 | ||
|
Forb
|
||||||
| 2 | 0 | |||||
| aster | ASTER | Aster | 0 | 0 | ||
| deer fern | BLSP | Blechnum spicant | 0 | 0 | ||
| water horsetail | EQFL | Equisetum fluviatile | 0 | 0 | ||
| American skunkcabbage | LYAM3 | Lysichiton americanus | 0 | 0 | ||
| water parsely | OESA | Oenanthe sarmentosa | 0 | 0 | ||
| broadleaf cattail | TYLA | Typha latifolia | 0 | 0 | ||
|
Shrub/Vine
|
||||||
| 3 | 0 | |||||
| alpine laurel | KAMI | Kalmia microphylla | 0 | 0 | ||
| bog Labrador tea | LEGR | Ledum groenlandicum | 0 | 0 | ||
| salmonberry | RUSP | Rubus spectabilis | 0 | 0 | ||
| western mountain ash | SOSI2 | Sorbus sitchensis | 0 | 0 | ||
| small cranberry | VAOX | Vaccinium oxycoccos | 0 | 0 | ||
Interpretations
Supporting information
Inventory data references
Type Locality Plot ID: 09-PHR-017
Type locality
| Location 1: Whatcom County, WA | |
|---|---|
| Township/Range/Section | T38N R13E S10 |
| UTM zone | N |
| UTM northing | 5406832.77 |
| UTM easting | 639111.22 |
| Latitude | 48° 47′ 56″ |
| Longitude | 121° 6′ 20″ |
Other references
Billings, W.D. 1973. Arctic and Alpine Vegetations: Similarities, Differences, and Susceptibility to Disturbance. BioScience, Vol. 23, No. 12 (Dec., 1973), pp. 697-704.
Billings, W.D. 1987. Constraints to Plant Growth, Reproduction, and Establishment in Arctic Environments. Arctic and Alpine Research, Vol. 19, No. 4, Restoration and Vegetation Succession in Circumpolar Lands: Seventh Conference of the Comité Arctique International (Nov., 1987), pp.357-365
Billings, W.D. and Bliss L.C. 1959. An Alpine Snowbank Environment and Its Effects on Vegetation, Plant Development, and Productivity. Ecology, Vol. 40, No. 3 (Jul., 1959), pp. 388-397.
Canaday, B.B. and Fonda, R.W. 1974. The Influence of Subalpine Snowbanks on Vegetation Pattern, Production, and Phenology. Bulletin of the Torrey Botanical Club, Vol. 101, No. 6 (Nov. - Dec., 1974), pp. 340-350
Crawford, R. C., C. B. Chappell, C. C. Thompson, and F. J. Rocchio. 2009. Vegetation classification of Mount Rainier, North Cascades, and Olympic National Parks. Natural Resource Technical Report NPS/NCCN/NRTR—2009/211. National Park Service, Fort Collins, Colorado. 58 pages.
Douglas, G.W. and Bliss L.C. 1977. Alpine and High Subalpine Plant Communities of the North Cascades Range, Washington and British Columbia. Ecological Monographs, Vol. 47, No. 2 (Spring, 1977), pp. 113-150.
Kuramoto, R.T. and Bliss L.C. 1970. Ecology of Subalpine Meadows in the Olympic Mountains, Washington. Ecological Monographs, Vol. 40, No. 3 (Summer, 1970), pp. 317-347.
Contributors
Martha Chaney
Marty Chaney
Approval
Kirt Walstad, 1/29/2025
Rangeland health reference sheet
Interpreting Indicators of Rangeland Health is a qualitative assessment protocol used to determine ecosystem condition based on benchmark characteristics described in the Reference Sheet. A suite of 17 (or more) indicators are typically considered in an assessment. The ecological site(s) representative of an assessment location must be known prior to applying the protocol and must be verified based on soils and climate. Current plant community cannot be used to identify the ecological site.
| Author(s)/participant(s) | |
|---|---|
| Contact for lead author | |
| Date | 01/29/2025 |
| Approved by | Kirt Walstad |
| Approval date | |
| Composition (Indicators 10 and 12) based on | Annual Production |
Indicators
-
Number and extent of rills:
-
Presence of water flow patterns:
-
Number and height of erosional pedestals or terracettes:
-
Bare ground from Ecological Site Description or other studies (rock, litter, lichen, moss, plant canopy are not bare ground):
-
Number of gullies and erosion associated with gullies:
-
Extent of wind scoured, blowouts and/or depositional areas:
-
Amount of litter movement (describe size and distance expected to travel):
-
Soil surface (top few mm) resistance to erosion (stability values are averages - most sites will show a range of values):
-
Soil surface structure and SOM content (include type of structure and A-horizon color and thickness):
-
Effect of community phase composition (relative proportion of different functional groups) and spatial distribution on infiltration and runoff:
-
Presence and thickness of compaction layer (usually none; describe soil profile features which may be mistaken for compaction on this site):
-
Functional/Structural Groups (list in order of descending dominance by above-ground annual-production or live foliar cover using symbols: >>, >, = to indicate much greater than, greater than, and equal to):
Dominant:
Sub-dominant:
Other:
Additional:
-
Amount of plant mortality and decadence (include which functional groups are expected to show mortality or decadence):
-
Average percent litter cover (%) and depth ( in):
-
Expected annual annual-production (this is TOTAL above-ground annual-production, not just forage annual-production):
-
Potential invasive (including noxious) species (native and non-native). List species which BOTH characterize degraded states and have the potential to become a dominant or co-dominant species on the ecological site if their future establishment and growth is not actively controlled by management interventions. Species that become dominant for only one to several years (e.g., short-term response to drought or wildfire) are not invasive plants. Note that unlike other indicators, we are describing what is NOT expected in the reference state for the ecological site:
-
Perennial plant reproductive capability:
Print Options
Sections
Font
Other
The Ecosystem Dynamics Interpretive Tool is an information system framework developed by the USDA-ARS Jornada Experimental Range, USDA Natural Resources Conservation Service, and New Mexico State University.
Click on box and path labels to scroll to the respective text.