Natural Resources
Conservation Service
Ecological site R030XA101AZ
Basalt Hills 3-6" p.z.
Accessed: 04/25/2024
General information
Provisional. A provisional ecological site description has undergone quality control and quality assurance review. It contains a working state and transition model and enough information to identify the ecological site.
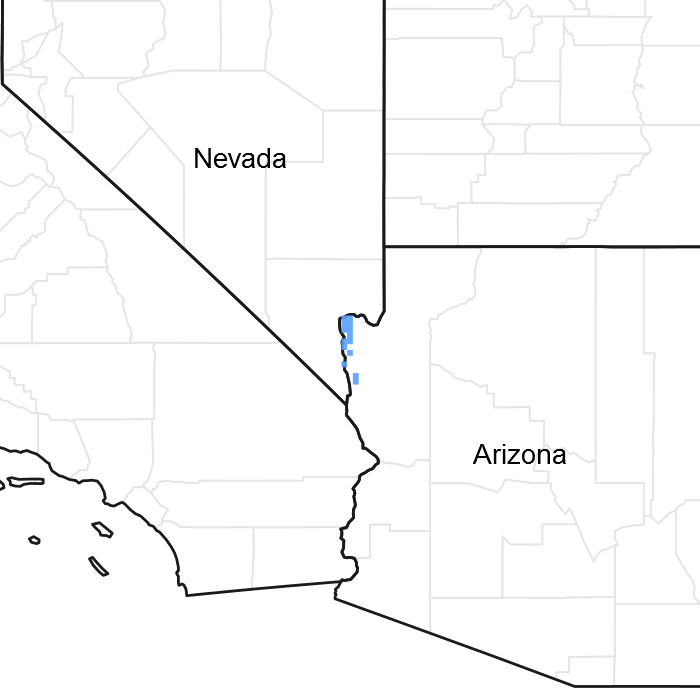
Figure 1. Mapped extent
Areas shown in blue indicate the maximum mapped extent of this ecological site. Other ecological sites likely occur within the highlighted areas. It is also possible for this ecological site to occur outside of highlighted areas if detailed soil survey has not been completed or recently updated.
MLRA notes
Major Land Resource Area (MLRA): 030X–Mojave Basin and Range
AZ CRA 30.1 – Lower Mohave Desert
Elevations range from 400 to 2500 feet and precipitation averages 3 to 6 inches per year. Vegetation includes creosotebush, white bursage, Mormon tea, and brittlebush. The soil temperature regime is hyperthermic and the soil moisture regime is typic aridic. This unit occurs within the Basin and Range Province and is characterized by broad basins, valleys, and old lakebeds. Widely spaced mountains trending north to south occur throughout the area. Isolated, short mountain ranges are separated by an aggraded desert plain. The mountains are fault blocks that have been tilted up. Long alluvial fans coalesce with dry lakebeds between some of the ranges.
Table 1. Dominant plant species
Tree |
Not specified |
---|---|
Shrub |
(1) Encelia |
Herbaceous |
Not specified |
Physiographic features
This site occurs in an upland position. It does not benefit significantly from run-in moisture from adjacent areas. It suffers from excessive loss from runoff. This ecological site is found on all aspects.
Table 2. Representative physiographic features
Landforms |
(1)
Hill
(2) Mountain |
---|---|
Flooding frequency | None |
Ponding frequency | None |
Elevation | 800 – 1,700 ft |
Slope | 15 – 70% |
Climatic features
The 30-1AZ Lower Mohave Desert Shrub land resource unit is characterized by a hot, dry climate. The average annual rainfall is 3 to 6 inches, but it can be extremely variable (e.g. from 0 to 11 inches). There can be long periods when little or no precipitation is received. Most of the precipitation for the year could arrive in just a couple of storms. The soil moisture regime is typic aridic and the soil temperature regime is hyperthermic. Winter precipitation from November through April occurs as gentle rains from storms coming out of the Pacific Ocean. Snow is very rare and only falls in the highest mountains. A seasonal drought occurs in May and June. Summer/fall precipitation from July through October comes from spotty, unreliable, and sometimes violent thunderstorms. The moisture originates in the Gulf of Mexico (and the Pacific Ocean in the fall) and flows into the state on the north end of the Mexican monsoon. Strong winds are common, especially during the spring.
Table 3. Representative climatic features
Frost-free period (average) | 325 days |
---|---|
Freeze-free period (average) | 365 days |
Precipitation total (average) | 6 in |
Figure 2. Monthly average minimum and maximum temperature
Influencing water features
There are no water features associated with this site.
Soil features
The soils characterizing this site are shallow to bedrock. The soil surface is often covered with basalt cobbles and gravels. The surface soil has a minimum depth of 2-4 inches and ranges in texture from very gravelly loam to very gravelly clay loam. The subsoil and underlying layers have permeabilities ranging from moderate to moderately slow. This site can not absorb and hold all the moisture that climate supplies. Soluble salt accumulatations are low and pH ranges from 7.9-8.4. The soil surface is only slightly effervescent, but becomes strongly to violently effervescent within a few inches of the soil surface. With good vegetative cover, infiltration rates are low. Stability against erosion processes is poor and plant-soil moisture relationships are less than average. Coarse fragments average 60-70% of the total soil volume.
A typical soil profile is:
A-0 to 2 inches; very gravelly loam; 80 percent basalt cobble and gravel; non to slightly effervescent
Bt1-2 to 4 inches; gravelly sandy clay loam; 20 percent basalt gravel; slightly to strongly effervescent
Bt2-4 to 8 inches clay loam; 10 percent basal gravel; slightly to violently effervescent
Bt3-8 to 13 inches; extremely gravelly sandy clay loam; 65 percent basalt gravel; strongly to violently effervescent
2R-13 inches; bedrock
Table 4. Representative soil features
Surface texture |
(1) Very gravelly loam (2) Clay loam |
---|---|
Family particle size |
(1) Loamy |
Soil depth | 7 – 20 in |
Surface fragment cover <=3" | 40 – 80% |
Surface fragment cover >3" | 60% |
Soil reaction (1:1 water) (0-40in) |
7.9 – 8.4 |
Subsurface fragment volume <=3" (Depth not specified) |
35 – 80% |
Ecological dynamics
The plant communities found on an ecological site are naturally variable. Composition and production will vary with yearly conditions, location, aspect, and the natural variability of the soils. The historical climax plant community represents the natural potential plant communities found on relict or relatively undisturbed sites. Other plant communities described here represent plant communities that are known to occur when the site is disturbed by factors such as grazing, fire, or drought.
Production data provided in this site description is standardized to air-dry weight at the end of the summer growing season. The plant communities described in this site description are based on near normal rainfall years.
NRCS uses a Similarity Index to compare existing plant communities to the plant communities described here. Similarity Index is determined by comparing the production and composition of a plant community to the production and composition of a plant community described in this site description. To determine Similarity Index, compare the production (air-dry weight) of each species to that shown in the plant community description. For each species, count no more than the maximum amount shown for the species, and for each group, count no more than the maximum shown for the group. Divide the resulting total by the total normal year production shown in the plant community description. If rainfall has been significantly above or below normal, use the total production shown for above or below normal years. If field data is not collected at the end of the summer growing season, then the field data must be corrected to the end of the year production before comparing it to the site description. The growth curve can be used as a guide for estimating production at the end of the summer growing season.
State and transition model
More interactive model formats are also available.
View Interactive Models
More interactive model formats are also available.
View Interactive Models
Click on state and transition labels to scroll to the respective text
Ecosystem states
State 1 submodel, plant communities
State 1
Historic Climax Plant Community
Community 1.1
Historic Climax Plant Community
The plant community found on this ecologcal site is composed primarily of shrubs, and scattered perennial grasses and forbs. Native annuals become abundant, generally in late winter and spring in years of normal to above-normal precipitation.
Figure 3. Annual production by plant type (representative values) or group (midpoint values)
Table 5. Annual production by plant type
Plant type | Low (lb/acre) |
Representative value (lb/acre) |
High (lb/acre) |
---|---|---|---|
Shrub/Vine | 150 | 160 | 170 |
Forb | 10 | 20 | 40 |
Grass/Grasslike | 10 | 20 | 30 |
Total | 170 | 200 | 240 |
Figure 4. Plant community growth curve (percent production by month). AZ3011, 30.1 3-6" p.z. all sites. Growth begins in late winter, most growth occurs in the spring..
Jan | Feb | Mar | Apr | May | Jun | Jul | Aug | Sep | Oct | Nov | Dec |
---|---|---|---|---|---|---|---|---|---|---|---|
J | F | M | A | M | J | J | A | S | O | N | D |
0 | 7 | 30 | 32 | 13 | 7 | 3 | 5 | 2 | 1 | 0 | 0 |
Additional community tables
Table 6. Community 1.1 plant community composition
Group | Common name | Symbol | Scientific name | Annual production (lb/acre) | Foliar cover (%) | |
---|---|---|---|---|---|---|
Grass/Grasslike
|
||||||
1 | 10 | |||||
Parish's threeawn | ARPUP5 | Aristida purpurea var. parishii | 0–5 | – | ||
bush muhly | MUPO2 | Muhlenbergia porteri | 0–5 | – | ||
tobosagrass | PLMU3 | Pleuraphis mutica | 0–5 | – | ||
big galleta | PLRI3 | Pleuraphis rigida | 0–5 | – | ||
slim tridens | TRMU | Tridens muticus | 0–5 | – | ||
2 | 20 | |||||
sixweeks threeawn | ARAD | Aristida adscensionis | 5–10 | – | ||
sixweeks grama | BOBA2 | Bouteloua barbata | 5–10 | – | ||
low woollygrass | DAPU7 | Dasyochloa pulchella | 5–10 | – | ||
sixweeks fescue | VUOC | Vulpia octoflora | 5–10 | – | ||
Forb
|
||||||
3 | 10–40 | |||||
Forb, annual | 2FA | Forb, annual | 5–20 | – | ||
devil's spineflower | CHRI | Chorizanthe rigida | 5–20 | – | ||
spurge | EUPHO | Euphorbia | 5–20 | – | ||
pepperweed | LEPID | Lepidium | 5–20 | – | ||
plantain | PLANT | Plantago | 5–20 | – | ||
Coulter's globemallow | SPCO2 | Sphaeralcea coulteri | 5–20 | – | ||
Shrub/Vine
|
||||||
4 | 50–80 | |||||
brittlebush | ENCEL | Encelia | 50–803 | – | ||
brittlebush | ENFA | Encelia farinosa | 50–80 | – | ||
5 | 40–70 | |||||
burrobush | AMDU2 | Ambrosia dumosa | 40–70 | – | ||
6 | 30–60 | |||||
button brittlebush | ENFR | Encelia frutescens | 30–60 | – | ||
7 | 10–20 | |||||
creosote bush | LATR2 | Larrea tridentata | 10–20 | – | ||
8 | 2–10 | |||||
ratany | KRAME | Krameria | 2–10 | – | ||
desert-thorn | LYCIU | Lycium | 2–10 | – | ||
9 | 2–10 | |||||
candy barrelcactus | FEWI | Ferocactus wislizeni | 2–5 | – |
Interpretations
Animal community
The predominate indiginous widlife on this site are reptiles, insects and rodents. However, desert bighorn sheep and mule deer are common transient visitors. Additional water developments will encourage most forms of wildlife, including desert bighorn sheep, Gambel's quail, deer and rabbits.
Recreational uses
This site is located on low rolling hills and basalt mountains. It occurs on dark desert hills protruding abruptly from the desert floor. Scattered evergreen vegetation provides good texture and contrast. High summer temperatures are very discouraging to outdoor activities. The remainder of the year can be quite pleasant. High velocity winds are common in the spring. Dominate recreational activities are photography, hiking and rockhounding.
Supporting information
Other references
Kingman, Phoenix & Fredonia field offices.
Contributors
AZ NRCS Staff
AZ NRCS Staff. Original Number And Name -- D30-2 Basalt Hills 4-8" P.z.
Karlynn Huling
Larry D. Ellicott
Steve Barker
Rangeland health reference sheet
Interpreting Indicators of Rangeland Health is a qualitative assessment protocol used to determine ecosystem condition based on benchmark characteristics described in the Reference Sheet. A suite of 17 (or more) indicators are typically considered in an assessment. The ecological site(s) representative of an assessment location must be known prior to applying the protocol and must be verified based on soils and climate. Current plant community cannot be used to identify the ecological site.
Author(s)/participant(s) | |
---|---|
Contact for lead author | |
Date | |
Approved by | |
Approval date | |
Composition (Indicators 10 and 12) based on | Annual Production |
Indicators
-
Number and extent of rills:
-
Presence of water flow patterns:
-
Number and height of erosional pedestals or terracettes:
-
Bare ground from Ecological Site Description or other studies (rock, litter, lichen, moss, plant canopy are not bare ground):
-
Number of gullies and erosion associated with gullies:
-
Extent of wind scoured, blowouts and/or depositional areas:
-
Amount of litter movement (describe size and distance expected to travel):
-
Soil surface (top few mm) resistance to erosion (stability values are averages - most sites will show a range of values):
-
Soil surface structure and SOM content (include type of structure and A-horizon color and thickness):
-
Effect of community phase composition (relative proportion of different functional groups) and spatial distribution on infiltration and runoff:
-
Presence and thickness of compaction layer (usually none; describe soil profile features which may be mistaken for compaction on this site):
-
Functional/Structural Groups (list in order of descending dominance by above-ground annual-production or live foliar cover using symbols: >>, >, = to indicate much greater than, greater than, and equal to):
Dominant:
Sub-dominant:
Other:
Additional:
-
Amount of plant mortality and decadence (include which functional groups are expected to show mortality or decadence):
-
Average percent litter cover (%) and depth ( in):
-
Expected annual annual-production (this is TOTAL above-ground annual-production, not just forage annual-production):
-
Potential invasive (including noxious) species (native and non-native). List species which BOTH characterize degraded states and have the potential to become a dominant or co-dominant species on the ecological site if their future establishment and growth is not actively controlled by management interventions. Species that become dominant for only one to several years (e.g., short-term response to drought or wildfire) are not invasive plants. Note that unlike other indicators, we are describing what is NOT expected in the reference state for the ecological site:
-
Perennial plant reproductive capability:
Print Options
Sections
Font
Other
The Ecosystem Dynamics Interpretive Tool is an information system framework developed by the USDA-ARS Jornada Experimental Range, USDA Natural Resources Conservation Service, and New Mexico State University.
Click on box and path labels to scroll to the respective text.