Natural Resources
Conservation Service
Ecological site R030XA121AZ
Limy Fan 3-6" p.z. Sandy
Last updated: 10/21/2024
Accessed: 04/03/2026
General information
Provisional. A provisional ecological site description has undergone quality control and quality assurance review. It contains a working state and transition model and enough information to identify the ecological site.
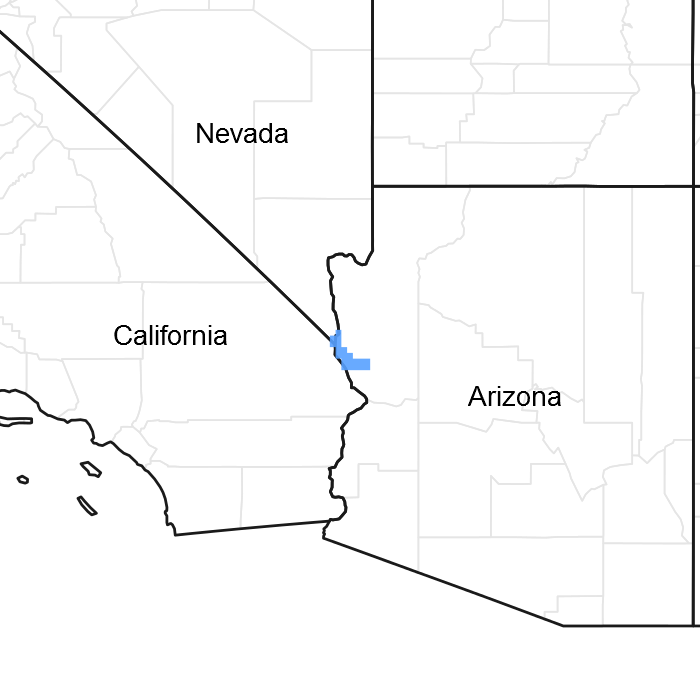
Figure 1. Mapped extent
Areas shown in blue indicate the maximum mapped extent of this ecological site. Other ecological sites likely occur within the highlighted areas. It is also possible for this ecological site to occur outside of highlighted areas if detailed soil survey has not been completed or recently updated.
MLRA notes
Major Land Resource Area (MLRA): 030X–Mojave Basin and Range
This unit occurs within the Basin and Range Province and is characterized by broad basins, valleys, and old lakebeds. Widely spaced mountains trending north to south occur throughout the area. Isolated, short mountain ranges are separated by an aggraded desert plain. The mountains are fault blocks that have been tilted up. Long alluvial fans coalesce with dry lakebeds between some of the ranges.
LRU notes
AZ LRU 30-1 – Lower Mohave Desert
Elevations range from 400 to 2500 feet and precipitation averages 3 to 6 inches per year. Vegetation includes creosotebush, white bursage, Mormon tea, and brittlebush. The soil temperature regime is hyperthermic and the soil moisture regime is typic aridic.
Ecological site concept
This ecological site is located in an upland position. Soils are deep, calcareous, eolian (windblown) fine sand.This site is characteristic of sand sheets and small sand dunes.
Table 1. Dominant plant species
| Tree |
Not specified |
|---|---|
| Shrub |
(1) Ambrosia dumosa |
| Herbaceous |
(1) Pleuraphis rigida |
Physiographic features
This ecological site is found in an upland position on stable sand dunes on fan terraces.
Table 2. Representative physiographic features
| Landforms |
(1)
Fan
(2) Terrace (3) Dune |
|---|---|
| Flooding frequency | None |
| Ponding frequency | None |
| Elevation | 500 – 1,600 ft |
| Slope | 1 – 10% |
| Aspect | Aspect is not a significant factor |
Climatic features
The 30-1AZ Lower Mohave Desert Shrub land resource unit is characterized by a hot, dry climate. The average annual rainfall is 3 to 6 inches, but it can be extremely variable (e.g. from 0 to 11 inches). There can be long periods when little or no precipitation is received. Most of the precipitation for the year could arrive in just a couple of storms. The soil moisture regime is typic aridic and the soil temperature regime is hyperthermic. Winter precipitation from November through April occurs as gentle rains from storms coming out of the Pacific Ocean. Snow is very rare and only falls in the highest mountains. A seasonal drought occurs in May and June. Summer/fall precipitation from July through October comes from spotty, unreliable, and sometimes violent thunderstorms. The moisture originates in the Gulf of Mexico (and the Pacific Ocean in the fall) and flows into the state on the north end of the Mexican monsoon. Strong winds are common, especially during the spring.
Table 3. Representative climatic features
| Frost-free period (average) | 325 days |
|---|---|
| Freeze-free period (average) | 365 days |
| Precipitation total (average) | 6 in |
Figure 2. Monthly average minimum and maximum temperature
Influencing water features
Soil features
The soil of this ecological site is deep with surface and subsoil textures of fine sand. Soil parent material geologic formation materials vary. Available water capacity is low. Water erosion hazard is moderate; wind erosion hazard is very high. Runoff is slow on non-saline, non-sodic soils. Soils are moderately alkaline (pH 8.0-8.2). Soil moisture regime is typic aridic; soil temperature regime is hyperthermic.
A typical soil profile is:
A-0 to 2 inches; fine sand
Bk1-2 to 35 inches; fine sand
Bk2-35 to 60 inches; fine sand
This ecological site has been correlated to map unit 627109, Superstition Family, Mohave County, AZ, Southern Part and map unit 701019, Riverbend, Grand Canyon Area, AZ, Parts of Coconino and Mohave Counties.
Table 4. Representative soil features
| Surface texture |
(1) Fine sand |
|---|---|
| Family particle size |
(1) Sandy |
| Drainage class | Somewhat excessively drained |
| Permeability class | Rapid |
| Soil depth | 60 in |
| Surface fragment cover <=3" | 20% |
| Surface fragment cover >3" | Not specified |
| Available water capacity (0-40in) |
2.4 – 4.2 in |
| Calcium carbonate equivalent (0-40in) |
5 – 20% |
| Electrical conductivity (0-40in) |
Not specified |
| Sodium adsorption ratio (0-40in) |
Not specified |
| Soil reaction (1:1 water) (0-40in) |
7.4 – 8.4 |
| Subsurface fragment volume <=3" (Depth not specified) |
20% |
| Subsurface fragment volume >3" (Depth not specified) |
Not specified |
Ecological dynamics
Limy Fan, 3"-6" p.z., Sandy, is sand sheets and sand dunes co-dominated by shrubs and perennial grasses. Annual forbs and grasses flourish following rainfall. Wind movement of the fine sand is a natural feature of this ecological site. Other natural disturbances are rare. After introduction of non-native annuals (forbs and/or grasses), their spring growth may overcome native forbs, especially following an unusually wet winter. Dominant shrubs are creosote and white bursage. Big galleta is the dominant perennial grass. Assorted half-shrubs are well-dispersed throughout.
State and transition model
More interactive model formats are also available.
View Interactive Models
Click on state and transition labels to scroll to the respective text
State 1 submodel, plant communities
State 2 submodel, plant communities
State 1
Historic Climax Plant Community
Community 1.1
Historic Climax Plant Community
The dominant aspect of this site is a desert shrub with some grasses and forbs. White bursage, creosotebush and white ratany are the major shrubs. Big galleta is the main perennial grass.
Figure 3. Annual production by plant type (representative values) or group (midpoint values)
Table 5. Annual production by plant type
| Plant type | Low (lb/acre) |
Representative value (lb/acre) |
High (lb/acre) |
|---|---|---|---|
| Shrub/Vine | 140 | 150 | 160 |
| Grass/Grasslike | 20 | 35 | 40 |
| Forb | 10 | 15 | 20 |
| Total | 170 | 200 | 220 |
Table 6. Ground cover
| Tree foliar cover | 0% |
|---|---|
| Shrub/vine/liana foliar cover | 0-2% |
| Grass/grasslike foliar cover | 0% |
| Forb foliar cover | 0% |
| Non-vascular plants | 0% |
| Biological crusts | 0% |
| Litter | 0% |
| Surface fragments >0.25" and <=3" | 0% |
| Surface fragments >3" | 0% |
| Bedrock | 0% |
| Water | 0% |
| Bare ground | 0% |
Table 7. Canopy structure (% cover)
| Height Above Ground (ft) | Tree | Shrub/Vine | Grass/ Grasslike |
Forb |
|---|---|---|---|---|
| <0.5 | – | – | – | 0-2% |
| >0.5 <= 1 | – | – | 0-2% | – |
| >1 <= 2 | – | 4-8% | – | – |
| >2 <= 4.5 | – | – | – | – |
| >4.5 <= 13 | – | – | – | – |
| >13 <= 40 | – | – | – | – |
| >40 <= 80 | – | – | – | – |
| >80 <= 120 | – | – | – | – |
| >120 | – | – | – | – |
Figure 4. Plant community growth curve (percent production by month). AZ3011, 30.1 3-6" p.z. all sites. Growth begins in late winter, most growth occurs in the spring..
| Jan | Feb | Mar | Apr | May | Jun | Jul | Aug | Sep | Oct | Nov | Dec |
|---|---|---|---|---|---|---|---|---|---|---|---|
| J | F | M | A | M | J | J | A | S | O | N | D |
| 0 | 7 | 30 | 32 | 13 | 7 | 3 | 5 | 2 | 1 | 0 | 0 |
Figure 5. Plant community growth curve (percent production by month). AZ3082, 30.27 3-6" p.z. creosotebush. Growth occurs mostly in the spring using stored winter moisture. Flowers and sets seed by July..
| Jan | Feb | Mar | Apr | May | Jun | Jul | Aug | Sep | Oct | Nov | Dec |
|---|---|---|---|---|---|---|---|---|---|---|---|
| J | F | M | A | M | J | J | A | S | O | N | D |
| 0 | 0 | 20 | 40 | 20 | 20 | 0 | 0 | 0 | 0 | 0 | 0 |
Figure 6. Plant community growth curve (percent production by month). AZ3083, 30.27 3-6" p.z. white bursage. Growth begins in early spring. Dormancy occurs during the hot summer months. With sufficient summer/fall precipitation, some plants may break dormancy and produce a flush of growth. Flowers and sets seed by July..
| Jan | Feb | Mar | Apr | May | Jun | Jul | Aug | Sep | Oct | Nov | Dec |
|---|---|---|---|---|---|---|---|---|---|---|---|
| J | F | M | A | M | J | J | A | S | O | N | D |
| 0 | 5 | 20 | 40 | 20 | 15 | 0 | 0 | 0 | 0 | 0 | 0 |
Figure 7. Plant community growth curve (percent production by month). AZ3085, 30.27 3-6" p.z. white ratany. Most growth occurs in the spring. Flowers and sets seed by July..
| Jan | Feb | Mar | Apr | May | Jun | Jul | Aug | Sep | Oct | Nov | Dec |
|---|---|---|---|---|---|---|---|---|---|---|---|
| J | F | M | A | M | J | J | A | S | O | N | D |
| 0 | 5 | 20 | 35 | 20 | 20 | 0 | 0 | 0 | 0 | 0 | 0 |
Figure 8. Plant community growth curve (percent production by month). AZ3086, 30.27 3-6" p.z. big galleta. Growth begins in the late winter and early spring, goes dormant in May through June, most growth occurs during the summer rainy season..
| Jan | Feb | Mar | Apr | May | Jun | Jul | Aug | Sep | Oct | Nov | Dec |
|---|---|---|---|---|---|---|---|---|---|---|---|
| J | F | M | A | M | J | J | A | S | O | N | D |
| 0 | 10 | 20 | 10 | 0 | 0 | 15 | 40 | 5 | 0 | 0 | 0 |
State 2
Historic Native Plant Community plus Introduced Annuals
Community 2.1
Non-Native Annual Understory
This plant community resembles the historic native plant community, but exotic annuals have been introduced. Non-native species include red brome, Mediterranean grass (Schismus spp.), and filaree. The flourish of non-native annuals that occurs following rainfalls may preclude native annuals.
Transition T1A
State 1 to 2
Wind and mechanical transport of seeds and propagules.
Restoration pathway R2A
State 2 to 1
None known.
Additional community tables
Table 8. Community 1.1 plant community composition
| Group | Common name | Symbol | Scientific name | Annual production (lb/acre) | Foliar cover (%) | |
|---|---|---|---|---|---|---|
|
Grass/Grasslike
|
||||||
| 1 | 10–20 | |||||
| big galleta | PLRI3 | Pleuraphis rigida | 10–20 | – | ||
| 2 | 0–4 | |||||
| threeawn | ARIST | Aristida | 0–4 | – | ||
| 3 | 0–2 | |||||
| low woollygrass | DAPU7 | Dasyochloa pulchella | 0–2 | – | ||
| 4 | 2–4 | |||||
| needle grama | BOAR | Bouteloua aristidoides | 2–4 | – | ||
| 5 | 2–4 | |||||
| sixweeks grama | BOBA2 | Bouteloua barbata | 2–4 | – | ||
| 6 | 2–4 | |||||
| sixweeks fescue | VUOC | Vulpia octoflora | 2–6 | – | ||
| 7 | 2–4 | |||||
| sixweeks threeawn | ARAD | Aristida adscensionis | 2–4 | – | ||
|
Forb
|
||||||
| 8 | 2–4 | |||||
| desert Indianwheat | PLOV | Plantago ovata | 2–4 | – | ||
| 9 | 2–4 | |||||
| Arizona lupine | LUARS4 | Lupinus arizonicus ssp. setosissimus | 2–4 | – | ||
| 10 | 2–4 | |||||
| desert lily | HEUN2 | Hesperocallis undulata | 2–4 | – | ||
| 11 | 0–2 | |||||
| devil's spineflower | CHRI | Chorizanthe rigida | 3–6 | – | ||
| 12 | 2–10 | |||||
| Forb, annual | 2FA | Forb, annual | 2–10 | – | ||
|
Shrub/Vine
|
||||||
| 13 | 0–6 | |||||
| burrobush | AMDU2 | Ambrosia dumosa | 0–6 | – | ||
| 14 | 0–10 | |||||
| Shrub, other | 2S | Shrub, other | 0–10 | – | ||
| 15 | 30–50 | |||||
| creosote bush | LATR2 | Larrea tridentata | 30–50 | – | ||
| 16 | 10–20 | |||||
| white ratany | KRGR | Krameria grayi | 10–20 | – | ||
| 17 | 0–6 | |||||
| whitestem paperflower | PSCO2 | Psilostrophe cooperi | 0–6 | – | ||
| 18 | 0–4 | |||||
| pricklypear | OPUNT | Opuntia | 0–4 | – | ||
| 19 | 2–10 | |||||
| Shrub, other | 2S | Shrub, other | 2–10 | – | ||
Interpretations
Supporting information
Type locality
| Location 1: Mohave County, AZ | |
|---|---|
| Township/Range/Section | T16N R21W S10 |
| General legal description | Warm springs SW quad - 1 mile north of Golden Shores along Highway 95. |
Contributors
Harmon Hodgkinson
Larry D. Ellicott
Approval
Kendra Moseley, 10/21/2024
Rangeland health reference sheet
Interpreting Indicators of Rangeland Health is a qualitative assessment protocol used to determine ecosystem condition based on benchmark characteristics described in the Reference Sheet. A suite of 17 (or more) indicators are typically considered in an assessment. The ecological site(s) representative of an assessment location must be known prior to applying the protocol and must be verified based on soils and climate. Current plant community cannot be used to identify the ecological site.
| Author(s)/participant(s) | |
|---|---|
| Contact for lead author | |
| Date | 10/22/2024 |
| Approved by | Kendra Moseley |
| Approval date | |
| Composition (Indicators 10 and 12) based on | Annual Production |
Indicators
-
Number and extent of rills:
-
Presence of water flow patterns:
-
Number and height of erosional pedestals or terracettes:
-
Bare ground from Ecological Site Description or other studies (rock, litter, lichen, moss, plant canopy are not bare ground):
-
Number of gullies and erosion associated with gullies:
-
Extent of wind scoured, blowouts and/or depositional areas:
-
Amount of litter movement (describe size and distance expected to travel):
-
Soil surface (top few mm) resistance to erosion (stability values are averages - most sites will show a range of values):
-
Soil surface structure and SOM content (include type of structure and A-horizon color and thickness):
-
Effect of community phase composition (relative proportion of different functional groups) and spatial distribution on infiltration and runoff:
-
Presence and thickness of compaction layer (usually none; describe soil profile features which may be mistaken for compaction on this site):
-
Functional/Structural Groups (list in order of descending dominance by above-ground annual-production or live foliar cover using symbols: >>, >, = to indicate much greater than, greater than, and equal to):
Dominant:
Sub-dominant:
Other:
Additional:
-
Amount of plant mortality and decadence (include which functional groups are expected to show mortality or decadence):
-
Average percent litter cover (%) and depth ( in):
-
Expected annual annual-production (this is TOTAL above-ground annual-production, not just forage annual-production):
-
Potential invasive (including noxious) species (native and non-native). List species which BOTH characterize degraded states and have the potential to become a dominant or co-dominant species on the ecological site if their future establishment and growth is not actively controlled by management interventions. Species that become dominant for only one to several years (e.g., short-term response to drought or wildfire) are not invasive plants. Note that unlike other indicators, we are describing what is NOT expected in the reference state for the ecological site:
-
Perennial plant reproductive capability:
Print Options
Sections
Font
Other
The Ecosystem Dynamics Interpretive Tool is an information system framework developed by the USDA-ARS Jornada Experimental Range, USDA Natural Resources Conservation Service, and New Mexico State University.
Click on box and path labels to scroll to the respective text.