Natural Resources
Conservation Service
Ecological site R030XB157CA
Gravelly Inset Fan 5-7" p.z.
Last updated: 2/25/2025
Accessed: 04/12/2026
General information
Provisional. A provisional ecological site description has undergone quality control and quality assurance review. It contains a working state and transition model and enough information to identify the ecological site.
Ecological site concept
This site occurs in inset fans and fan aprons. The soils on this ecosite are very deep, somewhat excessively drained sandy soils derived from mixed recent alluvium.
Please refer to group concept R030XB052NV to view the provisional STM.
Associated sites
| R030XB143CA |
Shallow Granitic Loam 5-7" P.Z. This site occurs at slightly higher elevations on sideslopes of fan remnants. |
|---|
Table 1. Dominant plant species
| Tree |
Not specified |
|---|---|
| Shrub |
(1) Menodora spinescens |
| Herbaceous |
Not specified |
Physiographic features
This site occurs in inset fans and fan aprons.
Table 2. Representative physiographic features
| Landforms |
(1)
Inset fan
(2) Fan apron |
|---|---|
| Flooding duration | Extremely brief (0.1 to 4 hours) to very brief (4 to 48 hours) |
| Flooding frequency | Very rare to rare |
| Ponding duration | Very brief (4 to 48 hours) to brief (2 to 7 days) |
| Ponding frequency | None to rare |
| Elevation | 3,400 – 4,400 ft |
| Slope | 2 – 8% |
| Ponding depth | 1 in |
| Aspect | Aspect is not a significant factor |
Climatic features
The Mojave Desert experiences clear, dry conditions for a majority of the year. Winter temperatures are mild, summer temperatures are hot, and seasonal and diurnal temperature fluctuations are large. Monthly minimum temperature averages range from 30 to 80 degrees F (-1 to 27 degrees C). Monthly maximum temperature averages range from 60 to 110 degrees F (16 to 43 degrees C) (CSU 2002).
Average annual rainfall is between 2 and 8 inches (50 to 205 millimeters) (USDA 2006). Snowfall is more common at elevations above 4000 feet (1220 meters), but it may not occur every year (WRCC 2002b). The Mojave Desert receives precipitation from two sources. Precipitation falls primarily in the winter as a result of storms originating in the northern Pacific Ocean. The Sierra Nevada and Transverse Ranges create a rain shadow effect, causing little precipitation to reach the Mojave Desert. Sporadic rainfall occurs during the summer as a result of convection storms formed when moisture from the Gulf of Mexico or Gulf of California moves into the region. Summer rainfall is more common and has a greater influence on soil moisture in the eastern Mojave Desert.
Windy conditions are also common in the Mojave Desert, particularly in the west and central Mojave Desert. Spring is typically the windiest season, with winds averaging 10-15 miles per hour (WRCC 2002a). Winds in excess of 25 miles per hour and gusts in excess of 50 miles per hour are not uncommon (CSU 2002).
In the BLM Grazing Allotments Soil Survey (Northeast Part of Mojave Desert Area, CA (CA805)), most areas receive approximately 5 to 7 inches of precipitation annually (WRCC 2002b). At elevations above 4000 feet (1370 meters), average annual precipitation in the form of rain may reach 8 inches or more, and average annual snowfall may reach up to 10 inches (WRCC 2002b).
The data from the following climate stations were used to describe the climate in the BLM Grazing Allotments Soil Survey (station number in parentheses):
Pahrump, NV (265890)
Mountain Pass, CA (045890)
Searchlight, NV (267369)
Red Rock Canyon State Park, NV (266691)
Type localities for this ecosite were established in Soil Survey Area (SSA) CA695 and CA698. The nearest climate stations to the type locality in SSA CA698 are at Barstow Fire Station, CA and Twentynine Palms, CA. These stations are at elevations approximately 1000 feet below the range defined for this ecosite. The nearest climate station to the type locality in SSA CA695 is Mountain Pass, CA, and occurs at the upper end of the elevation range defined for this ecosite.
"Minimum monthly precipitation" represents average monthly precipitation at Barstow Fire Station, CA (low elevation).
"Maximum monthly precipitation" represents average monthly precipitation at Mountain Pass, CA (high elevation).
Temperature data is from Barstow Fire Station, CA. Average high temperatures at Mountain Pass are approximately 9-12 degrees cooler than at Barstow Fire Station. Average low temperatures at Mountain Pass are 1-7 degrees cooler than at Barstow.
Table 3. Representative climatic features
| Frost-free period (average) | 320 days |
|---|---|
| Freeze-free period (average) | 290 days |
| Precipitation total (average) | 7 in |
Figure 1. Monthly precipitation range
Figure 2. Monthly average minimum and maximum temperature
Influencing water features
Soil features
Please refer to group concept R030XB052NV to view the provisional STM.
The soils on this ecosite are very deep, somewhat excessively drained sandy soils derived from mixed recent alluvium. Infiltration and permeability are very rapid. Soils classify as sandy-skeletal, Typic Torriorthents. There is neglibible runoff from this site, but very rare to rare, extremely brief flooding occurs across the surface.
Soil survey area - Map unit symbol - Component
CA805 - 4122 - Arizo (minor component)
Table 4. Representative soil features
| Surface texture |
(1) Loamy sand |
|---|---|
| Family particle size |
(1) Sandy |
| Drainage class | Somewhat excessively drained |
| Permeability class | Rapid to very rapid |
| Soil depth | 60 – 80 in |
| Surface fragment cover <=3" | 50 – 90% |
| Surface fragment cover >3" | 5% |
| Available water capacity (0-40in) |
0.5 – 1 in |
| Calcium carbonate equivalent (0-40in) |
1% |
| Electrical conductivity (0-40in) |
2 mmhos/cm |
| Sodium adsorption ratio (0-40in) |
5 |
| Soil reaction (1:1 water) (0-40in) |
7.6 – 8 |
| Subsurface fragment volume <=3" (Depth not specified) |
35 – 60% |
| Subsurface fragment volume >3" (Depth not specified) |
10% |
Ecological dynamics
This ecological site occurs on inset fans and fan aprons. The major natural disturbance to this ecological site is caused by water. Water drains into this ecosite from adjacent fan remnants. This may increase site productivity, particularly after heavy spring rains.
The dominant species on this site are creosote bush (Larrea tridentata) and spiny menodora (Menodora spinescens). Other major species on this ecosite are Nevada ephedra (Ephedra nevadensis) and ratany (Krameria spp.).
Creosote bush is a long-lived, late successional species, but is slow to establish due to infrequent masting and germination (Barbour 1968). Creosote bush seedlings are often found under the canopy of live or dead white bursage (Ambrosia dumosa), which are also found on this ecosite (Marshall 1995). The development of wider spacing between creosote bush and nurse plants may be related to factors such as allelopathic interactions (Marshall 1995), competition for water (Fonteyn and Mahall 1981), and the death of older shoots as plants grow away from each other by cloning (Marshall 1994). Disturbance typically reduces the occurrence of creosote bush. The response of spiny menodora to disturbance is similar to that of creosote bush.
Nevada ephedra is a mid- to late-succesional species, found on undisturbed sites, as well as sites several years (6-12 years) post-disturbance (Anderson 2004). Nevada ephedra can re-colonize a site via seed or sprouting. Ratany (Krameria spp.) are late successional species that establish on site by seed.
State and transition model
More interactive model formats are also available.
View Interactive Models
Click on state and transition labels to scroll to the respective text
Ecosystem states
State 1 submodel, plant communities
State 1
Spiny Menodora - Creosote Bush
Community 1.1
Spiny Menodora - Creosote Bush

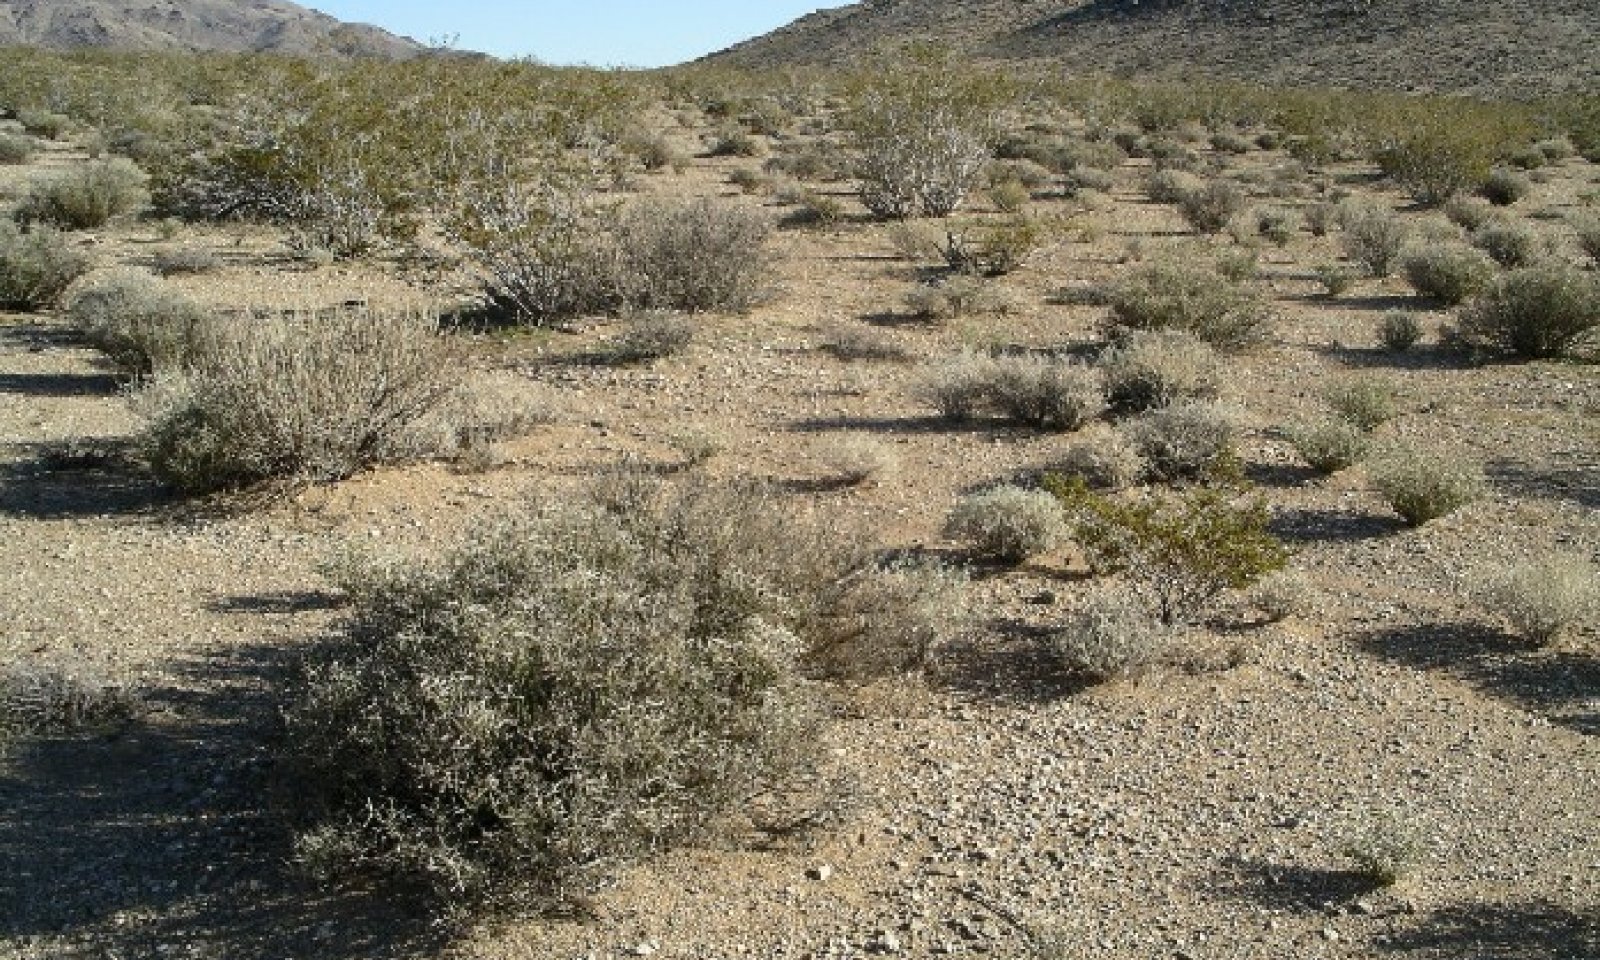
Figure 3. Spiny menodora site
The interpretive plant community is the reference plant community prior to European colonization. Creosote bush (Larrea tridentata) and spiny menodora (Menodora spinescens) are the dominant species on this site. In areas receiving higher moisture, spiny menodora may be more dominant. White bursage (Ambrosia dumosa) may be a more significant component of the ecosite on warmer soils at lower elevations, and less significant at higher elevations. In Soil Survey Area 698, other important shrubs include littleleaf ratany (Krameria erecta) and white ratany (Krameria grayi). In Soil Survey Area 695, Nevada ephedra (Ephedra nevadensis) is a major cover component on this ecosite. “Percent Composition by Frequency of Overstory Species” represents only low, RV, and high canopy cover. Production values are not listed.
Figure 4. Annual production by plant type (representative values) or group (midpoint values)
Table 5. Annual production by plant type
| Plant type | Low (lb/acre) |
Representative value (lb/acre) |
High (lb/acre) |
|---|---|---|---|
| Shrub/Vine | 185 | 331 | 426 |
| Forb | 15 | 19 | 24 |
| Total | 200 | 350 | 450 |
Table 6. Ground cover
| Tree foliar cover | 0% |
|---|---|
| Shrub/vine/liana foliar cover | 70-90% |
| Grass/grasslike foliar cover | 0% |
| Forb foliar cover | 10-20% |
| Non-vascular plants | 0% |
| Biological crusts | 0% |
| Litter | 0% |
| Surface fragments >0.25" and <=3" | 0% |
| Surface fragments >3" | 0% |
| Bedrock | 0% |
| Water | 0% |
| Bare ground | 0% |
Table 7. Soil surface cover
| Tree basal cover | 0% |
|---|---|
| Shrub/vine/liana basal cover | 10-15% |
| Grass/grasslike basal cover | 0% |
| Forb basal cover | 2-3% |
| Non-vascular plants | 0% |
| Biological crusts | 0% |
| Litter | 10-30% |
| Surface fragments >0.25" and <=3" | 40-60% |
| Surface fragments >3" | 0% |
| Bedrock | 0% |
| Water | 0% |
| Bare ground | 2-3% |
Table 8. Canopy structure (% cover)
| Height Above Ground (ft) | Tree | Shrub/Vine | Grass/ Grasslike |
Forb |
|---|---|---|---|---|
| <0.5 | – | – | – | 5-7% |
| >0.5 <= 1 | – | 1-2% | – | – |
| >1 <= 2 | – | 10-15% | – | – |
| >2 <= 4.5 | – | 10-15% | – | – |
| >4.5 <= 13 | – | 2-3% | – | – |
| >13 <= 40 | – | – | – | – |
| >40 <= 80 | – | – | – | – |
| >80 <= 120 | – | – | – | – |
| >120 | – | – | – | – |
Additional community tables
Table 9. Community 1.1 plant community composition
| Group | Common name | Symbol | Scientific name | Annual production (lb/acre) | Foliar cover (%) | |
|---|---|---|---|---|---|---|
|
Shrub/Vine
|
||||||
| 1 | Shrubs | 185–426 | ||||
| spiny menodora | MESP2 | Menodora spinescens | 60–135 | – | ||
| creosote bush | LATR2 | Larrea tridentata | 74–114 | – | ||
| burrobush | AMDU2 | Ambrosia dumosa | 10–42 | – | ||
| turpentinebroom | THMO | Thamnosma montana | 3–24 | – | ||
| littleleaf ratany | KRER | Krameria erecta | 15–21 | – | ||
| white ratany | KRGR | Krameria grayi | 15–21 | – | ||
| Mojave yucca | YUSC2 | Yucca schidigera | 1–20 | – | ||
| desertsenna | SEAR8 | Senna armata | 1–13 | – | ||
| blackbrush | CORA | Coleogyne ramosissima | 2–13 | – | ||
| buckhorn cholla | CYACA2 | Cylindropuntia acanthocarpa var. acanthocarpa | 1–8 | – | ||
| Eastern Mojave buckwheat | ERFA2 | Eriogonum fasciculatum | 1–5 | – | ||
| desert pepperweed | LEFR2 | Lepidium fremontii | 1–5 | – | ||
| slender poreleaf | POGR5 | Porophyllum gracile | 1–5 | – | ||
|
Forb
|
||||||
| 2 | Annual Forbs | 15–24 | ||||
| popcornflower | PLAGI | Plagiobothrys | 6–9 | – | ||
| bristly fiddleneck | AMTE3 | Amsinckia tessellata | 3–5 | – | ||
| pincushion flower | CHFR | Chaenactis fremontii | 3–5 | – | ||
| desert calico | LOMA10 | Loeseliastrum matthewsii | 3–5 | – | ||
Interpretations
Animal community
Creosote bush provides important habitat for wildlife, and its seed and foliage are consumed by small mammals. Nevada ephedra and Krameria spp. are also important browse species for wildlife.
The major use of this ecosite is livestock grazing. Creosote bush is not palatable and is not utilized by livestock, but spiny menodora (BLM 2006) and Nevada ephedra (Anderson 2004) are used as forage when available. Nevada ephedra is an important winter forage species, and Krameria spp. are highly palatable to livestock. They decrease in response to grazing, and recovery is considered to be slow (Goldberg and Turner 1986).
Hydrological functions
This ecological site is moderately channelized and acts as interfluves between surrounding stable fan remnants.
Recreational uses
This site is very charismatic. The high diversity of shrubs combined with a scenic backdrop of mountains makes for some beautiful photographs. Also, the abundant wildflower show after good rains provides excellent wildflower pictures. This site is also crossed by off-highway vehicle trails providing some touring opportunities.
Supporting information
Inventory data references
This ecosite was initially developed in Soil Survey Area 698. Production was sampled in SSA 698 using one dry weight rank transect on 28 January 2004 at the Johnson Valley type locality.
Vegetation cover was sampled in SSA 695 in lieu of production due to a poor growing season. Ten 100-foot point-intercept transects were sampled on 7 March 2006 at the Clark Mountain Grazing Allotment type locality. The top two tiers of vegetation or other cover class (e.g. bare soil, gravel, rock, litter, biological soil crust) were recorded at every foot.
Type locality
| Location 1: San Bernardino County, CA | |
|---|---|
| UTM zone | N |
| UTM northing | 3836099 |
| UTM easting | 528074 |
| Latitude | 4° 11′ 8″ |
| Longitude | 88° 13′ 34″ |
| General legal description | This site is located in Johnson Valley Off-Highway Vehicle Area off of Camprock Rd. |
| Location 2: San Bernardino County, CA | |
| UTM zone | N |
| UTM northing | 3938790 |
| UTM easting | 634677 |
| Latitude | 35° 35′ 1″ |
| Longitude | 115° 30′ 48″ |
| General legal description | This type site is located in the Clark Mountain Grazing Allotment (BLM) near to the northern powerline road. |
Other references
Anderson, Michelle D. 2004. Ephedra nevadensis. In: Fire Effects Information System, [Online]. U.S. Department of Agriculture, Forest Service, Rocky Mountain Research Station, Fire Sciences Laboratory (Producer). Available: http://www.fs.fed.us/database/feis [2006, September 19]
Barbour, M. G. 1968. Germination requirements of the desert shrub Larrea divaricata. Ecology 49: 915-923.
Bureau of Land Management (Barstow Field Office). April 2006. Environmental Assessment Livestock Grazing Authorization (CA-680-05-81) for Pahrump Valley, Cady Mountain, Cronese Lake, Harper Lake, Rattlesnake Canyon, Ord Mountain, Valley Well, Round Mountain.
California State University (CSU) Desert Studies Center. 2002. Desert Climate. CSU Desert Studies Center, Soda Springs, CA. Online. http://biology.fullerton.edu/facilities/dsc/zz_climate.html. Accessed 28 November 2006.
Fonteyn, P.J and B.E. Mahall. 1981. An experimental analysis of structure in a desert plant community. Ecology 69: 883-896.
Goldberg, D.E. and R.M. Turner. 1986. Vegetation change and plant demography in permanent plots in the Sonoran Desert. Ecology 67: 695-712.
Marshall, K. Anna. 1994. Ambrosia dumosa. In: Fire Effects Information System, [Online]. U.S. Department of Agriculture, Forest Service, Rocky Mountain Research Station, Fire Sciences Laboratory (Producer). Available: http://www.fs.fed.us/database/feis [2006, September 6]
Marshall, K. Anna. 1995. Larrea tridentata. In: Fire Effects Information System, [Online]. U.S. Department of Agriculture, Forest Service, Rocky Mountain Research Station, Fire Sciences Laboratory (Producer). Available: http://www.fs.fed.us/database/feis [2006, September 6]
Rundel, P.W. and A.C. Gibson. 1996. Ecological communities and processes in a Mojave Desert ecosystem: Rock Valley, Nevada. Cambridge University Press, New York. 369pp.
United States Department of Agriculture (USDA), Natural Resources Conservation Service. 2006. Land Resource Regions and Major Land Resource Areas of the United States, the Caribbean, and the Pacific Basin. U.S. Department of Agriculture Handbook 296.
Western Regional Climate Center (WRCC). 2002a. Average wind speeds by state (1992-2002). Desert Research Institute, Reno, NV. Online. http://www.wrcc.dri.edu/htmlfiles/westwind.final.html. Accessed 28 November 2006.
Western Regional Climate Center (WRCC). 2002b. Western U.S. Climate Historical Summaries [Online]. Desert Research Institute, Reno, NV. Online. http://www.wrcc.dri.edu/Climsum.html. Accessed 28 November 2006.
Locator map image generated using TopoZone.com © 1999-2004 Maps a la carte, Inc. - All rights reserved.
Contributors
Heath M. McAllister, Allison Tokunaga
Approval
Sarah Quistberg, 2/25/2025
Rangeland health reference sheet
Interpreting Indicators of Rangeland Health is a qualitative assessment protocol used to determine ecosystem condition based on benchmark characteristics described in the Reference Sheet. A suite of 17 (or more) indicators are typically considered in an assessment. The ecological site(s) representative of an assessment location must be known prior to applying the protocol and must be verified based on soils and climate. Current plant community cannot be used to identify the ecological site.
| Author(s)/participant(s) | |
|---|---|
| Contact for lead author | |
| Date | 02/26/2025 |
| Approved by | Sarah Quistberg |
| Approval date | |
| Composition (Indicators 10 and 12) based on | Annual Production |
Indicators
-
Number and extent of rills:
-
Presence of water flow patterns:
-
Number and height of erosional pedestals or terracettes:
-
Bare ground from Ecological Site Description or other studies (rock, litter, lichen, moss, plant canopy are not bare ground):
-
Number of gullies and erosion associated with gullies:
-
Extent of wind scoured, blowouts and/or depositional areas:
-
Amount of litter movement (describe size and distance expected to travel):
-
Soil surface (top few mm) resistance to erosion (stability values are averages - most sites will show a range of values):
-
Soil surface structure and SOM content (include type of structure and A-horizon color and thickness):
-
Effect of community phase composition (relative proportion of different functional groups) and spatial distribution on infiltration and runoff:
-
Presence and thickness of compaction layer (usually none; describe soil profile features which may be mistaken for compaction on this site):
-
Functional/Structural Groups (list in order of descending dominance by above-ground annual-production or live foliar cover using symbols: >>, >, = to indicate much greater than, greater than, and equal to):
Dominant:
Sub-dominant:
Other:
Additional:
-
Amount of plant mortality and decadence (include which functional groups are expected to show mortality or decadence):
-
Average percent litter cover (%) and depth ( in):
-
Expected annual annual-production (this is TOTAL above-ground annual-production, not just forage annual-production):
-
Potential invasive (including noxious) species (native and non-native). List species which BOTH characterize degraded states and have the potential to become a dominant or co-dominant species on the ecological site if their future establishment and growth is not actively controlled by management interventions. Species that become dominant for only one to several years (e.g., short-term response to drought or wildfire) are not invasive plants. Note that unlike other indicators, we are describing what is NOT expected in the reference state for the ecological site:
-
Perennial plant reproductive capability:
Print Options
Sections
Font
Other
The Ecosystem Dynamics Interpretive Tool is an information system framework developed by the USDA-ARS Jornada Experimental Range, USDA Natural Resources Conservation Service, and New Mexico State University.
Click on box and path labels to scroll to the respective text.