Natural Resources
Conservation Service
Ecological site R030XB212AZ
Limy Slopes 6-9" p.z.
Last updated: 10/21/2024
Accessed: 03/25/2026
General information
Provisional. A provisional ecological site description has undergone quality control and quality assurance review. It contains a working state and transition model and enough information to identify the ecological site.
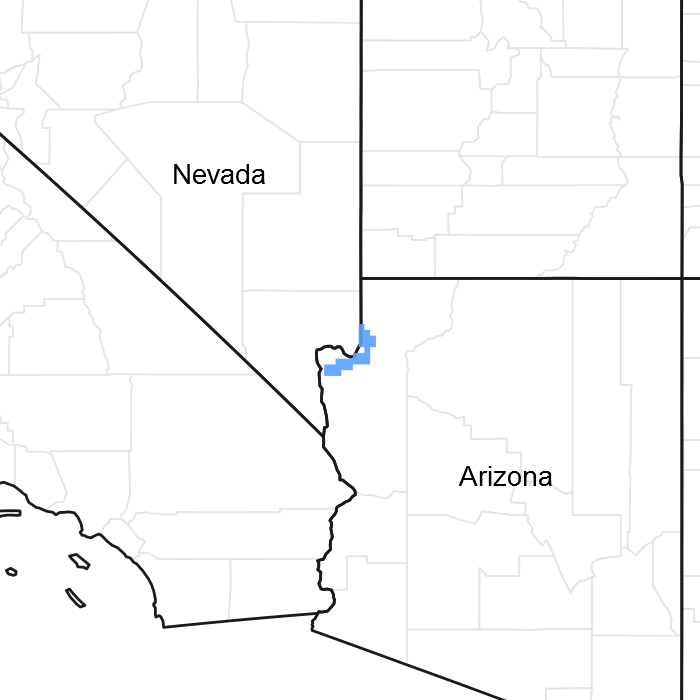
Figure 1. Mapped extent
Areas shown in blue indicate the maximum mapped extent of this ecological site. Other ecological sites likely occur within the highlighted areas. It is also possible for this ecological site to occur outside of highlighted areas if detailed soil survey has not been completed or recently updated.
MLRA notes
Major Land Resource Area (MLRA): 030X–Mojave Basin and Range
This unit occurs within the Basin and Range Province and is characterized by broad basins, valleys, and old lakebeds. Widely spaced mountains trending north to south occur throughout the area. Isolated, short mountain ranges are separated by an aggraded desert plain. The mountains are fault blocks that have been tilted up. Long alluvial fans coalesce with dry lakebeds between some of the ranges.
LRU notes
AZ LRU 30-2 – Middle Mohave Desert
Elevations range from 1500 to 3200 feet and precipitation averages 6 to 9 inches per year. Vegetation includes creosotebush, white bursage, yucca, prickly pear and cholla species, Mormon tea, flattop buckwheat, ratany, winterfat, bush muhly, threeawns, and big galleta. The soil temperature regime is thermic and the soil moisture regime is typic aridic.
Ecological site concept
This ecological site is located on steeply sloping uplands (slopes 15% - 65%). Calcareous soils are moderately deep to deep, yet shallow to petrocalcic horizon.
Associated sites
| R030XA107AZ |
Limy Slopes 3-6" p.z. |
|---|---|
| R030XB211AZ |
Limy Fan 6-9" p.z. |
Table 1. Dominant plant species
| Tree |
Not specified |
|---|---|
| Shrub |
(1) Ambrosia dumosa |
| Herbaceous |
Not specified |
Physiographic features
This desert shrub ecological site is in an upland position of narrow, sloping, inter-locking ridges with steep sides. It does not receive any benefit from run-on moisture, but excessive runoff can occur because of steep slopes. Cooler aspects are more productive with closer plant spacing and growthier shrubs. It is found on all aspects.
Table 2. Representative physiographic features
| Landforms |
(1)
Ballena
(2) Fan (3) Terrace |
|---|---|
| Flooding frequency | None |
| Ponding frequency | None |
| Elevation | 1,600 – 3,000 ft |
| Slope | 15 – 50% |
Climatic features
The climate is arid and warm. Annual precipitation ranges from 6 to 9 inches. About 65 percent of the rainfall comes from October through May as gentle rain from Pacific storms which may last for a couple of days. The rest of the rainfall comes during the summer monsoon season from July through September as spotty, brief, intense thunderstorms. Snow rarely falls, and only remains on the ground a few hours at most. Annual air temperature ranges from 59 to 70 degrees F. The average frost-free period ranges from 156 to 259 days.
Table 3. Representative climatic features
| Frost-free period (average) | 259 days |
|---|---|
| Freeze-free period (average) | 290 days |
| Precipitation total (average) | 9 in |
Figure 2. Monthly precipitation range
Figure 3. Monthly average minimum and maximum temperature
Influencing water features
Soil features
The soil of this ecological site is moderately deep to any plant root restricting layer. The soil is strongly to violently effervescent throughout the soil profile. The soil's moisture regime is typic aridic and the temperature regime is thermic. The soil is well drained, non-saline and non-sodic with a pH range of 8.0-8.6. The soil's water erosion hazard is moderate and wind erosion hazard is slight. The pLant-soil moisture relationship is limited due to shallow soils, gravel and lime content.
A typical soil profile is:
A-0 to 2 inches; extremely gravelly sandy loam; 65 percent gravel; strongly effervescent
Bw1-2 to 8 inches; gravelly sandy clay loam; 30 percent gravel; strongly effervescent
Bw2-8 to 17 inches; extremely gravelly sandy clay loam; 75 percent gravel; strongly effervescent
Bk-17 to 27 inches; extremely gravelly sandy clay loam; 80 percent gravel; strongly effervescent
Cr-27 inches; weathered fanglomerate dominated by granite, schist and gneiss clasts
The taxonomic classification is Loamy-skeletal, mixed, superactive, thermic Typic Haplocambids
Soils correlated to this ecological site include map units 701012 and 102013, Bobzbulz soil, 701087, Meadview soil, and 701086 and 701087, Orrubo soil in the Grand Canyon Area, AZ, Parts of Coconino and Mohave Counties.
Table 4. Representative soil features
| Surface texture |
(1) Very gravelly sandy loam (2) Extremely gravelly loam (3) Clay |
|---|---|
| Family particle size |
(1) Loamy |
| Drainage class | Well drained |
| Permeability class | Moderate |
| Soil depth | 13 – 24 in |
| Surface fragment cover <=3" | 35 – 45% |
| Surface fragment cover >3" | 5 – 20% |
| Available water capacity (0-40in) |
1 – 3 in |
| Calcium carbonate equivalent (0-40in) |
15 – 35% |
| Electrical conductivity (0-40in) |
4 mmhos/cm |
| Sodium adsorption ratio (0-40in) |
Not specified |
| Soil reaction (1:1 water) (0-40in) |
7.9 – 9 |
| Subsurface fragment volume <=3" (Depth not specified) |
40 – 70% |
| Subsurface fragment volume >3" (Depth not specified) |
10 – 25% |
Ecological dynamics
Limy Slopes, 6'-9" p.z., is a widely dispersed desert shrubland. Natural disturbances are rare. After introduction of non-native annuals (forbs and/or grasses), the shift in total productivity with shift slightly toward seasonal herbaceous production following periods of rain. Livestock and wildlife use are limited on this site due steep slopes, low and dispersed forage production. Dominant shrubs are creosote and white bursage. Assorted half-shrubs are widely scattered.
State and transition model
More interactive model formats are also available.
View Interactive Models
Click on state and transition labels to scroll to the respective text
State 1 submodel, plant communities
State 2 submodel, plant communities
State 1
Historic Climax Plant Community
Community 1.1
Historic Climax Plant Community
The plant community of this state of the ecological site is a mixed desert shrub site with white bursage and creosote bush as the dominant species. There is a lesser, but significant amount, of white ratany. Fremont dalea and ephedra. Very little perennial grasses occur; perennial forbs desert globemallow and desert trumpet are usually present. During years of average or below precipitation, the herbage production is mainly from shrubs, while the annual grass and forb content is relatively small. In unusually wet years, the annual and perennial forb production may equal that of the shrubs. Some species of annuals are only seen in wet years. Typical perennial plant spacing is 2.0-2.75 feet.
Figure 4. Annual production by plant type (representative values) or group (midpoint values)
Table 5. Annual production by plant type
| Plant type | Low (lb/acre) |
Representative value (lb/acre) |
High (lb/acre) |
|---|---|---|---|
| Shrub/Vine | 92 | 160 | 300 |
| Forb | 7 | 25 | 67 |
| Grass/Grasslike | 1 | 15 | 33 |
| Total | 100 | 200 | 400 |
Figure 5. Plant community growth curve (percent production by month). AZ3022, 30.2 6-9" p.z. upland sites. Growth begins in the late winter, most growth occurs in the spring..
| Jan | Feb | Mar | Apr | May | Jun | Jul | Aug | Sep | Oct | Nov | Dec |
|---|---|---|---|---|---|---|---|---|---|---|---|
| J | F | M | A | M | J | J | A | S | O | N | D |
| 0 | 2 | 19 | 33 | 18 | 7 | 7 | 11 | 3 | 0 | 0 | 0 |
State 2
Historic Native Plant Community plus Introduced Annuals
Community 2.1
Non-Native Annuals
This plant community resembles the historic native plant community, but exotic annuals have been introduced. Non-native species include red brome, Mediterranean grass (Schismus spp.), and filaree. The flourish of non-native annuals that occurs following rainfalls may preclude native annuals.
Transition T1A
State 1 to 2
Introduction of non-native annual forb and grass seed.
Restoration pathway R2A
State 2 to 1
None known.
Additional community tables
Table 6. Community 1.1 plant community composition
| Group | Common name | Symbol | Scientific name | Annual production (lb/acre) | Foliar cover (%) | |
|---|---|---|---|---|---|---|
|
Grass/Grasslike
|
||||||
| 1 | 2–10 | |||||
| threeawn | ARIST | Aristida | 2–8 | – | ||
| big galleta | PLRI3 | Pleuraphis rigida | 2–8 | – | ||
| 2 | 0–4 | |||||
| Grass, perennial | 2GP | Grass, perennial | 0–2 | – | ||
| desert needlegrass | ACSP12 | Achnatherum speciosum | 0–2 | – | ||
| low woollygrass | DAPU7 | Dasyochloa pulchella | 0–2 | – | ||
| bush muhly | MUPO2 | Muhlenbergia porteri | 0–2 | – | ||
| sand dropseed | SPCR | Sporobolus cryptandrus | 0–2 | – | ||
| tridens | TRIDE | Tridens | 0–2 | – | ||
| 3 | 0–10 | |||||
| Grass, annual | 2GA | Grass, annual | 0–10 | – | ||
|
Forb
|
||||||
| 4 | 2–10 | |||||
| desert globemallow | SPAM2 | Sphaeralcea ambigua | 2–10 | – | ||
| 5 | 2–10 | |||||
| desert trumpet | ERIN4 | Eriogonum inflatum | 2–10 | – | ||
| 6 | 0–2 | |||||
| Forb, perennial | 2FP | Forb, perennial | 0–1 | – | ||
| trailing windmills | ALIN | Allionia incarnata | 0–1 | – | ||
| desert marigold | BAMU | Baileya multiradiata | 0–1 | – | ||
| sego lily | CANU3 | Calochortus nuttallii | 0–1 | – | ||
| brownplume wirelettuce | STPA4 | Stephanomeria pauciflora | 0–1 | – | ||
| 7 | 2–20 | |||||
| Forb, annual | 2FA | Forb, annual | 0–4 | – | ||
| mustard | BRASS2 | Brassica | 0–4 | – | ||
| cryptantha | CRYPT | Cryptantha | 0–4 | – | ||
| dyssodia | DYSSO | Dyssodia | 0–4 | – | ||
| buckwheat | ERIOG | Eriogonum | 0–4 | – | ||
| beardtongue | PENST | Penstemon | 0–4 | – | ||
| phacelia | PHACE | Phacelia | 0–4 | – | ||
| Ives' phacelia | PHIVP | Phacelia ivesiana var. pediculoides | 0–4 | – | ||
| desert Indianwheat | PLOV | Plantago ovata | 0–4 | – | ||
| primrose | PRIMU | Primula | 0–4 | – | ||
| woolly tidestromia | TILA2 | Tidestromia lanuginosa | 0–4 | – | ||
|
Shrub/Vine
|
||||||
| 8 | 50–80 | |||||
| burrobush | AMDU2 | Ambrosia dumosa | 50–80 | – | ||
| 9 | 30–60 | |||||
| creosote bush | LATR2 | Larrea tridentata | 30–60 | – | ||
| 10 | 20–40 | |||||
| Torrey's jointfir | EPTO | Ephedra torreyana | 10–20 | – | ||
| white ratany | KRGR | Krameria grayi | 10–20 | – | ||
| Fremont's dalea | PSFR | Psorothamnus fremontii | 10–20 | – | ||
| 11 | 2–10 | |||||
| staghorn cholla | CYVE3 | Cylindropuntia versicolor | 2–5 | – | ||
| echinocactus | ECHIN2 | Echinocactus | 2–5 | – | ||
| hedgehog cactus | ECHIN3 | Echinocereus | 2–5 | – | ||
| beavertail pricklypear | OPBA2 | Opuntia basilaris | 2–5 | – | ||
| 12 | 0–4 | |||||
| Joshua tree | YUBR | Yucca brevifolia | 0–4 | – | ||
| Mojave yucca | YUSC2 | Yucca schidigera | 0–4 | – | ||
| 13 | 2–6 | |||||
| Shrub, other | 2S | Shrub, other | 0–3 | – | ||
| catclaw acacia | ACGR | Acacia greggii | 0–3 | – | ||
| rayless goldenhead | ACSP | Acamptopappus sphaerocephalus | 0–3 | – | ||
| beehive cactus | CORYP | Coryphantha | 0–3 | – | ||
| brittlebush | ENFA | Encelia farinosa | 0–3 | – | ||
| button brittlebush | ENFR | Encelia frutescens | 0–3 | – | ||
| mormon tea | EPVI | Ephedra viridis | 0–3 | – | ||
| ocotillo | FOSP2 | Fouquieria splendens | 0–3 | – | ||
| broom snakeweed | GUSA2 | Gutierrezia sarothrae | 0–3 | – | ||
| burrobrush | HYSA | Hymenoclea salsola | 0–3 | – | ||
| littleleaf ratany | KRER | Krameria erecta | 0–3 | – | ||
| winterfat | KRLA2 | Krascheninnikovia lanata | 0–3 | – | ||
| woody crinklemat | TICA3 | Tiquilia canescens | 0–3 | – | ||
Interpretations
Recreational uses
Hiking, hunting, wildlife observation and photography.
Supporting information
Contributors
Larry D. Ellicott
Approval
Kendra Moseley, 10/21/2024
Rangeland health reference sheet
Interpreting Indicators of Rangeland Health is a qualitative assessment protocol used to determine ecosystem condition based on benchmark characteristics described in the Reference Sheet. A suite of 17 (or more) indicators are typically considered in an assessment. The ecological site(s) representative of an assessment location must be known prior to applying the protocol and must be verified based on soils and climate. Current plant community cannot be used to identify the ecological site.
| Author(s)/participant(s) | |
|---|---|
| Contact for lead author | |
| Date | 10/24/2024 |
| Approved by | Kendra Moseley |
| Approval date | |
| Composition (Indicators 10 and 12) based on | Annual Production |
Indicators
-
Number and extent of rills:
-
Presence of water flow patterns:
-
Number and height of erosional pedestals or terracettes:
-
Bare ground from Ecological Site Description or other studies (rock, litter, lichen, moss, plant canopy are not bare ground):
-
Number of gullies and erosion associated with gullies:
-
Extent of wind scoured, blowouts and/or depositional areas:
-
Amount of litter movement (describe size and distance expected to travel):
-
Soil surface (top few mm) resistance to erosion (stability values are averages - most sites will show a range of values):
-
Soil surface structure and SOM content (include type of structure and A-horizon color and thickness):
-
Effect of community phase composition (relative proportion of different functional groups) and spatial distribution on infiltration and runoff:
-
Presence and thickness of compaction layer (usually none; describe soil profile features which may be mistaken for compaction on this site):
-
Functional/Structural Groups (list in order of descending dominance by above-ground annual-production or live foliar cover using symbols: >>, >, = to indicate much greater than, greater than, and equal to):
Dominant:
Sub-dominant:
Other:
Additional:
-
Amount of plant mortality and decadence (include which functional groups are expected to show mortality or decadence):
-
Average percent litter cover (%) and depth ( in):
-
Expected annual annual-production (this is TOTAL above-ground annual-production, not just forage annual-production):
-
Potential invasive (including noxious) species (native and non-native). List species which BOTH characterize degraded states and have the potential to become a dominant or co-dominant species on the ecological site if their future establishment and growth is not actively controlled by management interventions. Species that become dominant for only one to several years (e.g., short-term response to drought or wildfire) are not invasive plants. Note that unlike other indicators, we are describing what is NOT expected in the reference state for the ecological site:
-
Perennial plant reproductive capability:
Print Options
Sections
Font
Other
The Ecosystem Dynamics Interpretive Tool is an information system framework developed by the USDA-ARS Jornada Experimental Range, USDA Natural Resources Conservation Service, and New Mexico State University.
Click on box and path labels to scroll to the respective text.