Natural Resources
Conservation Service
Ecological site R030XY160CA
Gypsic Terrace 5-7" p.z.
Last updated: 2/24/2025
Accessed: 04/04/2026
General information
Provisional. A provisional ecological site description has undergone quality control and quality assurance review. It contains a working state and transition model and enough information to identify the ecological site.
Ecological site concept
This site occurs on dry lake plains. Soils for this site are very deep, coarse-loamy soils derived from lacustrine deposits with a large calcium source from surrounding limestone mountains. Permeability is moderate and soils are well drained. Runoff is negligible. Soils classify as Leptic Haplogypsids.
Please refer to group concept R030XY129CA to view the provisional STM.
Associated sites
| R030XY162CA |
Salty Lakeplain 5-7" p.z. Occurs near the center of dry lake plains. |
|---|
Table 1. Dominant plant species
| Tree |
Not specified |
|---|---|
| Shrub |
(1) Atriplex confertifolia |
| Herbaceous |
Not specified |
Physiographic features
This site occurs on dry lake plains.
Table 2. Representative physiographic features
| Landforms |
(1)
Lake plain
|
|---|---|
| Flooding frequency | None |
| Ponding duration | Very brief (4 to 48 hours) to brief (2 to 7 days) |
| Ponding frequency | Rare to occasional |
| Elevation | 2,000 – 3,500 ft |
| Slope | 2% |
| Ponding depth | 1 in |
| Water table depth | 80 in |
| Aspect | Aspect is not a significant factor |
Climatic features
The Mojave Desert experiences clear, dry conditions for a majority of the year. Winter temperatures are mild, summer temperatures are hot, and seasonal and diurnal temperature fluctuations are large. Monthly minimum temperature averages range from 30 to 80 degrees F (-1 to 27 degrees C). Monthly maximum temperature averages range from 60 to 110 degrees F (16 to 43 degrees C) (CSU 2002).
Average annual rainfall is between 2 and 8 inches (50 to 205 millimeters) (USDA 2006). Snowfall is more common at elevations above 4000 feet (1220 meters), but it may not occur every year (WRCC 2002b). The Mojave Desert receives precipitation from two sources. Precipitation falls primarily in the winter as a result of storms originating in the northern Pacific Ocean. The Sierra Nevada and Transverse Ranges create a rain shadow effect, causing little precipitation to reach the Mojave Desert. Sporadic rainfall occurs during the summer as a result of convection storms formed when moisture from the Gulf of Mexico or Gulf of California moves into the region. Summer rainfall is more common and has a greater influence on soil moisture in the eastern Mojave Desert.
Windy conditions are also common in the Mojave Desert, particularly in the west and central Mojave Desert. Spring is typically the windiest season, with winds averaging 10-15 miles per hour (WRCC 2002a). Winds in excess of 25 miles per hour and gusts in excess of 50 miles per hour are not uncommon (CSU 2002).
In the BLM Grazing Allotments Soil Survey (Northeast Part of Mojave Desert Area, CA (CA805)), most areas receive approximately 5 to 7 inches of precipitation annually (WRCC 2002b). At elevations above 4000 feet (1370 meters), average annual precipitation in the form of rain may reach 8 inches or more, and average annual snowfall may reach up to 10 inches (WRCC 2002b).
The data from the following climate stations were used to describe the climate in the BLM Grazing Allotments Soil Survey (station number in parentheses):
Pahrump, NV (265890)
Mountain Pass, CA (045890)
Searchlight, NV (267369)
Red Rock Canyon State Park, NV (266691)
"Maximum monthly precipitation" represents average monthly precipitation at Pahrump, NV.
Table 3. Representative climatic features
| Frost-free period (average) | 240 days |
|---|---|
| Freeze-free period (average) | 282 days |
| Precipitation total (average) | 7 in |
Figure 1. Monthly average minimum and maximum temperature
Influencing water features
Soil features
Please refer to group concept R030XY129CA to view the provisional STM.
Soils for this site are very deep, coarse-loamy soils derived from lacustrine deposits with a large calcium source from surrounding limestone mountains. Permeability is moderate and soils are well drained. Runoff is negligible. Soils classify as Leptic Haplogypsids. These soils are found on older terraces above the actual lakebed, and as such do not act as the dominant sink on the landform. As such, soils on this landform are not saline or sodic as compared to nearby landforms. Calcium deposits from the limestone mountains have formed gypsum crystals over time. All surface and subsurface fragments are from gypsum crystals.
Soil survey area - Map unit symbol - Component
CA805 - 4765 - Leptic Haplogypsids
Table 4. Representative soil features
| Surface texture |
(1) Gypsiferous loam (2) Gypsiferous sandy loam |
|---|---|
| Family particle size |
(1) Loamy |
| Drainage class | Moderately well drained to well drained |
| Permeability class | Moderate to rapid |
| Soil depth | 60 – 80 in |
| Surface fragment cover <=3" | 20 – 50% |
| Surface fragment cover >3" | Not specified |
| Available water capacity (0-40in) |
2 – 6 in |
| Calcium carbonate equivalent (0-40in) |
1% |
| Electrical conductivity (0-40in) |
2 – 10 mmhos/cm |
| Sodium adsorption ratio (0-40in) |
10 |
| Soil reaction (1:1 water) (0-40in) |
8 – 8.2 |
| Subsurface fragment volume <=3" (Depth not specified) |
20 – 90% |
| Subsurface fragment volume >3" (Depth not specified) |
Not specified |
Ecological dynamics
The dominant species on this ecological site are shadscale (Atriplex confertifolia) and fourwing saltbush (Atriplex canescens). Shadscale is not known to have specific edaphic requirements (Simonin 2001). It occurs on both gypsum and non-gypsum substrates (Meyer 1986), as well as on saline and alkaline soils (Hodgkinson 1987). Fourwing saltbush tolerates saline, alkaline, and gypsum soils, but is not an indicator of these conditions (Howard 2003).
Gypsum is thought to affect plant growth more as a physical restriction rather than as a chemical one, particularly at the seedling stage (Meyer 1986).The large amount of gypsum crystals on this ecosite may make it difficult for many species to establish. A wide range of tolerance to different growing conditions (Howard 2003, Simonin 2001) and its ability to root where large gypsum crystals are present (Groff 1997) may have facilitated growth of Atriplex spp. on this ecosite.
This ecological site has relatively more sodium than adjacent ecological sites dominated by shadscale. In a greenhouse experiment, moderate sodium concentrations increased days to wilting, water use efficiency, and shoot production of fourwing saltbush in a drying soil (Glenn and Brown 1998). The higher amount of sodium on this ecosite relative to adjacent ones may be contributing to the higher abundance of fourwing saltbush on this ecosite.
Biological soil crusts—slow-growing complexes of fungi, lichen, moss, and cyanobacteria—may contribute up to 40% of the cover on this ecosite. Soil crusts indicate site stability, and recover slowly following disturbance (Belnap and Lange 2001). They moderate several processes that occur in the desert such as water and wind erosion (Belnap and others 2001). They act like a living mulch and slow evaporative water loss. They also affect soil fertility by increasing the available nitrogen in the soil. By occupying spaces between shrubs, biological soil crusts limit the establishment of invasive species that change disturbance regimes. The presence of biological soil crusts on this ecosite suggest that disturbance on this ecosite historically was not severe.
Wildfire has historically been rare in desert ecosystems due to low and widely spaced fuels. Red brome (Bromus rubens) and Mediterranean grass (Schismus arabicus) are present in small amounts on this ecosite. The high surface cover of gypsum crystals likely prevents rapid spread of these opportunistic species. However, the destruction of gypsum crystals by recreational vehicles or other disturbances will create bare soil surfaces in which these species may readily establish. Higher biomass production during years of high rainfall may create a more continuous, easily ignitable fuel source. Over time, sufficient biomass may build up and increase the risk that a fire will carry through the ecosite.
State and transition model
More interactive model formats are also available.
View Interactive Models
Click on state and transition labels to scroll to the respective text
Ecosystem states
State 1 submodel, plant communities
State 1
Shadscale - Fourwing Saltbush
Community 1.1
Shadscale - Fourwing Saltbush

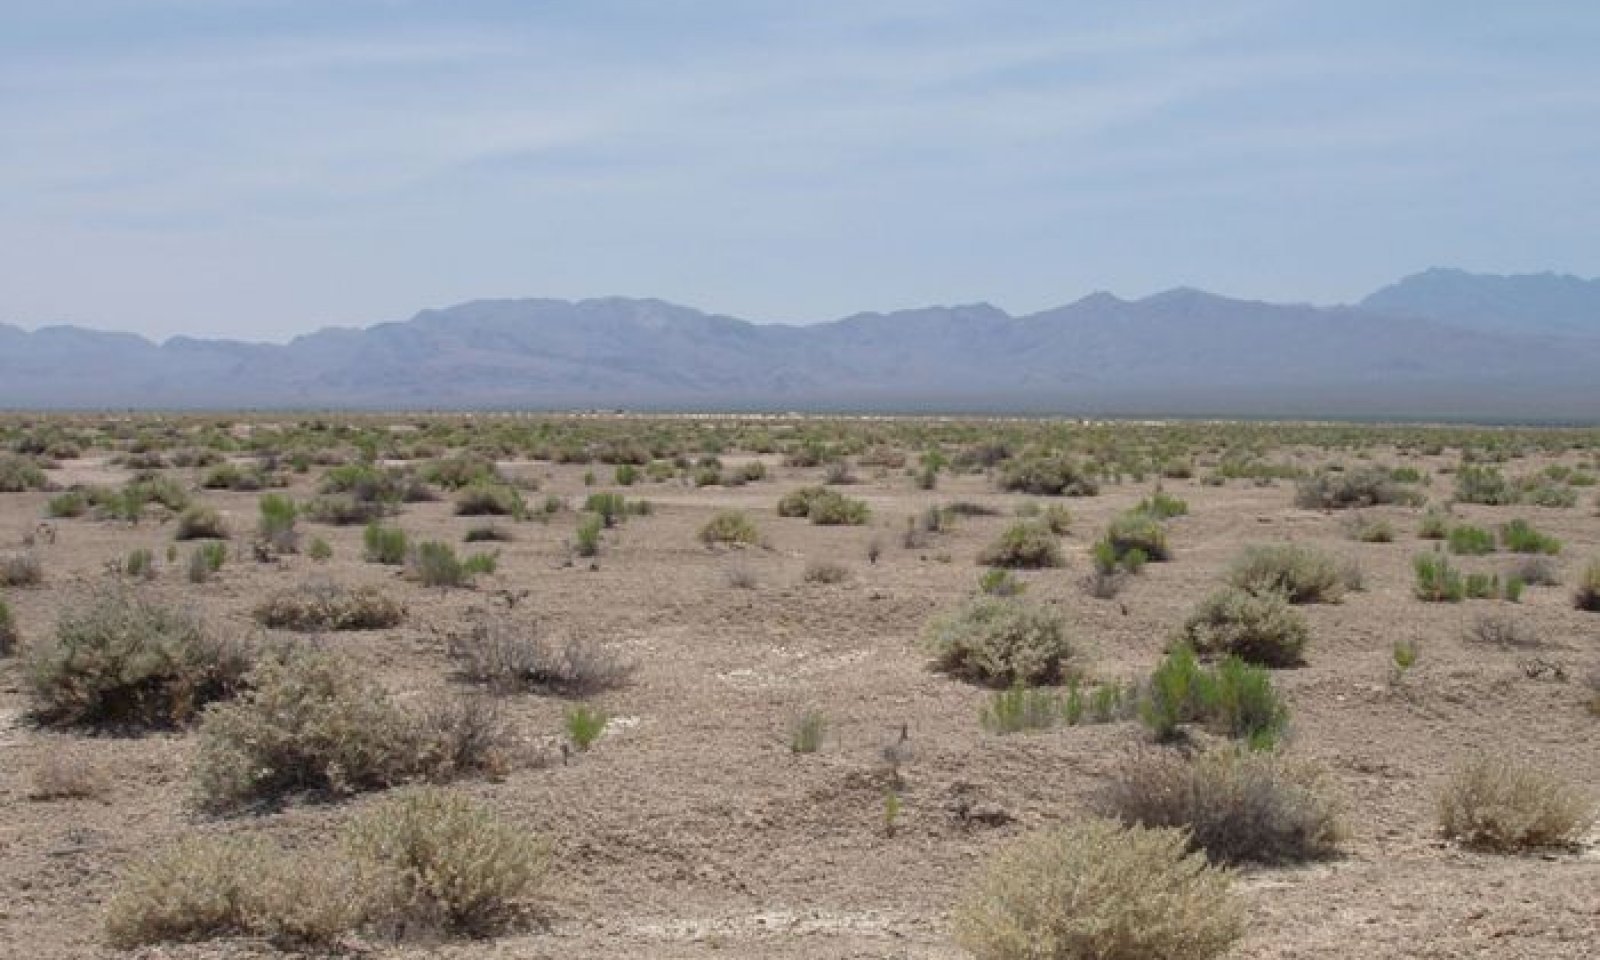
Figure 2. Shadscale-Fourwing Saltbush Scrub
The interpretive plant community is the reference plant community prior to European colonization. This vegetation community is largely dominated by shadscale (Atriplex confertifolia) and fourwing saltbush (Atriplex canescens). Minor shrubs include iodinebush (Allenrolfea occidentalis), Mojave seablite (Suaeda moquinii), big saltbush (Atriplex lentiformis), and desert princesplume (Stanleya pinnata). There is a modest showing of forbs after spring rains. Evidence of native grasses is not present on this ecosite. The potential plant composition is 97% perennial shrubs, 3% annual forbs.
Figure 3. Annual production by plant type (representative values) or group (midpoint values)
Table 5. Annual production by plant type
| Plant type | Low (lb/acre) |
Representative value (lb/acre) |
High (lb/acre) |
|---|---|---|---|
| Shrub/Vine | 125 | 220 | 292 |
| Forb | 0 | 5 | 8 |
| Total | 125 | 225 | 300 |
Table 6. Soil surface cover
| Tree basal cover | 0% |
|---|---|
| Shrub/vine/liana basal cover | 5-10% |
| Grass/grasslike basal cover | 0% |
| Forb basal cover | 0-1% |
| Non-vascular plants | 0% |
| Biological crusts | 10-40% |
| Litter | 0-1% |
| Surface fragments >0.25" and <=3" | 0% |
| Surface fragments >3" | 0% |
| Bedrock | 0% |
| Water | 0% |
| Bare ground | 40-60% |
Table 7. Canopy structure (% cover)
| Height Above Ground (ft) | Tree | Shrub/Vine | Grass/ Grasslike |
Forb |
|---|---|---|---|---|
| <0.5 | – | 5-15% | – | 0-1% |
| >0.5 <= 1 | – | 20-40% | – | 0-1% |
| >1 <= 2 | – | 20-40% | – | – |
| >2 <= 4.5 | – | 2-8% | – | – |
| >4.5 <= 13 | – | – | – | – |
| >13 <= 40 | – | – | – | – |
| >40 <= 80 | – | – | – | – |
| >80 <= 120 | – | – | – | – |
| >120 | – | – | – | – |
Additional community tables
Table 8. Community 1.1 plant community composition
| Group | Common name | Symbol | Scientific name | Annual production (lb/acre) | Foliar cover (%) | |
|---|---|---|---|---|---|---|
|
Shrub/Vine
|
||||||
| 1 | Perennial Shrubs | 125–292 | ||||
| shadscale saltbush | ATCO | Atriplex confertifolia | 83–180 | – | ||
| iodinebush | ALOC2 | Allenrolfea occidentalis | 15–35 | – | ||
| fourwing saltbush | ATCA2 | Atriplex canescens | 15–35 | – | ||
| Mojave seablite | SUMO | Suaeda moquinii | 10–24 | – | ||
| big saltbush | ATLE | Atriplex lentiformis | 0–12 | – | ||
| desert princesplume | STPI | Stanleya pinnata | 2–6 | – | ||
| phacelia | PHACE | Phacelia | 0–3 | – | ||
| mustard | BRASS2 | Brassica | 0–3 | – | ||
| flatcrown buckwheat | ERDE6 | Eriogonum deflexum | 0–2 | – | ||
|
Forb
|
||||||
| 1 | Annual Forbs | 0–8 | ||||
Interpretations
Animal community
Shadscale and fourwing saltbush are important forage species for both wildlife (Howard 2003, Simonin 2001) and livestock (Sampson and Jesperson 1963). Animals feed on the foliage and fruit, particularly during the winter when other forage is scarce.
Uncontrolled grazing may reduce cover of both species. Fourwing saltbush may be more susceptible to injury by uncontrolled grazing than shadscale. Spine-like branches limit the utilization of shadscale.
Hydrological functions
This ecological site occurs in low positions in the landscape, and water from adjacent areas will drain toward this area.
Recreational uses
Off-highway vehicle use occurs on this ecosite, the impacts of which may be severe. Cover of shrubs may be reduced by vehicle trampling. Gypsum crystals will likely be destroyed. The gypsum crystals on this site protect the surface soil structure, so destruction of this natural barrier will loosen the surface soil. The biological crusts that protect the soil surface are also fragile, easily damaged, and very slow to recover following a disturbance. Destruction of either soil surface stabilizer will likely lead to greater potential for wind erosion on this site.
Supporting information
Inventory data references
Species composition of this ecosite was estimated using 3 Range Inventory Worksheets (NV-ECS-1) in March and November 2005.
Productivity was sampled on 29 June 2005 using one double-weight sampling transect (SCS Range 417) at the type locality.
Type locality
| Location 1: San Bernardino County, CA | |
|---|---|
| UTM zone | N |
| UTM northing | 3955295 |
| UTM easting | 625688 |
| Latitude | 35° 44′ 1″ |
| Longitude | 115° 36′ 36″ |
| General legal description | The type site is located on Mesquite Lake in the BLM Clark Mountain Grazing Allotment. |
Other references
Belnap, J., J.H. Kaltenecker, R. Rosentreter, J. Williams, S. Leonard, D. Eldridge. 2001. Biological Soil Crusts: Ecology and Management. Technical Reference 1730-2. U.S. Department of the Interior, Bureau of Land Management and U.S. Geological Survey. Available: http://www.blm.gov/nstc/library/pdf/CrustManual.pdf. Accessed 5 October 2006.
Belnap, J. and O.L. Lange. 2001. Structure and functioning of biological soil crusts: a synthesis. In: Ecological Studies, Vol. 150. Belnap, J. and O.L. Lange (eds.). 2001. Biological Soil Crusts: Structure, Function, and Management. Springer-Verlag Berlin Heidelberg. pp. 471-479.
California State University (CSU) Desert Studies Center. 2002. Desert Climate. CSU Desert Studies Center, Soda Springs, CA. Online. http://biology.fullerton.edu/facilities/dsc/zz_climate.html. Accessed 28 November 2006.
Glenn, E.P. and J.J. Brown. 1998. Effects of soil salt levels on the growth and water use efficiency of Atriplex canescens (Chenopodiaceae) varieties in drying soil. American Journal of Botany 85(1):10-16.
Groff, Dale. 1997. Characteristics of gypsum soils in arid landscapes. Hortus West 8(1):10-52.
Howard, Janet L. 2003. Atriplex canescens. In: Fire Effects Information System, [Online]. U.S. Department of Agriculture, Forest Service, Rocky Mountain Research Station, Fire Sciences Laboratory (Producer). Available: http://www.fs.fed.us/database/feis/ [ 2006, November 15]..
Meyer, S.E. 1986. The ecology of gypsophile endemism in the Eastern Mojave Desert. Ecology 67(5):1303-1313.
Rundel, P.W. and A.C. Gibson. 1996. Ecological communities and processes in a Mojave Desert ecosystem: Rock Valley, Nevada. Cambridge University Press, New York. 369pp.
Sampson, A.W. and B.S. Jesperson. 1963. California range brushlands and browse plants. Publication 4010. Division of Agriculture and Natural Resources, University of California.
Simonin, Kevin A. 2001. Atriplex confertifolia. In: Fire Effects Information System, [Online]. U.S. Department of Agriculture, Forest Service, Rocky Mountain Research Station, Fire Sciences Laboratory (Producer). Available: http://www.fs.fed.us/database/feis/ [ 2006, November 15].
United States Department of Agriculture (USDA), Natural Resources Conservation Service. 2006. Land Resource Regions and Major Land Resource Areas of the United States, the Caribbean, and the Pacific Basin. U.S. Department of Agriculture Handbook 296.
Western Regional Climate Center (WRCC). 2002a. Average wind speeds by state (1992-2002). Desert Research Institute, Reno, NV. Online. http://www.wrcc.dri.edu/htmlfiles/westwind.final.html. Accessed 28 November 2006.
Western Regional Climate Center (WRCC). 2002b. Western U.S. Climate Historical Summaries [Online]. Desert Research Institute, Reno, NV. Online. http://www.wrcc.dri.edu/Climsum.html. Accessed 28 November 2006.
Locator map image generated using TopoZone.com © 1999-2004 Maps a la carte, Inc. - All rights reserved.
Contributors
Heath M. McAllister, Steven R. Perkins, Allison Tokunaga
Approval
Sarah Quistberg, 2/24/2025
Rangeland health reference sheet
Interpreting Indicators of Rangeland Health is a qualitative assessment protocol used to determine ecosystem condition based on benchmark characteristics described in the Reference Sheet. A suite of 17 (or more) indicators are typically considered in an assessment. The ecological site(s) representative of an assessment location must be known prior to applying the protocol and must be verified based on soils and climate. Current plant community cannot be used to identify the ecological site.
| Author(s)/participant(s) | |
|---|---|
| Contact for lead author | |
| Date | 02/26/2025 |
| Approved by | Sarah Quistberg |
| Approval date | |
| Composition (Indicators 10 and 12) based on | Annual Production |
Indicators
-
Number and extent of rills:
-
Presence of water flow patterns:
-
Number and height of erosional pedestals or terracettes:
-
Bare ground from Ecological Site Description or other studies (rock, litter, lichen, moss, plant canopy are not bare ground):
-
Number of gullies and erosion associated with gullies:
-
Extent of wind scoured, blowouts and/or depositional areas:
-
Amount of litter movement (describe size and distance expected to travel):
-
Soil surface (top few mm) resistance to erosion (stability values are averages - most sites will show a range of values):
-
Soil surface structure and SOM content (include type of structure and A-horizon color and thickness):
-
Effect of community phase composition (relative proportion of different functional groups) and spatial distribution on infiltration and runoff:
-
Presence and thickness of compaction layer (usually none; describe soil profile features which may be mistaken for compaction on this site):
-
Functional/Structural Groups (list in order of descending dominance by above-ground annual-production or live foliar cover using symbols: >>, >, = to indicate much greater than, greater than, and equal to):
Dominant:
Sub-dominant:
Other:
Additional:
-
Amount of plant mortality and decadence (include which functional groups are expected to show mortality or decadence):
-
Average percent litter cover (%) and depth ( in):
-
Expected annual annual-production (this is TOTAL above-ground annual-production, not just forage annual-production):
-
Potential invasive (including noxious) species (native and non-native). List species which BOTH characterize degraded states and have the potential to become a dominant or co-dominant species on the ecological site if their future establishment and growth is not actively controlled by management interventions. Species that become dominant for only one to several years (e.g., short-term response to drought or wildfire) are not invasive plants. Note that unlike other indicators, we are describing what is NOT expected in the reference state for the ecological site:
-
Perennial plant reproductive capability:
Print Options
Sections
Font
Other
The Ecosystem Dynamics Interpretive Tool is an information system framework developed by the USDA-ARS Jornada Experimental Range, USDA Natural Resources Conservation Service, and New Mexico State University.
Click on box and path labels to scroll to the respective text.