Natural Resources
Conservation Service
Ecological site R030XY230UT
Semidesert Shallow Hardpan (Blackbrush)
Accessed: 09/19/2024
General information
Provisional. A provisional ecological site description has undergone quality control and quality assurance review. It contains a working state and transition model and enough information to identify the ecological site.
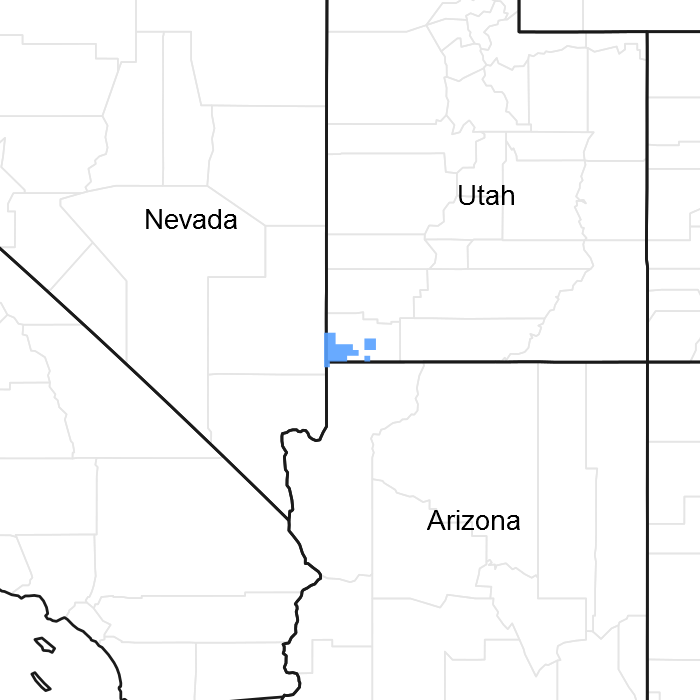
Figure 1. Mapped extent
Areas shown in blue indicate the maximum mapped extent of this ecological site. Other ecological sites likely occur within the highlighted areas. It is also possible for this ecological site to occur outside of highlighted areas if detailed soil survey has not been completed or recently updated.
Table 1. Dominant plant species
Tree |
Not specified |
---|---|
Shrub |
(1) Coleogyne ramosissima |
Herbaceous |
Not specified |
Physiographic features
Table 2. Representative physiographic features
Landforms |
(1)
Mountain slope
|
---|---|
Elevation | 3,200 – 4,300 ft |
Slope | 7 – 30% |
Climatic features
Table 3. Representative climatic features
Frost-free period (average) | 0 days |
---|---|
Freeze-free period (average) | 205 days |
Precipitation total (average) | 10 in |
Influencing water features
Soil features
Ecological dynamics
State and transition model
More interactive model formats are also available.
View Interactive Models
Click on state and transition labels to scroll to the respective text
Ecosystem states
State 1 submodel, plant communities
State 1
Reference State
Community 1.1
Reference State
This site is dominated by blackbrush (CORA). There is little evidence of a grass understory. Joshua tree is very evident in the aspect of the site. Important plants of this site in good condition are blackbrush, Nevada mormontea, big galleta, bush muhly, and globemallow.
Table 4. Ground cover
Tree foliar cover | 0-2% |
---|---|
Shrub/vine/liana foliar cover | 24-26% |
Grass/grasslike foliar cover | 2-4% |
Forb foliar cover | 0% |
Non-vascular plants | 0% |
Biological crusts | 0% |
Litter | 0% |
Surface fragments >0.25" and <=3" | 0% |
Surface fragments >3" | 0% |
Bedrock | 0% |
Water | 0% |
Bare ground | 0% |
Table 5. Canopy structure (% cover)
Height Above Ground (ft) | Tree | Shrub/Vine | Grass/ Grasslike |
Forb |
---|---|---|---|---|
<0.5 | – | – | – | – |
>0.5 <= 1 | – | – | 2-4% | – |
>1 <= 2 | – | 24-26% | – | – |
>2 <= 4.5 | – | – | – | – |
>4.5 <= 13 | 0-2% | – | – | – |
>13 <= 40 | – | – | – | – |
>40 <= 80 | – | – | – | – |
>80 <= 120 | – | – | – | – |
>120 | – | – | – | – |
Additional community tables
Interpretations
Wood products
None
Supporting information
Other references
Modal Soil: Cave GRSL, 7-30% Slopes – loamy, mixed, thermic, shallow Typic Paleorthid
Contributors
Tom Simper
Rangeland health reference sheet
Interpreting Indicators of Rangeland Health is a qualitative assessment protocol used to determine ecosystem condition based on benchmark characteristics described in the Reference Sheet. A suite of 17 (or more) indicators are typically considered in an assessment. The ecological site(s) representative of an assessment location must be known prior to applying the protocol and must be verified based on soils and climate. Current plant community cannot be used to identify the ecological site.
Author(s)/participant(s) |
Jack Alexander, Range Specialist, Synergy Resource Solutions, Inc. Julia Kluck, Soil Scientist, Synergy Resource Solutions, Inc. , Shane Green, NRCS |
---|---|
Contact for lead author | shane.green@ut.usda.gov |
Date | 02/07/2012 |
Approved by | Shane A. Green |
Approval date | |
Composition (Indicators 10 and 12) based on | Annual Production |
Indicators
-
Number and extent of rills:
No rills present. Very minor rill development may occur in sparsely vegetated areas. If rills are present, they should be widely spaced and not connected. Rill development may increase following large storm events, but should begin to heal during the following growing season. Frost heaving will accelerate recovery. Rill development may increase when run inflow enters site from adjacent sites that produce large amounts of runoff (i.e. steeper sites, slickrock, rock outcrop). Site is essentially level and rills do not form. -
Presence of water flow patterns:
Water flow patterns will be very short (1-3’), narrow (<1’), and meandering; interrupted by plants and exposed rocks. Slight to no evidence of erosion or deposition associated with flow patterns. Where slopes exceed 5%, water flow patterns may be of medium length (5 –10 feet). -
Number and height of erosional pedestals or terracettes:
Plants may have small pedestals (1-3”) where they are adjacent to water flow patterns, but without exposed roots. Terracettes should be few and stable. Terracettes should be small (1-3”) and show little sign of active erosion. Some plants may appear to have a pedestal but rather than be formed by erosion, they are the result of litter and soil accumulating at plant bases, forming the appearance of a pedestal. Well-developed biological crusts may appear pedestalled, but are actually a characteristic of the crust formation. -
Bare ground from Ecological Site Description or other studies (rock, litter, lichen, moss, plant canopy are not bare ground):
40-60% bare ground (soil with no protection from raindrop impact). Very few if any bare spaces of greater than 1 square foot. In general, bare ground increases as production decreases. As species composition of shrubs relative to grasses increases, bare ground is likely to increase. Poorly developed biological soil crust that is susceptible to erosion from raindrop impact should be recorded as bare ground. -
Number of gullies and erosion associated with gullies:
No gullies present. -
Extent of wind scoured, blowouts and/or depositional areas:
Very small areas (less than 4 square feet) may be present. Slight depositional mounding occurs at plant bases. Wind scour or deposition areas may be associated with fire activity. -
Amount of litter movement (describe size and distance expected to travel):
Most litter resides in place with some redistribution caused by water and wind movement. Very minor litter removal may occur in water flow paths with deposition occurring at points of obstruction. Where litter movement does occur, litter accumulates at plant bases. Some leaves, stems, and small twigs may accumulate in soil depressions adjacent to plants. Woody stems are not likely to move. -
Soil surface (top few mm) resistance to erosion (stability values are averages - most sites will show a range of values):
This site should have an erosion rating of 3 to 5 under plant canopies and a rating of 2 to 3 in the interspaces with an average rating of 3 using the soil stability kit test. -
Soil surface structure and SOM content (include type of structure and A-horizon color and thickness):
A1--0 to 2 inches; pale brown (10YR 6/3) gravelly sandy loam, brown (7.5YR 4/4) moist; weak thin platy structure parting to weak fine granular; slightly hard, friable, slightly sticky and slightly plastic; few fine roots; few very fine vesicular pores; many very fine tubular pores; strongly effervescent; slightly alkaline (pH 7.8); abrupt smooth boundary. (1 to 3 inches thick)
-
Effect of community phase composition (relative proportion of different functional groups) and spatial distribution on infiltration and runoff:
Shrubs and well-developed biological soil crusts provide most of the interception of rainfall that prevents erosion. Biological soil crusts are resistant to raindrop impact and splash erosion. Biological soil crusts also provide surface roughness that slows runoff, allowing time for infiltration. Bunchgrasses, if present, may contribute to slowing runoff, but canopy cover from bunchgrasses is too low to provide much rainfall interception. Interspaces between shrubs and biological soil crusts may serve as water flow paths during episodic runoff events, with natural erosion expected in severe storms. -
Presence and thickness of compaction layer (usually none; describe soil profile features which may be mistaken for compaction on this site):
A compaction layer is not expected, but a naturally-occurring hardpan in the soil profile may be mistaken for a compaction layer. Harpan layers have formed through natural soil-forming processes that result in the chemical cementation of soil particles. Compaction layers can be differentiated from hardpan layers through careful examination of the soil profile by knowledgeable individuals. -
Functional/Structural Groups (list in order of descending dominance by above-ground annual-production or live foliar cover using symbols: >>, >, = to indicate much greater than, greater than, and equal to):
Dominant:
Dominant: Shrubs (blackbrush, Nevada jointfir) > perennial warm-season grasses (big galleta, bush muhly)Sub-dominant:
Sub-dominant: trees (Joshua tree)Other:
Other: Other shrubs > other perennial grasses > perennial forbsAdditional:
-
Amount of plant mortality and decadence (include which functional groups are expected to show mortality or decadence):
During years with average to above average precipitation, there should be very little recent mortality or decadence apparent in either the shrubs or grasses. Some mortality of bunchgrass and other shrubs may occur during very severe (long-term) droughts. Long-lived species dominate the site. Open spaces from disturbance are quickly filled by new plants through seedlings and asexual reproduction (tillering). -
Average percent litter cover (%) and depth ( in):
Litter cover includes litter under plants. Most litter will be fine (herbaceous) litter. Almost all litter is concentrated under plant canopies. Litter between plant canopies is very sparse. Average litter cover is 5-15% and average litter depth is 0.25-0.5 inches. -
Expected annual annual-production (this is TOTAL above-ground annual-production, not just forage annual-production):
250-350 lbs/acre.
Even the most stable communities exhibit a range of production values. Production will vary between communities and across the MRLA. Refer to the community descriptions in the ESD. Production will differ across the MLRA due to the naturally occurring variability in weather, soils, and aspect. The biological processes on this site are complex; therefore, representative values are presented in a land management context.
-
Potential invasive (including noxious) species (native and non-native). List species which BOTH characterize degraded states and have the potential to become a dominant or co-dominant species on the ecological site if their future establishment and growth is not actively controlled by management interventions. Species that become dominant for only one to several years (e.g., short-term response to drought or wildfire) are not invasive plants. Note that unlike other indicators, we are describing what is NOT expected in the reference state for the ecological site:
Cheatgrass, halogeton, kochia, Russian thistle -
Perennial plant reproductive capability:
Reproduction restricted by effective precipitation, rock cover, soil depth, and generally harsh growing conditions; all to be expected for site. Site provides harsh environment for seedling establishment.
Print Options
Sections
Font
Other
The Ecosystem Dynamics Interpretive Tool is an information system framework developed by the USDA-ARS Jornada Experimental Range, USDA Natural Resources Conservation Service, and New Mexico State University.
Click on box and path labels to scroll to the respective text.