
Natural Resources
Conservation Service
Ecological site DX034A02X120
Limy Pinedale Plateau (Li PP)
Last updated: 9/28/2023
Accessed: 12/22/2024
General information
Provisional. A provisional ecological site description has undergone quality control and quality assurance review. It contains a working state and transition model and enough information to identify the ecological site.
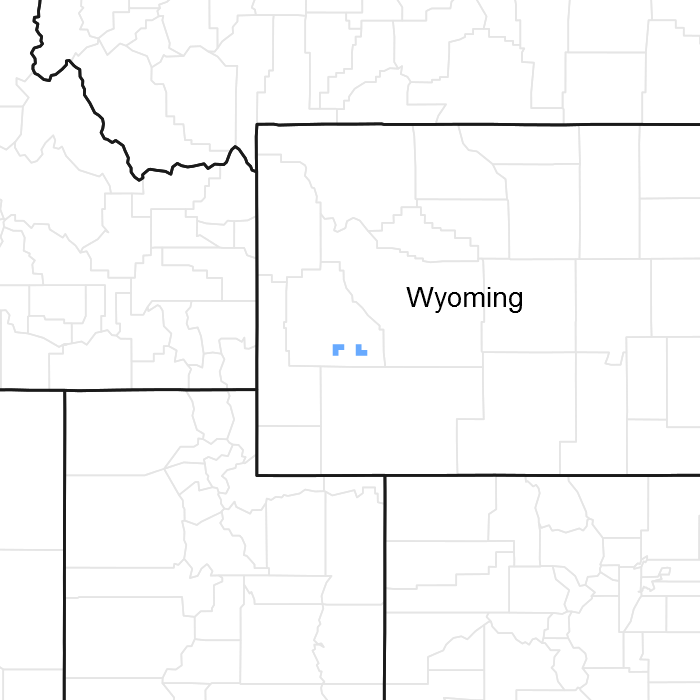
Figure 1. Mapped extent
Areas shown in blue indicate the maximum mapped extent of this ecological site. Other ecological sites likely occur within the highlighted areas. It is also possible for this ecological site to occur outside of highlighted areas if detailed soil survey has not been completed or recently updated.
MLRA notes
Major Land Resource Area (MLRA): 034A–Cool Central Desertic Basins and Plateaus
Site Type: Rangeland
Site ID: R034AC120WY
Site Name: Limy (Li)
Precipitation or Climate Zone: 9-12” Pinedale Plateau
Major Land Resource Area: 034A – Cool Central Desertic Basins and Plateaus
Further information regarding MLRA’s, refer to: http://soils.usda.gov/survey/geography/index.html
LRU notes
Land Resource Unit (LRU) 34A-C Pinedale Plateau:
• Moisture Regime: Aridic Ustic
• Temperature Regime: Frigid
• Dominate Cover: Rangeland
• Representative Value (RV) Effective Precipitation: 9-12 inches
• RV Frost-Free Days: 60-90 days
Classification relationships
Site Name: Limy Pinedale Plateau
Site Type: Rangeland
Site ID: R034AC120WY
Precipitation or Climate Zone: 9-12” P.Z.
Relationship to Other Established Classification Systems
National Vegetation Classification System (NVC):
3 Semi-Desert
3.B.1 Cool Semi-Desert Scrub & Grassland
3.B.1.Ne Western North American Cool Semi-Desert Scrub & Grassland Division
M171 Great Basin-Intermountain Dry Shrubland and Grassland Macrogroup
G310 Intermountain Semi-Desert Steppe and Shrubland Group
A3202 Winterfat Steppe and Dwarf-shrubland Alliance
CEGL001323 Krascheninnokovia lanata/Achnatherum hymenoides Dwarf-shrubland
Ecoregions (EPA):
Level I: 10 North American Deserts
Level II: 10.1 Cold Deserts
Level III: 10.1.4 Wyoming Basin
Ecological site concept
• Site does not receive additional water
• Soils are:
o Not saline or saline-sodic (<4 mmhos/cm)
o deep, or very deep Is it ever moderately deep?
o 15-35% channers and gravel cover on surface
o Not skeletal within 20” of soil surface
o Are strongly or violently effervescent starting at the soil surface
o Have a CCE of 15% or greater to the soil surface
o Textures usually range from loam to sandy clay loam in surface mineral 4”
• Slope is <15%
• Clay content ranges from 18% to 25% in surface horizon
• Site does not have an argillic horizon with >35% clay does not have an argillic horizon
The concept of this site is based on the presence of secondary and primary carbonates that exist throughout the entire profile (strong to violent effervescence starting at the soil surface), but that does not have a strongly pronounced diagnostic calcic horizon (an illivual horizon in which secondary carbonate or other carbonates have accumulated to a significant extent). A similar site is the Loamy, calcareous site which does not have strong or violent effervescence in the upper part of the profile but does have the presence of a well developed calcic horizon at depths ranging from 3 to 8 inches from the mineral soil surface. Characteristic of this site is a soil profile lacking any distinct horizonation, and is located directly adjacent to soils with more visible soil development. It is currently thought that this site is a result of geomorphic and climatological conditions resulting in periglacial activity and the subsequent development of the patterned landscape that we see today.
Associated sites
| DX034A02X124 |
Loamy Argillic Pinedale Plateau (LyA PP) |
|---|---|
| DX034A02X126 |
Loamy Calcareous Pinedale Plateau (LyCa PP) |
| DX034A02X122 |
Loamy Pinedale Plateau (Ly PP) |
Similar sites
| DX034A02X126 |
Loamy Calcareous Pinedale Plateau (LyCa PP) Loamy Calcareous Pinedale Plateau R034AC126WY is higher in production and lacks the calcic properties in the soil surface. This site has a calcic horizon at a depth of 5-15”. |
|---|---|
| R034AY263WY |
Shallow Loamy Calcareous Foothills and Basins West (SwLyCa) Shallow Loamy Calcareous (Foothills and Basins West) R034AY263WY is often skeletal (or has a high amount of rock fragments at least at the surface) and engulfed in carbonates at a depth 5-15”. |
| DX034A01X126 |
Loamy Calcareous Green River Basin (LyCa GRB) Loamy Calcareous Green River Basin R034AB126WY has similar soil characteristics to R034AC126WY (lacks calcic properties in soil surface), but is drier and slightly warmer. |
Table 1. Dominant plant species
| Tree |
Not specified |
|---|---|
| Shrub |
(1) Krascheninnikovia lanata |
| Herbaceous |
(1) Elymus elymoides |
Legacy ID
R034AC120WY
Physiographic features
The Limy Pinedale Plateau (Li PP) ecological site (R034AC120WY) is located within MLRA “34A”. This ecological site occurs in intermontane basin landscapes on hill, draw, pediment, and fan remnant landforms (see definitions below). The slope ranges from level to 15%. The predominant condition is <5% and so this site is largely aspect neutral.
fan remnant – A general term for landforms that are the remaining parts of older fan-landforms, such as alluvial fans, fan aprons, inset fans, and fan skirts, that either have been dissected (erosional fan-remnants) or partially buried (nonburied fan-remnants). An erosional fan remnant must have a relatively flat summit that is a relict fan-surface.
intermontane basin – A generic term for wide structural depressions between mountain ranges that are partly filled with alluvium and called "valleys" in the vernacular.
hills – A landscape dominated by hills and associated valleys. The landform term is singular (hill).
Predominant Landforms: (1) Fan remnant
(2) Hill
(3) Mesa
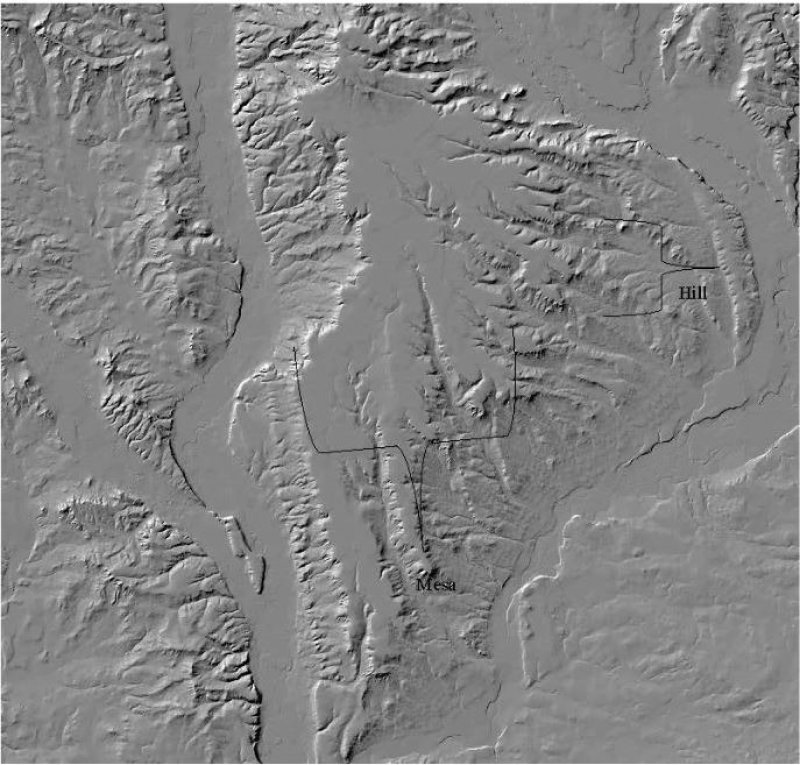
Figure 2.
Table 2. Representative physiographic features
| Landforms |
(1)
Hill
(2) Fan remnant (3) Mesa |
|---|---|
| Flooding frequency | None |
| Ponding frequency | None |
| Elevation | 1,981 – 2,286 m |
| Slope | 0 – 15% |
| Water table depth | 152 cm |
| Aspect | Aspect is not a significant factor |
Climatic features
Annual precipitation ranges from 9-12 inches per year. Wide fluctuations may occur in yearly precipitation and result in more dry years than those with more than normal precipitation. Temperatures show a wide range between summer and winter and between daily maximums and minimums. This is predominantly due to the high elevation and dry air, which permits rapid incoming and outgoing radiation. Cold air outbreaks in winter move rapidly from northwest to southeast and account for extreme minimum temperatures. Much of the precipitation accumulation (45%) comes in the winter in the form of snow (Oct to April). The wettest month is May (1.26 inches). The growing season is short (<60 day) and cool (critical growth period): primary growth typically occurs between May and June. The dominant plants (sagebrush and cool season grasses) are well adapted to these conditions. Daytime winds are generally stronger than nighttime and occasional strong storms may bring brief periods of high winds with gusts to more than 50 mph. Growth of native cool season plants begins about mid-April and continues to approximately early-July. Some green up of cool season plants usually occurs in September with adequate fall moisture.
Table 3. Representative climatic features
| Frost-free period (average) | 36 days |
|---|---|
| Freeze-free period (average) | 64 days |
| Precipitation total (average) | 279 mm |
Figure 3. Monthly precipitation range
Figure 4. Monthly average minimum and maximum temperature
Climate stations used
-
(1) BOULDER REARING STN [USC00480951], Boulder, WY
-
(2) PINEDALE [USC00487260], Pinedale, WY
Influencing water features
NONE
Soil features
The soils of this site are deep to very deep (greater than 20" to bedrock), and well-drained. Textures range from fine sandy loam to a light clay loam. The most common textures include sandy clay loam and fine sandy loam. A highly common scenario is to have a 1 to 3” cap of sandy loam over a sandy clay loam due to young soil development of weathered sandstone and shale parent materials.
Major Soil Series correlated to this site includes: Figuore series.
Typical taxonomy: coarse-loamy, mixed, superactive, frigid Aridic Calciustepts
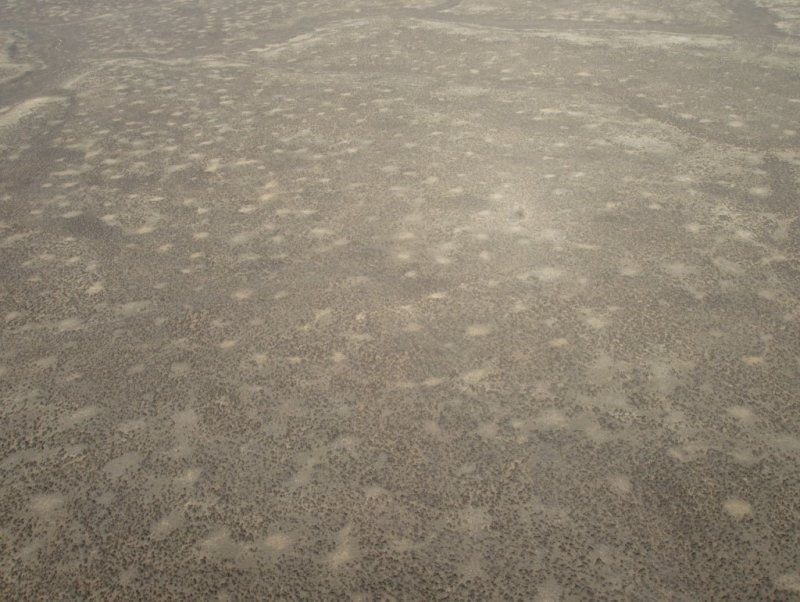
Figure 5.
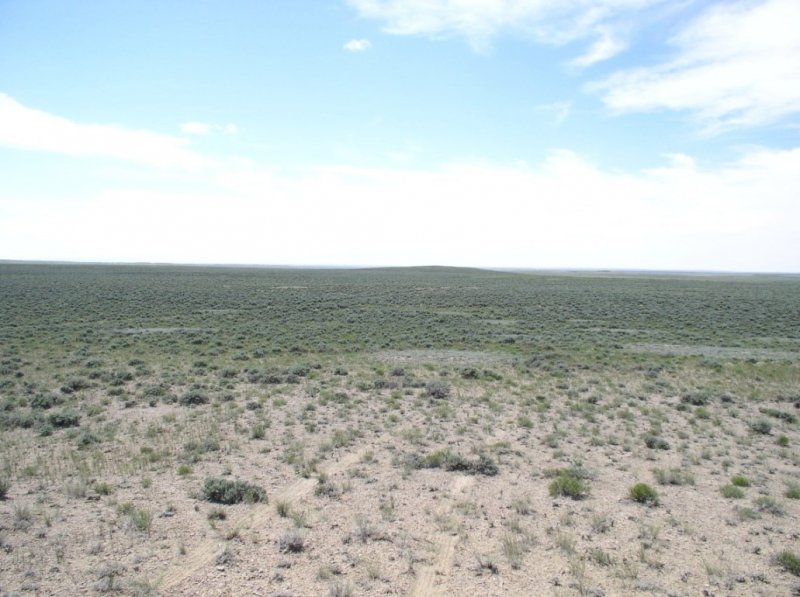
Figure 6.
Table 4. Representative soil features
| Parent material |
(1)
Residuum
–
sandstone and shale
(2) Slope alluvium – limestone |
|---|---|
| Surface texture |
(1) Gravelly sandy loam (2) Fine sandy loam (3) Loam |
| Family particle size |
(1) Coarse-loamy |
| Drainage class | Well drained |
| Permeability class | Moderately rapid to moderate |
| Soil depth | 152 cm |
| Surface fragment cover <=3" | 0 – 15% |
| Surface fragment cover >3" | 0 – 5% |
| Available water capacity (0-101.6cm) |
9.14 – 19.3 cm |
| Calcium carbonate equivalent (0-101.6cm) |
15 – 55% |
| Electrical conductivity (0-101.6cm) |
0 – 4 mmhos/cm |
| Sodium adsorption ratio (0-101.6cm) |
0 – 5 |
| Soil reaction (1:1 water) (0-101.6cm) |
7.8 – 8.8 |
| Subsurface fragment volume <=3" (Depth not specified) |
0 – 25% |
| Subsurface fragment volume >3" (Depth not specified) |
0 – 5% |
Ecological dynamics
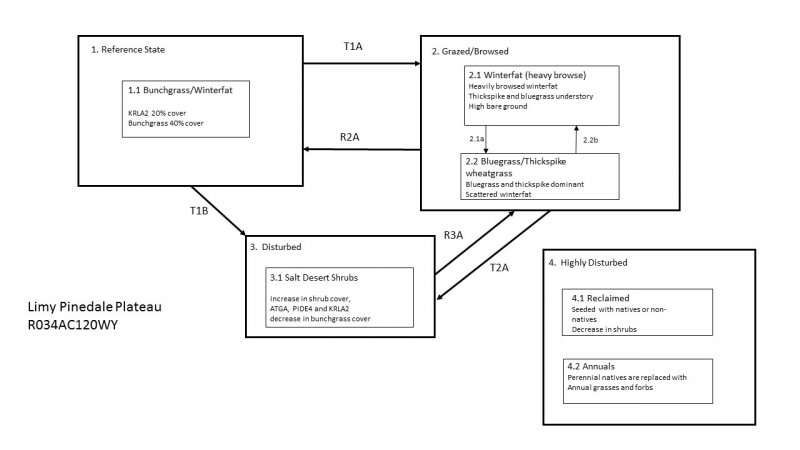
This ecological site is dominated (species composition by dry weight) by mid-size, cool season perennial grasses and winterfat, with forbs as a minor component. The site consists of four states: the Reference State (1), Grazed/Browsed State (2), Disturbed State (3), and Highly Disturbed State (4).
The Reference State consists of one plant community that exists on a continuum relative to disturbances, primarily grazing, pests, and drought. This plant community represents the best adapted plant community for the soils and climate found on the site, and it represents the best estimation of ecological dynamics present on this site at the time of European settlement.
The Reference Plant Community (bunchgrass/winterfat) of this site is dominated by mid-sized cool-season perennial bunchgrass species, primarily Indian Ricegrass (Achnatherum hymenoides) and bottlebrush squirreltail (Elymus elymoides), and winterfat (Krasheninnikovia lanata). Minor components include rhizomatous grasses like thickspike wheatgrass (Elymus lanceolatus ssp. lanceolatus) and short-statured bunchgrasses such as Sandberg bluegrass (Poa secunda), perennial forbs, and shrubs, including Gardiner’s saltbush (Artiplex gardneri).
Mid- stature bunchgrasses act as decreaser species in the Reference Community. Low stature bunchgrasses and rhizomatous grasses tolerate higher grazing pressure (USDA/NRCS 2007) than mid-sized bunchgrasses. They often fill in the vegetation gaps created when mid stature bunchgrasses decline, hence, collectively referred to as increaser species.
Big sagebrush, is the dominant shrub on this site. Most often Wyoming big sagebrush is the sub-species present, but this transitions to mountain big sagebrush (Artemisia tridentata ssp. vaseyana) at the upper end of the precipitation range for this site (12+ inches). Snow catchment is a significant hydrologic component of this site, and the hydrology changes when shrubs are removed from this site.
Prior to the introduction of livestock (cattle and sheep) during the late 1800s, elk, mule deer, and pronghorn grazed this ecological site, primarily as winter and transitional range (early spring, late fall). Significant livestock grazing has occurred on most of this ecological site for more than 100 years. The Trans- Continental Railroad in the 1860s brought the first herds, and homesteaders began settling the area through the turn of the century. Livestock grazing in this region has historically been cattle. In fact, early grazers established a “Deadline” from Fontenelle Creek across the desert to the Big Sandy River and sheep grazing was not allowed north of this line. Sheep crossing the line often died of plant poisoning from plants that were left lying along the boundary line by cattlemen. (Sommers, 1994)
Without ground disturbing activities, this site is relatively free of invasive weeds, but once mechanically or physically disturbed it is prone to weed invasion, primarily by annuals such as halogeton (Halogeton glomeratus), lambsquarter (Chenopodium album), Russian thistle (Salsola kali), flixweed (Descurainia sophia), and kochia (Bassia scoparia). Soil disturbance can be caused by vehicles, equipment, severe over-utilization of the herbaceous vegetation, or large amounts of bare ground created by extended drought conditions combined with over-utilization. Cheatgrass (Bromus tectorum), an invasive winter annual grass from the Mediterranean region, has been increasing in recent years, particularly on highly disturbed sites with higher rock fragment (i.e. roads, gravel pits, etc.). There are many challenges in controlling with this invasive grass and its impacts on plant communities, livestock grazing, and wildlife habitat. Recent publications have classified this soil temperature and moisture regime as moderately resilient and resistant to invasive species (Chambers et.al, 2016), but localized conditions on this ecological site result in relatively higher resilience and resistance to invasion, compared to adjacent sites due to the high levels of calcium carbonates on the site.
Plant Communities and Transitional Pathways
Thorough descriptions of each state, transition, plant community, and pathway are found after the model in this document. Experts base this model on available experimental research, field observations, professional consensus, and interpretations. While based on the best available information, the STM will change over time as knowledge of ecological processes increases.
Plant communities within the same ecological site differ across the LRU due to the naturally occurring variability in weather, soils, and aspect. Not all managers will choose the reference community as the management goal. Other plant communities may be desired to meet land management objectives. This is valid as long as the Rangeland Health attributes assessment departures are slight to moderate or none to slight for the Reference State. The biological processes on this site are complex; therefore, representative values are presented in a land management context. The species lists are representative and are not a floristic inventory of all species occurring, or potentially occurring, on this site. They are not intended to cover every situation or the full range of conditions, species, and responses for the site.
Both percent species composition by weight and percent canopy cover are used in this ESD. Foliar cover drives the transitions between communities and states because of the influence of shade and interception of rainfall. Species composition by dry weight remains an important descriptor of the herbaceous community and of site productivity as a whole. Woody species are included in species composition by weight for the site. Calculating similarity index requires use of species composition by dry weight.
Although there is considerable qualitative experience supporting the pathways and transitions within the State and Transition Model (STM), no quantitative information exists that specifically identifies threshold parameters between reference states and degraded states in this ecological site. For information on STMs, see the following citations: (Bestelmeyer B. B., 2003), (Bestelmeyer B. H., 2004), (Bestelmeyer B. &., 2005), (Stringham, 2003).
Plant Preference Table:
https://docs.google.com/viewera=v&pid=sites&srcid=ZGVmYXVsdGRvbWFpbnxtbHJhMzRhfGd4OjIyZWEyYzIyMGE5NWE4MzM
State and transition model
More interactive model formats are also available.
View Interactive Models
Click on state and transition labels to scroll to the respective text
State 1 submodel, plant communities
State 3 submodel, plant communities
State 4 submodel, plant communities
State 1
Reference State
Community 1.1
Bunchgrass/Winterfat

The Limy site potential is less than the Loamy and Loamy Calcareous site in this LRU, due to the restrictive nature of the calcium carbonate levels that occurs on it. The Bunchgrass/Winterfat Plant Community is well adapted to Cool Central Desertic Basins and Plateaus climatic conditions. The diversity in plant species allows for drought tolerance, and natural plant mortality is very low. These plants have strong, healthy root systems that allow production to increase with favorable moisture conditions. Plant litter is limited for soil building and moisture retention. However, plant litter is properly distributed with very little movement off-site. This plant community provides for soil stability and a properly functioning hydrologic cycle. The soils associated with this site are somewhat limited in the amount of soil moisture it can hold due to the calcium carbonate levels throughout the soil profile, resulting in a unique plant community in this LRU. The Bunchgrass/Winterfat Community (1.1) occurs sporadically across a landscape in a mosaic pattern intermixed mostly with the Loamy and Loamy Calcareous sites, and with other sites less frequently. This community can occur over long time periods with or without disturbances, but can be accelerated with added grazing and browsing pressure. Cool season bunchgrasses are dominant in the Bunchgrass/Winterfat Community (1.1) with foliar cover ranging from 40% to 65%.
Dominant plant species
-
winterfat (Krascheninnikovia lanata), shrub
-
squirreltail (Elymus elymoides), grass
-
Indian ricegrass (Achnatherum hymenoides), grass
Figure 7. Annual production by plant type (representative values) or group (midpoint values)
Table 5. Annual production by plant type
| Plant type | Low (kg/hectare) |
Representative value (kg/hectare) |
High (kg/hectare) |
|---|---|---|---|
| Grass/Grasslike | 196 | 308 | 420 |
| Shrub/Vine | 157 | 247 | 336 |
| Forb | 39 | 62 | 84 |
| Total | 392 | 617 | 840 |
Table 6. Ground cover
| Tree foliar cover | 0% |
|---|---|
| Shrub/vine/liana foliar cover | 0% |
| Grass/grasslike foliar cover | 0% |
| Forb foliar cover | 0% |
| Non-vascular plants | 0% |
| Biological crusts | 0% |
| Litter | 35-55% |
| Surface fragments >0.25" and <=3" | 0% |
| Surface fragments >3" | 0% |
| Bedrock | 0% |
| Water | 0% |
| Bare ground | 10-25% |
Figure 8. Plant community growth curve (percent production by month). WY0301, 34AC, Upland Sites. All Upland Sites.
| Jan | Feb | Mar | Apr | May | Jun | Jul | Aug | Sep | Oct | Nov | Dec |
|---|---|---|---|---|---|---|---|---|---|---|---|
| J | F | M | A | M | J | J | A | S | O | N | D |
| 5 | 40 | 50 | 5 |
State 2
Grazed/Browsed
The Winterfat (Heavy Browse) Plant Community (2.1) is characterized by browsed winterfat, high bare ground and an herbaceous component dominated by thickspike wheatgrass and Sandberg bluegrass, with limited mid-stature bunchgrasses. Once mid stature bunchgrasses become scarce, it is unlikely there will be sufficient reproductive capability (seed source, tillering, or resprouting) to recover dominance in a reasonable time frame without extra energy being added to the system. The plant community is highly resistant to changes in composition, due to the dominance and competition of established grazing resistant species. However, the community can be restored to the Reference State over time with decreased herbivory, possibly seeding, and time. Winterfat dominates with cover as high as 25% or higher. The dominant shrub/subshrub is Winterfat. Production potential is lower than in Reference State (1), and is somewhat variable, fluctuating in response to drought and wet cycles. Lower soil organic matter content leads to lower soil stability than in the Reference State. Ground cover is reduced. Infiltration is lower than in the Reference State and the water cycle has reduced function due to decreased soil organic matter.
Community 2.1
Winterfat (heavy browse)
Heavily browsed winterfat
Thickspike and bluegrass understory
High bare ground
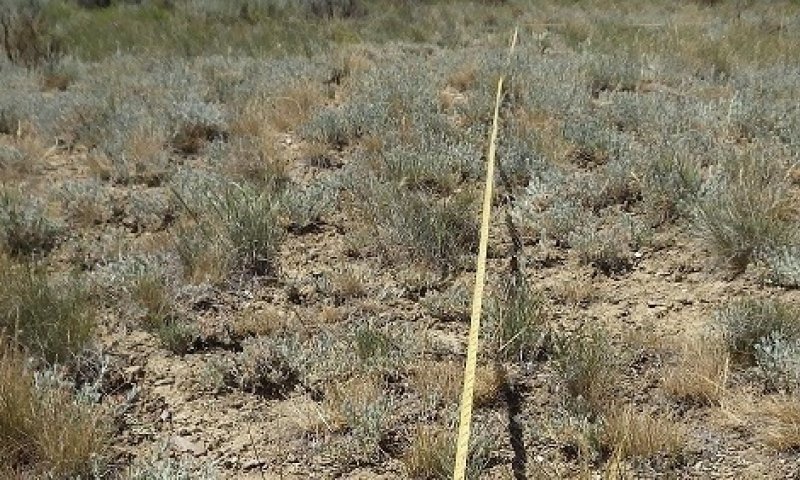
The Winterfat (Heavy Browse) Plant Community (2.1) is characterized by browsed winterfat, high bare ground and an herbaceous component dominated by thickspike wheatgrass and Sandberg bluegrass, with limited mid-stature bunchgrasses. Once mid stature bunchgrasses become scarce, it is unlikely there will be sufficient reproductive capability (seed source, tillering, or resprouting) to recover dominance in a reasonable time frame without extra energy being added to the system. The plant community is highly resistant to changes in composition, due to the dominance and competition of established grazing resistant species. However, the community can be restored to the Reference State over time with decreased herbivory, possibly seeding, and time. Winterfat dominates with cover as high as 25% or higher. The dominant shrub/subshrub is Winterfat. Production potential is lower than in Reference State (1), and is somewhat variable, fluctuating in response to drought and wet cycles. Lower soil organic matter content leads to lower soil stability than in the Reference State. Ground cover is reduced. Infiltration is lower than in the Reference State and the water cycle has reduced function due to decreased soil organic matter.
Figure 9. Annual production by plant type (representative values) or group (midpoint values)
Table 7. Annual production by plant type
| Plant type | Low (kg/hectare) |
Representative value (kg/hectare) |
High (kg/hectare) |
|---|---|---|---|
| Shrub/Vine | 123 | 247 | 340 |
| Grass/Grasslike | 78 | 157 | 215 |
| Forb | 22 | 45 | 62 |
| Total | 223 | 449 | 617 |
Table 8. Ground cover
| Tree foliar cover | 0% |
|---|---|
| Shrub/vine/liana foliar cover | 0% |
| Grass/grasslike foliar cover | 0% |
| Forb foliar cover | 0% |
| Non-vascular plants | 0% |
| Biological crusts | 0% |
| Litter | 10-35% |
| Surface fragments >0.25" and <=3" | 0% |
| Surface fragments >3" | 0% |
| Bedrock | 25-50% |
| Water | 0% |
| Bare ground | 0% |
Figure 10. Plant community growth curve (percent production by month). WY0301, 34AC, Upland Sites. All Upland Sites.
| Jan | Feb | Mar | Apr | May | Jun | Jul | Aug | Sep | Oct | Nov | Dec |
|---|---|---|---|---|---|---|---|---|---|---|---|
| J | F | M | A | M | J | J | A | S | O | N | D |
| 5 | 40 | 50 | 5 |
Community 2.2
Bluegrass/Thickspike wheatgrass
Bluegrass and thickspike dominant
Scattered winterfat
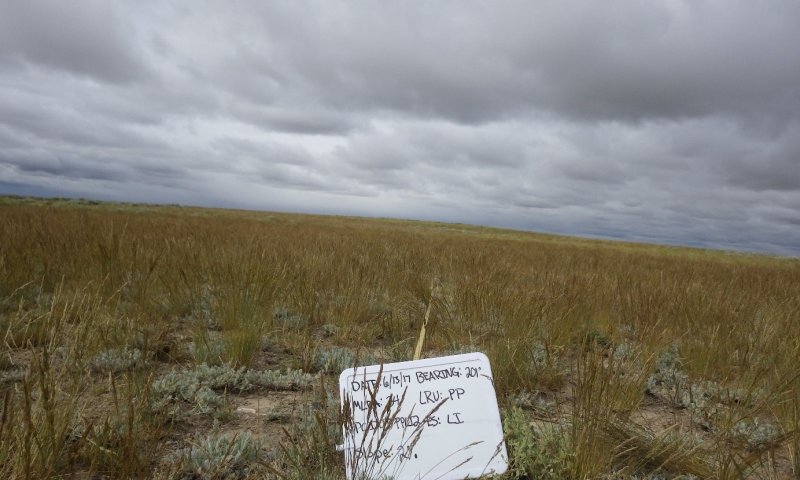
The Bluegrass/Thickspike Wheatgrass Community (2.2) is characterized by an herbaceous component dominated by Sandberg bluegrass, thickspike wheatgrass, and/or mat-forming forbs, with limited mid-stature bunchgrasses. Once these key mid-stature species become scarce, it is unlikely to have sufficient reproductive capability (seed source, tillering, or re-sprouting) to recover dominance in a reasonable time frame without extra energy being added to the system. The plant community is highly resistant to changes in composition, due to the dominance and competition of grazing tolerant species. However, the community may shift back to the Reference State (1) with grazing deferment followed by a grazing system that allows periodic rest during the critical growth period. Seeding may be needed to achieve desired results. Sandberg Bluegrass (Poa secunda) and/or Thickspike wheatgrass (Elymus lanceolatus ssp. lanceolatus) dominate, and winterfat foliar cover is typically 10% to 20%. This plant community phase occurs with continued herbivory/browse after the herbaceous component has already been degraded. Productivity is highly variable and fluctuates in response to drought and wet cycles. Production is similar to the Reference State (1), however, plant composition changes have occurred leading to lower soil organic matter content and therefore lower soil stability than in the Reference State.
Figure 11. Annual production by plant type (representative values) or group (midpoint values)
Table 9. Annual production by plant type
| Plant type | Low (kg/hectare) |
Representative value (kg/hectare) |
High (kg/hectare) |
|---|---|---|---|
| Grass/Grasslike | 135 | 269 | 370 |
| Shrub/Vine | 67 | 135 | 185 |
| Forb | 22 | 45 | 62 |
| Total | 224 | 449 | 617 |
Pathway 2.1a
Community 2.1 to 2.2


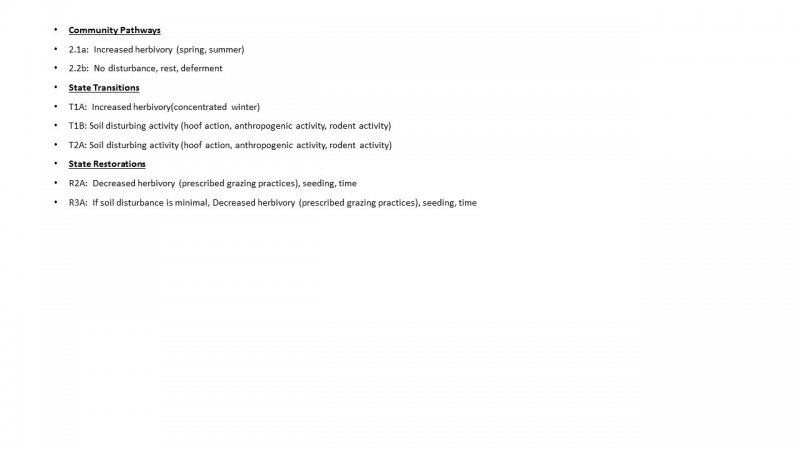
Increase herbivory (spring, summer) The trigger for a community shift from the Winterfat (Heavy Browse) Community (2.1) to the Bluegrass/Thickspike Wheatgrass Community (2.2) is a decrease in herbaceous herbivory and increase in browsing of winterfat (change in season of use). Without a change in grazing regime, the existing understory will respond, but mid-stature bunchgrasses will not increase. Fire is not typically a driver in this State due to reduced fine fuels.
Pathway 2.2b
Community 2.2 to 2.1


No disturbance, rest, deferment The trigger for a community shift from the Bluegrass/Thickspike Wheatgrass Community (2.2) to the Winterfat (Heavy Browse) Community (2.1) is an increase in spring/summer grazing in conjunction with winter/fall browsing animals. With relatively high amounts of nutrition in winterfat these areas tend to have higher winter use by wildlife, livestock and wild horses. (Rasmussen, 1986)
State 3
Disturbed
This state contains one community, the Salt-Desert Shrub Community (3.1). It is characterized by sparse herbaceous plant cover dominated by salt desert shrubs and bare ground. Communities in the Disturbed State (3) have crossed a threshold because of soil erosion, loss of soil fertility, and/or degradation of soil properties. Soil erosion affects the hydrology, soil chemistry, soil microorganisms, and soil physics to the point where intensive restoration is required to restore the site to another state or community. Simply changing grazing management may not create sufficient change to restore the site within a reasonable period. It will require a considerable input of energy to move the site back to the Reference State (1). The Disturbed State (3) is at risk of weed invasion due to the high percentage of bare ground, but climatic conditions contribute to higher resistance to invasion.
Community 3.1
Salt Desert Shrubs
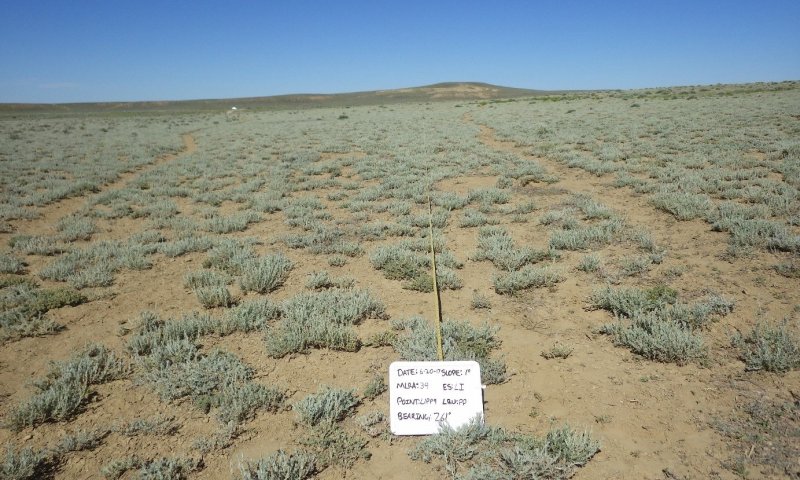
Increase in shrub cover, ATGA, PIDE4 and KRLA2 Decrease in bunchgrass cover Herbaceous canopy cover in the Salt Desert Shrub Community (3.1) is significantly reduced. Annual production is less than half of the Bunchgrass/Winterfat Plant Community (1.1). Perennial grass species (e.g., Indian ricegrass, and bottlebrush squirreltail) may exist only in patches and are typically low in vigor. This community tends to be dominated by winterfat and Gardner’s saltbush (salt desert shrubs) (>25% cover) and bare ground often exceeds 40% in large patches in the interspaces of the shrub canopy (>6 foot canopy gap common). The majority of annual production is from salt-desert shrubs so this site provides very little value for grazing. Sparse vegetation creates low levels of foliar and basal cover. This, in turn, leads to low litter production, which is combined with reduced ability to retain litter on site. Soil is exposed to wind and water erosion in the plant interspaces. These factors combine to create a decrease in soil organic matter. Reduced litter cover, combined with reduced herbaceous cover, results in higher soil temperature, poor water infiltration rates, and high evaporation, thus favoring species which are more adapted to drier conditions. Soil fertility is reduced, soil compaction is increased, and resistance to soil surface erosion has declined compared to the other states. This community has lost most, if not all, of the attributes of a functioning, healthy rangeland, including good infiltration, minimal erosion and runoff, nutrient cycling, and energy flow.
State 4
Highly disturbed
All sites may transition to this state following a severe soil disturbance such as oil and gas development or surface mining extraction.
Community 4.1
Reclaimed
Seeded with natives or non-natives Decrease in shrubs The Reclaimed Community (4.1) is highly variable based on weather conditions during restoration activities, the management practices used to implement the restoration, the seed mix, and timing/method of stockpiling topsoil during the disturbance. The most common scenario is a reclaimed oil and gas well pad planted to crested wheatgrass (Agropyron cristatum) without appropriate topsoil stockpiling. If topsoil is stockpiled, it may have been stored for too long and/or stored too deep resulting in fewer soil microorganisms. Over time, winterfat may spread into the reclaimed area, but the understory will be dominated by introduced species. Biological soil crusts are minimal, further exposing the soil surface to erosional forces as well as impairing carbon, nutrient, and water cycles.
Community 4.2
Annuals
Perennial natives are replaced with Annual grasses and forbs The Annuals Community (4.2) occurs after severe disturbance, most often physical soil disturbance that removes all topsoil, but it can also occur as a transition from the Disturbed State (3) after severe drought, flooding, pests, or disease kills shrubs, leaving the site with no perennial vegetation. Populations of annual and/or invasive weeds reach critical levels and impact the ecological processes on the site until restoration of the site occurs. As part of succession, all sites that are severely disturbed go through this plant community as part of the restoration process, but the time spent in this community phase is largely dependent on the use of restoration Best Management Practices (BMPs) and climate cycles. Biological soil crusts are non-existant, further exposing the soil surface to erosional forces as well as impairing carbon, nutrient, and water cycles.
Transition T1A
State 1 to 2
Increased herbivory (concentrated winter) The drivers for transition from the Reference State to the Grazed/Browsed State are high intensity grazing (herbivory during spring/summer and/or browse during fall/winter) and/or severe drought. High rates of herbivory during spring/summer and/or drought can lead to a decline in palatable mid-stature bunchgrasses, mainly Indian ricegrass, a short-lived perennial that requires more frequent seed production to provide an adequate seedbank, and bottlebrush squirreltail, widely adapted to a wide range of ecological conditions (USDA, NRCS, 2018).As bunchgrasses diminish or die during periods of stress, low-stature bunchgrasses and rhizomatous grasses gain a competitive advantage, creating a shift in species composition towards less productive, shorter species. While bare ground may not change, the pattern of bare ground will shift to larger gaps in the canopy and fewer herbaceous plants between shrubs. Once mid-stature bunchgrasses species become scarce, it is unlikely that they have sufficient reproductive capability (seed source, tillering, or resprouting) to recover dominance in a reasonable time frame without management changes and extra energy being added to the system. When the understory vegetation has been degraded to this point, the transition to the Grazing/Browsed State (2) can occur from the Bunchgrass/Winterfat Plant Community (1.1). The transition is not dependent on the increase of shrub cover, but rather the lack of mid-stature bunchgrasses in the canopy interspaces. High rates of browse during fall/winter can lead to a decline in winterfat and an increase in bare ground. Often times this occurs at the same time as high levels of use in spring/summer associated with areas that have high wild horse use. Managing wild horse populations is critical to the heath of this site as it is highly preferred by this species. Management should focus on grazing management strategies that will prevent further degradation. This can be achieved through a grazing management scheme that is within the carrying capacity and varies the season of use to provide periodic deferment during the critical growth period (roughly May-June). Forage quantity and/or quality in the Grazing/Browsed State (2) may be substantially reduced compared to the Reference State, and will dramatically fluctuate in the dry vs. wet years.
Transition T1B
State 1 to 3
Soil disturbing activity (hoof action, anthropogenic activity, rodent activity) The driver for transition from the Reference State to the Disturbed State is a soil disturbing activity (hoof action, anthropogenic, rodent, etc.). Drought can accelerate this transition. In some instances, dissolved salts occur below the plant rooting zone, and with soil disturbance these salts are released and made available to plants. With the increase in salts, such as sodium, the plant community can be highly altered. When this happens, a threshold has been crossed and is extremely difficult to remedy. Indicators of this transition include significant declines in herbaceous cover and an increase in salt loving plants such as Gardner’s saltbush (Atriplex gardneri). The trigger for this transition is a loss of “A” horizon material and an increase in dissolved salts, released from a deeper “B” horizon. Soil erosion is accompanied by decreased soil fertility driving the transitions to the Disturbed State. Several other key factors signal the approach of a threshold: an increase in soil dispersion (caused by increased sodium), a decrease in soil surface aggregate stability, and/or evidence of erosion, including water flow patterns, development of plant pedestals, and litter movement.
Restoration pathway R2A
State 2 to 1
Decreased herbivory (prescribed grazing practices), seeding time The drivers for this restoration pathway are restoration of native herbaceous species by grazing rest or deferment followed by changing the season of use from spring to fall, lowering stocking density, possible seeding of native herbaceous species, and time. If some mid-stature bunchgrasses remain in the understory, proper grazing management can move the site back to the Reference State (1). This could take multiple generations of management or could be accelerated with rest or deferment combined with successive wet springs conducive to seed germination and seedling establishment. (Derner, Schuman, Follett, & Vance, 2014).
Transition T2A
State 2 to 3
Soil disturbing activity (hoof activity, anthropogenic activity) The driver for transition from the Grazed/Browsed State to the Disturbed State (T2A) is an increase in salt-desert shrubs, caused by soil disturbance that frees up exchangeable sodium and other salts that occur with the subsurface soil horizons. Examples of soil disturbance include hoof action, recreation, small burrowing mammals, and high stocking densities. If depth to sodium affected subsurface soil horizon (>8mmhos/cm) is relatively shallow (<10cm), the risk of crossing this threshold increases. When this threshold is crossed, plant community dynamics are affected, bare ground increases, hydrology is changed due to the restrictive nature of the exchangeable sodium and runoff is increased. In these cases it may be impossible to recover from this threshold. Indicators of the Disturbed state are an increase in salt desert shrubs, such as; Gardner’s saltbush (Atriplex gardneri) and spiny horsebrush (Tetradymia spinescens), and increased bare ground.
Transition T2B
State 2 to 4
The driver for transition from the Grazed/Browed to the Highly Disturbed State (T2B) is a topsoil removing event with mechanical equipment. Examples include construction sites, oil and gas activity, and borrow areas.
Restoration pathway R3A
State 3 to 2
If soil disturbance is minimal, Decreased herbivory (prescribed grazing practices), seeding time The drivers for this restoration pathway are decreased herbivory/browse, seeding and time, if soil disturbance has not completely altered to soil chemistry of the site (i.e. exposing the soil layer with exchangeable sodium and other salts). Due to loss of soil fertility, structure, and organic matter, reference community plants are slow to repopulate the site. Success of this restoration is highly dependent upon climatic factors such as drought.
Transition T3A
State 3 to 4
The driver for transition from the Disturbed State to the Highly Disturbed State (T3A) is a topsoil removing event with mechanical equipment. Examples include construction sites, oil and gas activity, and borrow areas.
Additional community tables
Table 10. Community 1.1 plant community composition
| Group | Common name | Symbol | Scientific name | Annual production (kg/hectare) | Foliar cover (%) | |
|---|---|---|---|---|---|---|
|
Grass/Grasslike
|
||||||
| 1 | Perennial Mid-Size Cool Season Grasses | 99–247 | ||||
| Indian ricegrass | ACHY | Achnatherum hymenoides | 93–185 | 15–30 | ||
| squirreltail | ELEL5 | Elymus elymoides | 155–185 | 25–30 | ||
| 2 | Rhizomatous Grasses | 12–31 | ||||
| thickspike wheatgrass | ELLAL | Elymus lanceolatus ssp. lanceolatus | 7–31 | 1–5 | ||
| 3 | Misc. Grasses/Grasslikes | 12–31 | ||||
| Sandberg bluegrass | POSE | Poa secunda | 7–31 | 1–5 | ||
| Grass, perennial | 2GP | Grass, perennial | 0–31 | 0–5 | ||
|
Forb
|
||||||
| 4 | Perennial Forbs | 25–56 | ||||
| Forb, perennial | 2FP | Forb, perennial | 0–31 | 0–5 | ||
| cushion buckwheat | EROV | Eriogonum ovalifolium | 0–31 | 0–5 | ||
| buckwheat | ERIOG | Eriogonum | 7–31 | 1–5 | ||
| spiny phlox | PHHO | Phlox hoodii | 7–31 | 1–5 | ||
| stemless mock goldenweed | STAC | Stenotus acaulis | 7–31 | 1–5 | ||
| scarlet globemallow | SPCO | Sphaeralcea coccinea | 0–19 | 0–3 | ||
| milkvetch | ASTRA | Astragalus | 0–19 | 0–3 | ||
| streamside fleabane | ERGL2 | Erigeron glabellus | 0–19 | 0–3 | ||
| fleabane | ERIGE2 | Erigeron | 0–19 | 0–3 | ||
| rockcress | ARABI2 | Arabis | 0–12 | 0–2 | ||
| sandwort | ARENA | Arenaria | 0–12 | 0–2 | ||
| textile onion | ALTE | Allium textile | 0–7 | 0–1 | ||
| Lewis flax | LILE3 | Linum lewisii | 0–7 | 0–1 | ||
| aster | SYMPH4 | Symphyotrichum | 0–7 | 0–1 | ||
| 5 | Annual Forbs | 0–7 | ||||
| bushy bird's beak | CORA5 | Cordylanthus ramosus | 0–7 | 0–1 | ||
| sanddune cryptantha | CRFE3 | Cryptantha fendleri | 0–7 | 0–1 | ||
| flatspine stickseed | LAOC3 | Lappula occidentalis | 0–7 | 0–1 | ||
| Forb, annual | 2FA | Forb, annual | 0–7 | 0–1 | ||
|
Shrub/Vine
|
||||||
| 6 | Shrubs | 86–216 | ||||
| winterfat | KRLA2 | Krascheninnikovia lanata | 86–216 | 10–25 | ||
| 7 | Misc. Shrubs | 12–31 | ||||
| shortspine horsebrush | TESP2 | Tetradymia spinosa | 0–31 | 0–5 | ||
| Gardner's saltbush | ATGA | Atriplex gardneri | 7–31 | 1–5 | ||
| yellow rabbitbrush | CHVI8 | Chrysothamnus viscidiflorus | 0–31 | 0–5 | ||
| granite prickly phlox | LIPU11 | Linanthus pungens | 0–19 | 0–3 | ||
| bud sagebrush | PIDE4 | Picrothamnus desertorum | 0–19 | 0–3 | ||
| spineless horsebrush | TECA2 | Tetradymia canescens | 0–19 | 0–3 | ||
| Wyoming big sagebrush | ARTRW8 | Artemisia tridentata ssp. wyomingensis | 0–19 | 0–3 | ||
| shadscale saltbush | ATCO | Atriplex confertifolia | 0–19 | 0–3 | ||
| Subshrub (<.5m) | 2SUBS | Subshrub (<.5m) | 0–7 | 0–1 | ||
Table 11. Community 2.1 plant community composition
| Group | Common name | Symbol | Scientific name | Annual production (kg/hectare) | Foliar cover (%) | |
|---|---|---|---|---|---|---|
|
Grass/Grasslike
|
||||||
| 1 | Perennial Mid-Size Cool Season Grasses | 9–22 | ||||
| squirreltail | ELEL5 | Elymus elymoides | 4–45 | 1–10 | ||
| Indian ricegrass | ACHY | Achnatherum hymenoides | 4–22 | 1–5 | ||
| 2 | Rhizomatous Grasses | 22–45 | ||||
| thickspike wheatgrass | ELLAL | Elymus lanceolatus ssp. lanceolatus | 22–45 | 5–10 | ||
| 3 | Misc Grasses/Grasslikes | 31–67 | ||||
| Sandberg bluegrass | POSE | Poa secunda | 22–67 | 5–15 | ||
| Grass, perennial | 2GP | Grass, perennial | 0–22 | 0–5 | ||
|
Forb
|
||||||
| 4 | Perennial Forbs | 22–40 | ||||
| Forb, perennial | 2FP | Forb, perennial | 0–22 | 0–5 | ||
| cushion buckwheat | EROV | Eriogonum ovalifolium | 0–22 | 0–5 | ||
| buckwheat | ERIOG | Eriogonum | 4–22 | 1–5 | ||
| spiny phlox | PHHO | Phlox hoodii | 4–22 | 1–5 | ||
| stemless mock goldenweed | STAC | Stenotus acaulis | 4–22 | 1–5 | ||
| scarlet globemallow | SPCO | Sphaeralcea coccinea | 0–13 | 0–3 | ||
| milkvetch | ASTRA | Astragalus | 0–13 | 0–3 | ||
| streamside fleabane | ERGL2 | Erigeron glabellus | 0–13 | 0–3 | ||
| fleabane | ERIGE2 | Erigeron | 0–13 | 0–3 | ||
| rockcress | ARABI2 | Arabis | 0–9 | 0–2 | ||
| sandwort | ARENA | Arenaria | 0–9 | 0–2 | ||
| textile onion | ALTE | Allium textile | 0–4 | 0–1 | ||
| Lewis flax | LILE3 | Linum lewisii | 0–4 | 0–1 | ||
| aster | SYMPH4 | Symphyotrichum | 0–4 | 0–1 | ||
| 5 | Annual Forbs | 0–4 | ||||
| bushy bird's beak | CORA5 | Cordylanthus ramosus | 0–4 | 0–1 | ||
| sanddune cryptantha | CRFE3 | Cryptantha fendleri | 0–4 | 0–1 | ||
| flatspine stickseed | LAOC3 | Lappula occidentalis | 0–4 | 0–1 | ||
| Forb, annual | 2FA | Forb, annual | 0–4 | 0–1 | ||
|
Shrub/Vine
|
||||||
| 6 | Shrubs | 90–179 | ||||
| winterfat | KRLA2 | Krascheninnikovia lanata | 90–179 | 15–30 | ||
| 7 | Misc Shrubs | 45–90 | ||||
| shortspine horsebrush | TESP2 | Tetradymia spinosa | 4–45 | 1–10 | ||
| Subshrub (<.5m) | 2SUBS | Subshrub (<.5m) | 0–22 | 0–5 | ||
| Wyoming big sagebrush | ARTRW8 | Artemisia tridentata ssp. wyomingensis | 0–22 | 0–5 | ||
| shadscale saltbush | ATCO | Atriplex confertifolia | 0–22 | 0–5 | ||
| Gardner's saltbush | ATGA | Atriplex gardneri | 4–22 | 1–5 | ||
| yellow rabbitbrush | CHVI8 | Chrysothamnus viscidiflorus | 0–22 | 0–5 | ||
| granite prickly phlox | LIPU11 | Linanthus pungens | 0–22 | 0–5 | ||
| bud sagebrush | PIDE4 | Picrothamnus desertorum | 0–22 | 0–5 | ||
| spineless horsebrush | TECA2 | Tetradymia canescens | 0–22 | 0–5 | ||
Interpretations
Animal community
The following table lists suggested initial stocking rates for cattle under continuous season-long grazing under normal growing conditions. These are conservative estimates that should be used only as guidelines in the initial stages of the conservation planning process. Often, the current plant composition does not entirely match any particular plant community (as described in this ecological site description). Because of this, a field visit is recommended, in all cases, to document plant composition and production. More precise carrying capacity estimates should eventually be calculated using this information along with animal preference data, particularly when grazers other than cattle are involved. Under more intensive grazing management, improved harvest efficiencies can result in an increased carrying capacity, but recovery time for upland sites is much longer than in a low intensity system. If distribution problems occur, stocking rates must be reduced or facilitating conservation practices (i.e. cross-fencing, water development) to maintain plant health and vigor.
Plant Community Production Carrying Capacity*
(lb./ac) Low-RV-High AUM/AC AC/AUM
Bunchgrass/Winterfat 350-550-750 0.13 8
Winterfat(Browse) 200-400-550 0.08 12
Bluegrass/Thickspike 200-400-550 0.1 10
Salt Desert Shrub 150-400-500 0.05 20
* - Continuous, season-long grazing by cattle under average growing conditions.
**Calculation for these stocking rates are as follows: using RV values for production, take only forage palatable to cattle and multiply by 0.25 harvest efficiency and divide by 913 (pounds of air dried weight forage per Animal Unit Month on intake rate of 2.6%) to arrive at carrying capacity.
Grazing by domestic livestock is one of the major income-producing industries in the area. Rangeland in this area may provide yearlong forage for cattle, sheep, or horses. During the dormant period, protein supplement is NOT recommended because the quality meets minimum livestock requirements.
Distance to water, shrub density, and slope can affect grazing capacity within a management unit. Adjustments should be made for the area that is considered necessary for reduction of animal numbers. For example, 30% of a management unit may have 25% slopes and distances of greater than 1 mile from water; therefore, the adjustment is only calculated for 30% of the unit (i.e. 50% reduction on 30% of the management unit). Fencing, slope length, management, access, terrain, kind and class of livestock, and breeds are all factors that can increase or decrease the percent of graze-able acres within a management unit. Adjustments should be made that incorporate these factors when calculating stocking rates.
Wildlife:
Reference State:
1.1 Bunchgrass/Winterfat: This community phase provides excellent foraging habitat for mule deer, pronghorn, elk and sage-grouse. Winterfat has excellent forage value and is sought out throughout the year, but especially in winter months by big game species. A diverse suite of herbaceous species can provide important micro-nutrient requirements for big game species throughout the year. Indian ricegrass provides relatively better winter forage for pronghorn and mule deer compared to other grass species. It is a common site for prairie dog towns, badgers, burrowing owls, and other ground-burrowing animals. Other species that would frequent this plant community include predators of these small mammals. Due to the close proximity of this state to nearby sagebrush communities, the structure of this plant community is less important than the forage value it provides.
Grazed/Browsed State:
2.1 Winterfat (heavy browse): This plant community is variable in its value to wildlife. When winterfat plants are severely browsed they tend to have poor vigor and less annual leader production to provide forage to wildlife. Big game species such as pronghorn and mule deer will still forage on woody species on this site, but are likely not able to get the quantity or quality of forage they require for nutritional demands. Small mammals and birds are likely not going to prefer this State relative to the Reference State. Competition with wild horses for forage and space will directly affect the ability of wildlife to utilize what forage value this community may provide to wildlife.
2.2 Bluegrass/Thickspike: When found adjacent to sagebrush dominated sites, this plant community is well suited for sage grouse lek sites. It is a common site for prairie dog towns, badgers, burrowing owls, and other ground-burrowing animals. Other species that would frequent this plant community include predators of these small mammals. Pronghorn and mule deer winter forage requirements are not met by this plant community, but may be adequate for forage needs in summer months with a higher percentage of forage from herbaceous species.
Disturbed State:
3.1 Salt Desert Shrub: The predominance of woody plants, particularly Gardner’s saltbush, in this plant community provides winter browse for mule deer and pronghorn as well as some year-round habitat. It is a common site for prairie dog towns, badgers, burrowing owls, and other ground-burrowing animals. Other species that would frequent this plant community include predators of these small mammals
Highly Disturbed State:
4.1 Reclaimed: This community phase is highly variable in its value to wildlife. Reclamation success, size and configuration of the reclaimed area, the species planted, and the time it takes for plants to establish will determine the value of the site for wildlife. A fully reclaimed site containing a diversity of herbaceous and woody native plants can eventually provide the same wildlife habitat benefits as the reference state. In most cases, grasses and forbs establish early in the reclamation process, whereas shrubs take significantly longer to establish.
4.1 Annuals: This plant community exhibits a low level of plant species diversity, and thus, is less apt to meet the seasonal needs of most wildlife who frequent this community.
Hydrological functions
Water is the principal factor limiting forage production on this site. This site is dominated by soils in hydrologic group B (infiltration rate of 0.15-0.3 in/hr), with localized areas in hydrologic groups A (infiltration rate of 0.3 in/hr) and C (infiltration rate of 0.05-0.15 in/hr). Infiltration ranges from moderately rapid to moderate. Runoff potential for this site varies from low to moderate depending on soil hydrologic group and ground cover. In many cases, areas with greater than 75% ground cover have the greatest potential for high infiltration and lower runoff. Areas where ground cover is less than 50% have the greatest potential to have reduced infiltration and higher runoff (refer to Part 630, NRCS National Engineering Handbook for detailed hydrology information).
Rills and gullies should not typically be present. Water flow patterns should be barely distinguishable if at all present. Pedestals are only slightly present in association with bunchgrasses and shrubs. Litter typically falls in place, and signs of movement are not common. Chemical and physical crusts are rare to non-existent. Biological crusts are present, but only cover 1-2% of the soil surface.
Recreational uses
This site provides some limited recreational opportunities for hiking, horseback riding, bird watching, and upland game hunting. The forbs have a variety of colors and shapes that appeal to photographers. This site provides valuable open space when located in large, un-fragmented landscapes.
Wood products
None
Other products
None
Other information
Similarity Index is based on species composition by air-dry weight. Calculations of allowable pounds per acre for each species are based on the sum of the maximum allowable composition of the production range or actual production (whichever is less) in the plant table for the Desired Plant Community until the maximum allowable is reached for the plant grouping. The sum is then divided by the Representative Value (RV) of total annual production for the Desired Plant Community.
Plant Preference Table:
https://docs.google.com/viewera=v&pid=sites&srcid=ZGVmYXVsdGRvbWFpbnxtbHJhMzRhfGd4OjIyZWEyYzIyMGE5NWE4MzM
Supporting information
References
-
. 2021 (Date accessed). USDA PLANTS Database. http://plants.usda.gov.
-
. 2021 (Date accessed). USNVC [United States National Vegetation Classification]. 2019. United States National Vegetation Classification Database, V2.03. Federal Geographic Data Committee, Vegetation Subcommittee, Washington DC.. USNVC: http://usnvc.org/.
-
. 2002. Management considerations for sagebrush (Artemisia) in the western U.S.: A selective summary of cumulative information about the ecology and biology of woody N. American sagebrush taxa. USDI-BLM, Washington, D.C..
-
Bestelmeyer, B., J.R. Brown, K.M. Havstad, B. Alexander, G. Chavez, and J.E. Herrick. 2003. Development and Use of State and Transition Models for Rangelands. Jornal of Range Management 56:114–126.
-
Bestelmeyer, B., J.R. Brown, J.E. Herrick, D.A. Trujillo, and K.M. Havstad. 2004. Land Management in the American Southwest: a state-and-transition approach to ecosystem complexity. Environmental Management 34:38–51.
-
Bestelmeyer, B. and J. Brown. 2005. State-and-Transition Models 101: A Fresh look at vegetation change.
-
Cagney, J., E. Bainter, B. Budd, T. Christiansen, V. Herren, and M. Holloran. 2010. Grazing Influence, Objective Development, and Management in Wyoming's Greater Sage-Grouse Habitat. 35p.
-
Chambers, J.C., J.L. Beck, T.J. Christiansen, K.J. Clause, J.B. Dinkins, K.E. Doherty, K.A. Griffin, D.W. Havlina, K.F. Henke, L.L. Kurth, J.D. Maestas, M. Manning, K.E. Mayer, B.A. Mealor, C. McCarthy, M.A. Perea, and D.A. Pyke. 2016. Using resilience and resistance concepts to manage threats to sagebrush ecosystems, Gunnison sage-grouse, and Greater sage-grouse in their eastern range: A strategic multi-scale approach.. Gen. Tech. Rep. RMRS-GTR-356.. U.S. Department of Agriculture, Forest Service, Rocky Mountain Research Station, Fort Collins, CO. 1–143.
-
Clause, K. and J. Randall. 2014. Wyoming Sagebrush Die-Off Report. Unpublished.
-
Miller, J.F., R.H. Frederick, and R.J. Tracey. 1973. “Precipitation-Frequency Atlas of the United States” NOAA Atlas 2, Volume 2 (Wyoming). National Weather Service, Silver Spring, Maryland.
-
Rasmussen, L.L. 1986. Response of Winterfat (Ceratoides lanta) communities to release from grazing pressure.
-
Shultz, L.M. 2009. Monograph of Artemisia Subgenus Tridentatae (Asteraceae-Anthemideae). Systematic Botany Monographs 89:1–131.
-
Stringham, T.K., W.C. Kreuger, and P.L. Shaver. 2003. State and Transition Modeling: an ecological process approach. Journal of Range Management 56:106–113.
-
U. S. Environmental Protection Agency. 2010. Level III and IV ecoregions of the continental United States. U.S. EPA, National Health and Environmental Effects Research Laboratory, Corvallis, Oregon, U.S..
Contributors
Bryan Christensen
Karen J. Clause
Approval
Kirt Walstad, 9/28/2023
Rangeland health reference sheet
Interpreting Indicators of Rangeland Health is a qualitative assessment protocol used to determine ecosystem condition based on benchmark characteristics described in the Reference Sheet. A suite of 17 (or more) indicators are typically considered in an assessment. The ecological site(s) representative of an assessment location must be known prior to applying the protocol and must be verified based on soils and climate. Current plant community cannot be used to identify the ecological site.
| Author(s)/participant(s) | K. Clause, B. Christensen |
|---|---|
| Contact for lead author | K. Clause |
| Date | 08/20/2018 |
| Approved by | Kirt Walstad |
| Approval date | |
| Composition (Indicators 10 and 12) based on | Annual Production |
Indicators
-
Number and extent of rills:
Not expected for the site, but could be present on slopes greater than 8%. When present, rills are short and widely spaced relative to slope distance. -
Presence of water flow patterns:
Water patterns are not expected for this site, but can be present when slopes exceed 8%. When present are not common and are very small and not connected beyond 2 gaps in the plant canopy. -
Number and height of erosional pedestals or terracettes:
Active pedestals are not common, when found are blunt and not active and less than 2 inches (5cm). Terracettes are not expected. -
Bare ground from Ecological Site Description or other studies (rock, litter, lichen, moss, plant canopy are not bare ground):
Bare ground <25% expected. Canopy gaps comprise up to 30% of the ground surface, and are primarily in the 1-2 ft category (25%) with 5% in both the 2-3 foot and 3-6 ft categories. Canopy gaps >6 ft are not expected. Basal gaps up to 65% are expected (25% in 1-2 foot, 15% in 2-3 foot, 20% in 3-6 foot, and up to 5% >6 foot). -
Number of gullies and erosion associated with gullies:
Gullies are not expected. -
Extent of wind scoured, blowouts and/or depositional areas:
Wind scour, blowouts and/or depositional areas are not expected for this site. -
Amount of litter movement (describe size and distance expected to travel):
Litter (herbaceous and fine woody) expected to move only in small amounts due to wind or in water flow patterns found on slopes >8%. -
Soil surface (top few mm) resistance to erosion (stability values are averages - most sites will show a range of values):
Soil Stability Index ratings are expected to be variable for plant canopy and interspaces. Values of >5 are expected when sample includes soil biological crusts or is taken under plant canopy, and values 4 to 5 are expected in the interspaces. Average values >5 are expected. -
Soil surface structure and SOM content (include type of structure and A-horizon color and thickness):
Soil organic matter (SOM) <2% is common. Color and structure are poor indicators of SOM in Inceptisols (semi-arid soils with only moderate soil development) because SOM potential is low. Typically soil surface consists of an A-horizon of 1-3 inches (3-8 cm) thick with very fine platy to granular structure that is pale brown (i.e. 10YR 6/3 dry) in color. Field indicators of departure from the reference condition include exposure of subsoil with strong, sub-angular blocky structure as evidenced by excessive pedestalling and/or surface disturbance. -
Effect of community phase composition (relative proportion of different functional groups) and spatial distribution on infiltration and runoff:
The reference state consists of 50% perennial grasses, 10% forbs, and 40% shrubs (predominantly sub-shrubs) composition by dry weight. Infiltration is moderate resulting in moderate runoff potential. Foliar cover (plant canopy)Basal plant cover 5-10% is expected for this site. -
Presence and thickness of compaction layer (usually none; describe soil profile features which may be mistaken for compaction on this site):
None expected. A dry subsurface will often refuse a probe, causing misidentification of a compaction layer. Most soil profiles must be described by hand dug holes. -
Functional/Structural Groups (list in order of descending dominance by above-ground annual-production or live foliar cover using symbols: >>, >, = to indicate much greater than, greater than, and equal to):
Dominant:
Sub-dominant:
Other:
Additional:
1 Mid-size, cool season perennial bunchgrassesevergreen sub-shrubscool season rhizomatous perennial grasses =short, cool season perennial bunchgrasses=perennial forbsother shrubsannual forbs -
Amount of plant mortality and decadence (include which functional groups are expected to show mortality or decadence):
Minimal decadence is expected. It is common to find dead matter accumulated in bunchgrasses, but live plant matter quantity should exceed standing dead except for in times of severe drought. -
Average percent litter cover (%) and depth ( in):
Litter ranges from 10-20% of total canopy measurement with total litter (including beneath the plant canopy) 35-55% expected. Herbaceous litter depth is typically very shallow, approximately 1-2mm. Woody litter is fine, mostly <1” in diameter (3cm), and is scattered and sporadically distributed (not layered or in piles). -
Expected annual annual-production (this is TOTAL above-ground annual-production, not just forage annual-production):
English: 350-750 lb/ac (550 lb/ac average); Metric: 392-840 kg/ha (616 kg/ha average). -
Potential invasive (including noxious) species (native and non-native). List species which BOTH characterize degraded states and have the potential to become a dominant or co-dominant species on the ecological site if their future establishment and growth is not actively controlled by management interventions. Species that become dominant for only one to several years (e.g., short-term response to drought or wildfire) are not invasive plants. Note that unlike other indicators, we are describing what is NOT expected in the reference state for the ecological site:
Annual weeds such as desert alyssum, halogeton, kochia, lambsquarter, flixweed, and Russian thistle are common weedy species in disturbed sites. -
Perennial plant reproductive capability:
All species are capable of reproducing except in severe drought years. Thickspike wheatgrass will commonly reproduce by underground rhizomes and not by seed production.
Print Options
Sections
Font
Other
The Ecosystem Dynamics Interpretive Tool is an information system framework developed by the USDA-ARS Jornada Experimental Range, USDA Natural Resources Conservation Service, and New Mexico State University.
Click on box and path labels to scroll to the respective text.
