

Natural Resources
Conservation Service
Ecological site F041XA113AZ
Sandy Bottom 16-20" p.z. woodland
Last updated: 4/09/2021
Accessed: 03/14/2025
General information
Provisional. A provisional ecological site description has undergone quality control and quality assurance review. It contains a working state and transition model and enough information to identify the ecological site.

Figure 1. Mapped extent
Areas shown in blue indicate the maximum mapped extent of this ecological site. Other ecological sites likely occur within the highlighted areas. It is also possible for this ecological site to occur outside of highlighted areas if detailed soil survey has not been completed or recently updated.
MLRA notes
Major Land Resource Area (MLRA): 041X–Madrean Archipelago
AZ 41.1 – Mexican Oak-Pine Forest and Oak Savannah
Elevations range from 4500 to 10,700 feet and precipitation ranges from 16 to 30 inches. Vegetation includes Emory oak, Mexican blue oak, Arizona white oak, one-seed juniper, alligator juniper, sacahuista, California bricklebush, skunkbush sumac, Arizona rosewood, wait-a-bit mimosa, sideoats grama, blue grama, purple grama, wooly bunchgrass, plains lovegrass, squirreltail, and pinyon ricegrass. The soil temperature regime ranges from thermic to mesic and the soil moisture regime ranges from aridic ustic to typic ustic. This unit occurs within the Basin and Range Physiographic Province and is characterized by numerous mountain ranges that rise abruptly from broad, plain-like valleys and basins. Igneous and metamorphic rock classes dominate the mountain ranges and sediments filling the basins represent combinations of fluvial, lacustrine, colluvial and alluvial deposits.
Ecological site concept
Sandy Bottom, woodland, 16"-20" p.z., is a gallery woodland with ash and cottonwood trees dominant (unless in disturbed state such as salt cedar dominated). The plant community benefits from a perennially high water table within 3-15' of soil surface. Seasonally, surface water may flow. Soils are sandy and have visible redox features.
Associated sites
F041XA112AZ |
Sandy Wash 16-20" p.z. woodland |
---|---|
R041XA102AZ |
Shallow Hills 16-20" p.z. |
R041XA103AZ |
Limestone Hills 16-20 p.z. |
R041XA107AZ |
Loamy Slopes 16-20" p.z. |
R041XA111AZ |
Volcanic Hills 16-20" p.z. |
Similar sites
F041XA125AZ |
Sandy Bottom 20-23" p.z. Subirrigated (PLWR2, JUMA, QUERC) |
---|
Table 1. Dominant plant species
Tree |
(1) Platanus wrightii |
---|---|
Shrub |
(1) Vitis arizonica |
Herbaceous |
(1) Muhlenbergia rigens |
Physiographic features
This site occurs in the middle elevations of the Madrean Basin and Range province in southeastern Arizona. It occurs on floodplains, low stream terraces and along the banks of stream channels in major drainage-ways. It benefits on a regular basis from extra moisture received as over-bank flooding. It also benefits from high water tables at depths of 3-15 feet.
Table 2. Representative physiographic features
Landforms |
(1)
Flood plain
(2) Stream terrace |
---|---|
Flooding duration | Very brief (4 to 48 hours) to brief (2 to 7 days) |
Flooding frequency | Occasional to frequent |
Ponding duration | Very brief (4 to 48 hours) to brief (2 to 7 days) |
Ponding frequency | Rare to occasional |
Elevation | 1,433 – 1,676 m |
Slope | 0 – 3% |
Aspect | Aspect is not a significant factor |
Climatic features
Precipitation in this zone of the common resource area ranges from 16-20 inches per year with elevations from 4700-5500 feet. Approximately 40% of this moisture comes as gentle rain or snow during the winter-spring (Oct-Apr) season; originates in the north Pacific and Gulf of California and comes as frontal storms with long duration and low intensity. The remaining 60% falls in the summer season (May-Sep); originates in the Gulf of Mexico and are convective, usually brief, intense thunderstorms. Snow is common Dec-Mar, averaging 5-15 inches per year, but rarely lasts more than a week. May and June are the driest months. Humidity is low.
Temperatures are mild. Freezing temperatures are common at night from Oct-May, but daytime temperatures are almost always over 40 F. Below 0 F temperatures can occur Dec-Feb. Daytime summer highs rarely exceed 95 F.
Species like plains lovegrass, Arizona wild rye, baltic rush, sedges and horsetail begin growth in late March to April. Warm season grasses begin growth in July or August with receipt of the first summer rains.
Table 3. Representative climatic features
Frost-free period (average) | 200 days |
---|---|
Freeze-free period (average) | |
Precipitation total (average) | 508 mm |
Figure 2. Monthly precipitation range
Figure 3. Monthly average minimum and maximum temperature
Influencing water features
These soils are wet in the profile most of the year. They are associated with perennial stream flow except for the months of May, June, October and November in drought years. Being sandy in texture, they do not exhibit re-doximorphic features.
Soil features
These are very young soils on sandy and gravelly alluvium of mixed origins. They are deep and dark colored. They are well drained to somewhat poorly drained. Surface textures range from very cobbly sand to gravelly sandy loam. Soils range from very cobbly sand to coarse loamy. There are inclusions of hydric soils. These are sandy and do not exhibit any of the characteristics of wetland soils like gleying or mottling during the growing season. Plant-soil moisture relationships are very good.
Soils mapped on this site include: SSA-671 Cochise county Douglas-Tombstone part MU's 87 fluvaquents & haplustolls, 88 Rafter & Hayhollow.
Table 4. Representative soil features
Surface texture |
(1) Very cobbly sand (2) Very gravelly sandy loam (3) Cobbly sand |
---|---|
Family particle size |
(1) Sandy |
Drainage class | Somewhat poorly drained to well drained |
Permeability class | Rapid to moderately rapid |
Soil depth | 152 cm |
Surface fragment cover <=3" | 10 – 60% |
Surface fragment cover >3" | 1 – 15% |
Available water capacity (0-101.6cm) |
4.57 – 15.24 cm |
Calcium carbonate equivalent (0-101.6cm) |
0 – 5% |
Electrical conductivity (0-101.6cm) |
0 – 2 mmhos/cm |
Sodium adsorption ratio (0-101.6cm) |
0 – 2 |
Soil reaction (1:1 water) (0-101.6cm) |
6.1 – 7.8 |
Subsurface fragment volume <=3" (Depth not specified) |
10 – 65% |
Subsurface fragment volume >3" (Depth not specified) |
1 – 15% |
Ecological dynamics
The plant communities found on an ecological site are naturally variable. Composition and production will vary with yearly conditions, location, aspect, and the natural variability of the soils. The Historical Climax Plant Community represents the natural potential plant communities found on relict or relatively undisturbed sites. Other plant communities described here represent plant communities that are known to occur when the site is disturbed by factors such as fire, grazing, or drought.
Production data provided in this site description is standardized to air dry weight at the end of the summer growing season. The plant communities described in this site description are based on near normal rainfall years.
NRCS uses a Similarity Index to compare existing plant communities to the plant communities described here. Similarity index is determined by comparing the production and composition of a plant community to the production and composition of a plant community described in this site description. To determine Similarity index, compare the production (air dry weight) of each species to that shown in the plant community description. For each species, count no more than the maximum amount shown for the species, and for each group, count no more than the maximum amount shown for each group. Divide the resulting total by the total normal year production shown in the plant community description. If the rainfall has been significantly above or below normal, use the total production shown for above or below normal years. If field data is not collected at the end of the summer growing season, then the field data must be corrected to the end of the year production before comparing it to the site description. The growth curve can be used as a guide for estimating production at the end of the summer growing season.
State and transition model

Figure 4. State and Transition, Sandy Bottom, PLWR, 16-20" p
More interactive model formats are also available.
View Interactive Models
More interactive model formats are also available.
View Interactive Models
Click on state and transition labels to scroll to the respective text
State 1 submodel, plant communities
State 2 submodel, plant communities
State 3 submodel, plant communities
State 4 submodel, plant communities
State 1
Historic Climax Plant Community
Community 1.1
Historic Climax Plant Community
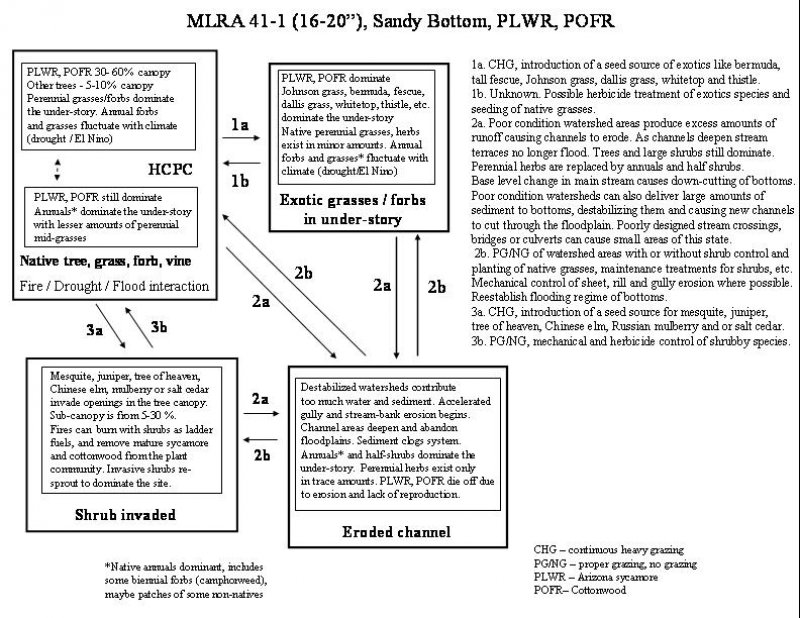
The historic native state includes the native plant communities that occur on the site, including the historic climax plant community. This state includes other plant communities that naturally occupy the site following fire, drought, flooding, herbivores, and other natural disturbances. The historic climax plant community represents the natural climax community that eventually reoccupies the site with proper management.
Forest overstory. This site has a mixed plant community with an over-story of large trees like Arizona sycamore, cottonwood, walnut and ash, with an under-story of young trees, shrubs and perennial and annual grasses and forbs. Broadleaf tree species leaf out in March and shed their leaves with the first hard freeze of winter, usually in November. The aspect is deciduous riparian woodland.
Sycamore reproduces mainly by sprouting into clones. Walnut, cottonwood, willow and ash reproduce by seed that germinate in the spring. Tree canopy ranges from 40-70%.
Trees reach maximum size on this site. Numbers of large trees per acre range from 30-50.
Channel and stream bank erosion and sedimentation are natural features of the site. Numerous old channels lined with trees can be seen across these narrow floodplains. Tree species present are vigorous root and stem sprouters after cutting or injury from floods. Stream flow is intermittent, but surface flow occurs reliably during the winter-spring months. These warm temperature riparian forests require abundant water in March-April, when most of the tree species leaf out, set seed, and germinate. Summer rainfall usually does not result in sustained stream flow on this site, limiting the dominant riparian communities to vernally adapted species. Excessive ground water pumping, damming, or diversion can reduce cool season stream flow and eventually lead to thinning of the tree canopy on the site.
Forest understory. Under-story composition and reproduction varies greatly with percent canopy cover.
Management of the under-story should be aimed at leaving enough cover to protect soils from erosion and to trap sediment in the summer flooding season. Heavy winter runoff can cause much erosion due to prolonged flow and increased viscosity of the water (due to cooler temperatures) resulting in higher capacities to carry sediments.
Figure 5. Annual production by plant type (representative values) or group (midpoint values)
Table 5. Annual production by plant type
Plant type | Low (kg/hectare) |
Representative value (kg/hectare) |
High (kg/hectare) |
---|---|---|---|
Tree | 2242 | 4483 | 6725 |
Grass/Grasslike | 1569 | 673 | 112 |
Forb | 213 | 123 | 62 |
Shrub/Vine | 420 | 224 | 56 |
Total | 4444 | 5503 | 6955 |
Table 6. Soil surface cover
Tree basal cover | 1-2% |
---|---|
Shrub/vine/liana basal cover | 0-1% |
Grass/grasslike basal cover | 1-10% |
Forb basal cover | 1-5% |
Non-vascular plants | 0% |
Biological crusts | 0-5% |
Litter | 50-90% |
Surface fragments >0.25" and <=3" | 10-60% |
Surface fragments >3" | 1-15% |
Bedrock | 0% |
Water | 0-20% |
Bare ground | 0-25% |
Table 7. Canopy structure (% cover)
Height Above Ground (m) | Tree | Shrub/Vine | Grass/ Grasslike |
Forb |
---|---|---|---|---|
<0.15 | – | – | 0-2% | 1-10% |
>0.15 <= 0.3 | – | – | 1-10% | 1-10% |
>0.3 <= 0.6 | – | 0-1% | 5-10% | 1-5% |
>0.6 <= 1.4 | – | 0-5% | 1-10% | 0-5% |
>1.4 <= 4 | 1-2% | 1-10% | 0-5% | 0-5% |
>4 <= 12 | 5-20% | – | – | – |
>12 <= 24 | 35-65% | – | – | – |
>24 <= 37 | – | – | – | – |
>37 | – | – | – | – |
Figure 6. Plant community growth curve (percent production by month). AZ4111, 41.1 16-30. Growth begins in the spring, semi-dormancy occurs during the June drought, most growth occurs during the summer rainy season..
Jan | Feb | Mar | Apr | May | Jun | Jul | Aug | Sep | Oct | Nov | Dec |
---|---|---|---|---|---|---|---|---|---|---|---|
J | F | M | A | M | J | J | A | S | O | N | D |
0 | 0 | 0 | 5 | 10 | 0 | 15 | 45 | 20 | 5 | 0 | 0 |
State 2
Exotic grasses / forbs in under-story
Community 2.1
Exotic grasses / forbs in under-story
This state occurs where non-native grasses like Johnson grass, bermuda, tall fescue, dallis grass, weeping lovegrass and noxious weeds like whitetop, sweet clover and several species of thistle, rumex and centeaura have invaded the under-story plant community. Seed sources for these weeds can be many miles upstream. As these species become dominant in the under-story, native perennial grasses and forbs can decrease to minor amounts.
State 3
Shrub and tree invaded
Community 3.1
Shrub and tree invaded

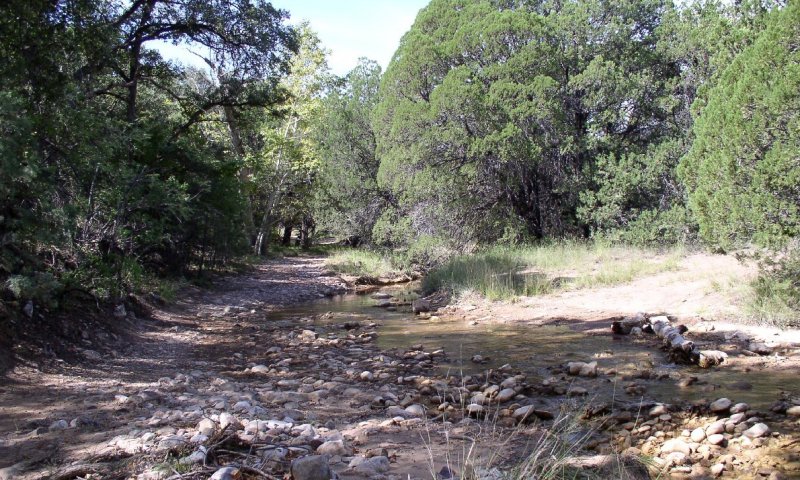
Figure 7. Sandy Bottom, PLWR, POFR 16-20" pz, juniper
This state occurs where shrubby tree species like mesquite, alligator and one-seed juniper, and non-natives like tree of heaven, salt cedar, Chinese elm and Russian mulberry invade and increase to dominate openings in the native tree cover. This can occur in the presence of a seed source for these species and with continuous grazing of the understory vegetation. Once established these species could contribute, as ladder fuels, to the decline of native tree species in wildfires.
State 4
Eroded channel
Community 4.1
Eroded channel

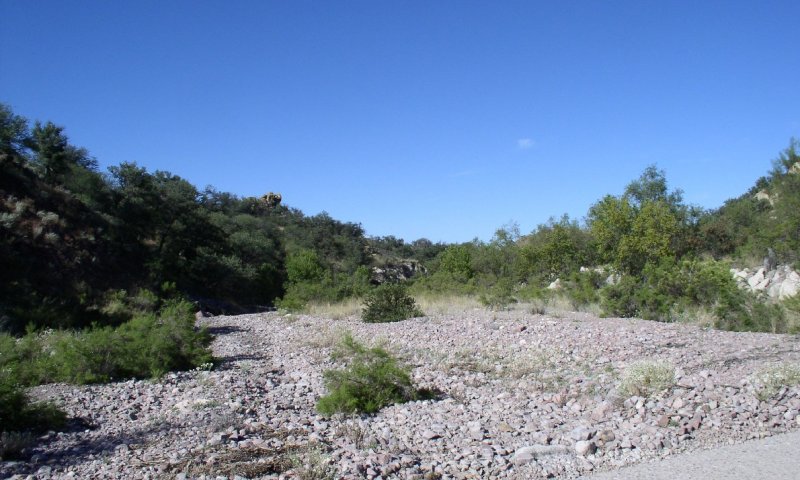
Figure 8. Sandy Bottom, PLWR, POFR 16-20" pz, eroded
This state occurs where the contributory watersheds are destabilized by the interactions of fire, drought and / or continuous grazing. Large amounts of runoff and sediment are delivered to the site causing gully and stream-bank erosion. Channel erosion can deepen floodways and reduce flooding of the stream terraces. Sediment can clog channels causing new channels to cut through floodplains, uprooting trees and removing cover and woody debris. Poorly designed stream crossings, bridges and culverts can cause short reaches of this state in areas immediately downstream.
Transition T1A
State 1 to 2
Continuous Heavy Grazing, introduction of a seed source of exotics like bermudagrass, tall fescue, Johnson grass, dallis grass, whitetop and thistle.
Transition T1B
State 1 to 3
Continuous Heavy Grazing, introduction of a seed source for mesquite, juniper, tree of heaven, Chinese elm, Russian mulberry and or salt cedar.
Transition T1C
State 1 to 4
Poor condition watershed areas produce excess amounts of runoff causing channels to erode. As channels deepen stream terraces no longer flood. Trees and large shrubs still dominate. Perennial herbs are replaced by annuals and half shrubs. Base level change in main stream causes down-cutting of bottoms. Poor condition watersheds can also deliver large amounts of sediment to bottoms, destabilizing them and causing new channels to cut through the floodplain. Poorly designed stream crossings, bridges or culverts can cause small areas of this state.
Restoration pathway R2A
State 2 to 1
Unknown. Possible herbicide treatment of exotics species and seeding of native grasses.
Transition T2A
State 2 to 4
Poor condition watershed areas produce excess amounts of runoff causing channels to erode. As channels deepen stream terraces no longer flood. Trees and large shrubs still dominate. Perennial herbs are replaced by annuals and half shrubs. Base level change in main stream causes down-cutting of bottoms. Poor condition watersheds can also deliver large amounts of sediment to bottoms, destabilizing them and causing new channels to cut through the floodplain. Poorly designed stream crossings, bridges or culverts can cause small areas of this state.
Restoration pathway R3A
State 3 to 1
Prescribed Grazing/No Grazing, mechanical and herbicide control of shrubby species.
Transition T3A
State 3 to 4
Poor condition watershed areas produce excess amounts of runoff causing channels to erode. As channels deepen stream terraces no longer flood. Trees and large shrubs still dominate. Perennial herbs are replaced by annuals and half shrubs. Base level change in main stream causes down-cutting of bottoms. Poor condition watersheds can also deliver large amounts of sediment to bottoms, destabilizing them and causing new channels to cut through the floodplain. Poorly designed stream crossings, bridges or culverts can cause small areas of this state.
Restoration pathway R4A
State 4 to 1
Prescribed Grazing/No Grazing of watershed areas with or without shrub control and planting of native grasses, maintenance treatments for shrubs, etc. Mechanical control of sheet, rill and gully erosion here possible. Reestablish flooding regime of bottoms.
Restoration pathway R4B
State 4 to 2
Prescribed Grazing/No Grazing of watershed areas with or without shrub control and planting of native grasses, maintenance treatments for shrubs, etc. Mechanical control of sheet, rill and gully erosion here possible. Reestablish flooding regime of bottoms.
Restoration pathway R4C
State 4 to 3
Prescribed Grazing/No Grazing of watershed areas with or without shrub control and planting of native grasses, maintenance treatments for shrubs, etc. Mechanical control of sheet, rill and gully erosion here possible. Reestablish flooding regime of bottoms.
Additional community tables
Interpretations
Animal community
The under-story plant community is suitable for grazing by all classes of livestock. Grazing should be done in the fall and winter. Utilization should be limited to less than 50% to leave enough under-story material to protect soils from erosion and to trap sediment during the spring and summer flooding seasons. Grazing during the spring-summer should be avoided to allow for reproduction of broadleaf riparian tree species and to avoid the wet soils, heat, high humidity and insects of the hot summer season. Seasonal carrying capacities should be evaluated based upon on-site investigations as under-story varies greatly with percent canopy cover and production can vary greatly from year to year depending upon seasonality and frequency of flooding.
The most productive and widely used habitat in this sub-resource area. The multi-level tree canopy, good cover and forage diversity and water availability most of the year, make this site home to a tremendous variety of native wildlife.
Hydrological functions
This site is very important in the hydrology of mountain-front stream systems. Vegetation and woody debris spread water over floodplain areas during floods and allow deep percolation through the sandy soils. Dense floodplain vegetation traps sediment, building floodplains and maintaining good water quality. High canopy cover provides shade to stream channels, reducing evaporation and cooling surface waters.
Recreational uses
Camping, hunting, picnicking, photography, bird watching, horseback riding
Wood products
Limitations to equipment include extremely stony, cobbly soils and high water table that contributes to potentially severe flooding.
Erosion potential is severe. Gully and rill erosion can occur during flooding in cleared areas, bare ground, and along roads and trails.
Compaction potential is poor due to coarse textured soils. Workability for roads is poor due to cobbly and stony sandy soils. Rutting potential is low. Revegetation potential is good due to excellent climate.
Harvest cutting should be limited to down/dead trees and/or fuel wood species like mesquite, juniper and oak. Unnaturally thick subcanopy of mesquite and/or juniper should be thinned.
Fire hazards become extreme as sub-canopy thickens causing ladder fuels to build. Prescribed burning can reduce dense under-story vegetation.
There are severe limitations to mechanical tree removal due to wet soils.
Pests need to be controlled to limit tree damage and loss (mistletoe, gypsy moth & tent caterpillars).
There are slight limitations to seeding due to coarse textured soils.
Natural regeneration is very good as long as natural flood regime is not altered.
Some seedling species need protection from fire or grazing for at least 2-3 years to establish.
Plant competition has moderate to severe limitations.
Wind-throw hazard is slight to none.
Other products
Medicinal herbs like yerba mansa and mormon tea. Acorns, walnuts, wild grapes, elder-berries and mulberries for food. Herbs for seasoning like wild oregano and terragon.
Flowers, seed, rocks and sand and gravel.
Supporting information
Inventory data references
Range 417s include 1 in good condition. Wood 5s include 1 in good condition.
Type locality
Location 1: Cochise County, AZ | |
---|---|
Township/Range/Section | T21S R19E S36 |
General legal description | Fort Huachuca - Mouth of Huachuca Canyon |
Location 2: Pima County, AZ | |
Township/Range/Section | T12S R14E S2 |
General legal description | Coronado National Forest, Santa Catalina Mountains - Romero Canyon |
Location 3: Cochise County, AZ | |
Township/Range/Section | T19S R28E S29 |
General legal description | Douglas - Moore Ranch, Rucker Canyon |
Location 4: Cochise County, AZ | |
Township/Range/Section | T16S R29E S29 |
General legal description | Willcox - Crossed J Ranch, Rhyolite Creek |
Contributors
Dan Robinett
Larry D. Ellicott
Approval
Curtis Talbot, 4/09/2021
Rangeland health reference sheet
Interpreting Indicators of Rangeland Health is a qualitative assessment protocol used to determine ecosystem condition based on benchmark characteristics described in the Reference Sheet. A suite of 17 (or more) indicators are typically considered in an assessment. The ecological site(s) representative of an assessment location must be known prior to applying the protocol and must be verified based on soils and climate. Current plant community cannot be used to identify the ecological site.
Author(s)/participant(s) | |
---|---|
Contact for lead author | |
Date | 03/14/2025 |
Approved by | Curtis Talbot |
Approval date | |
Composition (Indicators 10 and 12) based on | Annual Production |
Indicators
-
Number and extent of rills:
-
Presence of water flow patterns:
-
Number and height of erosional pedestals or terracettes:
-
Bare ground from Ecological Site Description or other studies (rock, litter, lichen, moss, plant canopy are not bare ground):
-
Number of gullies and erosion associated with gullies:
-
Extent of wind scoured, blowouts and/or depositional areas:
-
Amount of litter movement (describe size and distance expected to travel):
-
Soil surface (top few mm) resistance to erosion (stability values are averages - most sites will show a range of values):
-
Soil surface structure and SOM content (include type of structure and A-horizon color and thickness):
-
Effect of community phase composition (relative proportion of different functional groups) and spatial distribution on infiltration and runoff:
-
Presence and thickness of compaction layer (usually none; describe soil profile features which may be mistaken for compaction on this site):
-
Functional/Structural Groups (list in order of descending dominance by above-ground annual-production or live foliar cover using symbols: >>, >, = to indicate much greater than, greater than, and equal to):
Dominant:
Sub-dominant:
Other:
Additional:
-
Amount of plant mortality and decadence (include which functional groups are expected to show mortality or decadence):
-
Average percent litter cover (%) and depth ( in):
-
Expected annual annual-production (this is TOTAL above-ground annual-production, not just forage annual-production):
-
Potential invasive (including noxious) species (native and non-native). List species which BOTH characterize degraded states and have the potential to become a dominant or co-dominant species on the ecological site if their future establishment and growth is not actively controlled by management interventions. Species that become dominant for only one to several years (e.g., short-term response to drought or wildfire) are not invasive plants. Note that unlike other indicators, we are describing what is NOT expected in the reference state for the ecological site:
-
Perennial plant reproductive capability:
Print Options
Sections
Font
Other
The Ecosystem Dynamics Interpretive Tool is an information system framework developed by the USDA-ARS Jornada Experimental Range, USDA Natural Resources Conservation Service, and New Mexico State University.
Click on box and path labels to scroll to the respective text.