
Natural Resources
Conservation Service
Ecological site R042BB008NM
Gyp Playa, Desert Shrub
Accessed: 02/11/2026
General information
Provisional. A provisional ecological site description has undergone quality control and quality assurance review. It contains a working state and transition model and enough information to identify the ecological site.
Figure 1. Mapped extent
Areas shown in blue indicate the maximum mapped extent of this ecological site. Other ecological sites likely occur within the highlighted areas. It is also possible for this ecological site to occur outside of highlighted areas if detailed soil survey has not been completed or recently updated.
Associated sites
| R042BB029NM |
Gyp Playa Step, Desert Shrub The Gyp Playa Step (shallow) is often found in association with the Gyp Playa site. It occurs on the downwind edge of the Gyp Playa site. |
|---|
Similar sites
| R042BB001NM |
Alkali Flat, Desert Shrub The Alkali Flat site is similar to the Barren Center of the Gyp Playa site. |
|---|
Table 1. Dominant plant species
| Tree |
Not specified |
|---|---|
| Shrub |
Not specified |
| Herbaceous |
Not specified |
Physiographic features
This site typically occurs as a few scattered playa lake basins generally located on the leeward side of barchanoid type dunes and the windward side of parabolic dune fields. One theory on the formation of these depressions is they are the result of wind scour occurring across naturally low laying areas. These areas frequently pond water following rainfall events. Ponding duration is variable and dependent on intensity and amount of rainfall.
Table 2. Representative physiographic features
| Landforms |
(1)
Playa
|
|---|---|
| Flooding frequency | None |
| Ponding duration | Very brief (4 to 48 hours) to long (7 to 30 days) |
| Ponding frequency | Occasional to frequent |
| Elevation | 3,900 – 4,200 ft |
| Slope | 1% |
| Water table depth | 5 – 30 in |
| Aspect | Aspect is not a significant factor |
Climatic features
Annual average precipitation ranges from 7 to 12 inches. Wide fluctuations from year to year are common. At least one-half of the annual precipitation comes in the form of rainfall during July, August, and September. Precipitation in the form of snow or sleet averages less than 4 inches annually. The average annual air temperature is about 60 degree F. Summer maximums can exceed 100 degrees F. and winter minimums can go below zero. The average frost-free season exceeds 200 days and extends from April 1 to November 1. Both the temperature regime and rainfall distribution favor warm-season perennial plants on this site. Spring moisture conditions are only occasionally adequate to cause significant growth during this period of year. High winds from the west and southwest are common from March to June, which further tends to create poor soil moisture conditions in the springtime
Climate data was obtained from
http://www.wrcc.dri.edu/summary/climsmnm.html
Table 3. Representative climatic features
| Frost-free period (average) | 205 days |
|---|---|
| Freeze-free period (average) | 227 days |
| Precipitation total (average) | 12 in |
Figure 2. Monthly precipitation range
Figure 3. Monthly average minimum and maximum temperature
Influencing water features
This site is not influenced by water from a wetland or stream.
Soil features
The soils of this site are poorly drained, strongly saline, gypseous eolian sands. Depth to the seasonal high water table is variable, but ranges from 24 to 60 inches. The surface soils are typically salt-encrusted gypsiferous sands and sandy loams. Underlying soils are strongly saline gypsiferous sands.
Minimum and maximum values listed below represent the characteristic soils for this site.
Characteristic soils:
NM688 MU-425 Gyplaya
Table 4. Representative soil features
| Parent material |
(1)
Eolian sands
–
rock gypsum
|
|---|---|
| Surface texture |
(1) Gypsiferous sand (2) Gypsiferous loamy sand (3) Gypsiferous sandy loam |
| Drainage class | Somewhat poorly drained to poorly drained |
| Permeability class | Moderate to moderately rapid |
| Soil depth | 60 in |
| Surface fragment cover <=3" | Not specified |
| Surface fragment cover >3" | Not specified |
| Available water capacity (0-40in) |
1 in |
| Electrical conductivity (0-40in) |
50 – 150 mmhos/cm |
| Soil reaction (1:1 water) (0-40in) |
7 – 8 |
| Subsurface fragment volume <=3" (Depth not specified) |
Not specified |
| Subsurface fragment volume >3" (Depth not specified) |
Not specified |
Ecological dynamics
Overview: There is no one assumed potential community for the Gyp Playa site, instead, multiple communities exist occupying specific zones. These zones and their associated species composition and production seem to be controlled by depth to water table and ponding duration.
The majority of the playa from the center outward is bare. Moving out from the barren flat center onto the slightly higher edge a community dominated by Iodinebush is the first to appear. As the depth to the water table continues to increase, inland saltgrass occupies the next higher zone and alkali sacaton the highest. The width of the vegetation band within each zone is determined by the degree of rise. On areas where the rise is a long gradual slope the band can be wide. The wider bands typically occur on the downwind side of the playa. On areas where the rise is steep (usually the upwind bank) the band of vegetation is narrow. While distinct zones of vegetation do occur, ecotones commonly exist where adjacent vegetation communities intergrade. This site is susceptible to invasion by saltcedar. Once saltcedar is well established it can eventually dominate areas of the site where the depth to water is maintained within its range of tolerance.
State and transition model

Figure 4. Gyp Playa model
More interactive model formats are also available.
View Interactive Models
More interactive model formats are also available.
View Interactive Models
Click on state and transition labels to scroll to the respective text
Ecosystem states
State 1 submodel, plant communities
State 2 submodel, plant communities
State 3 submodel, plant communities
State 4 submodel, plant communities
State 1
Playa Edge
Communities on the edges of the playa tend to occur as bands of vegetation that occupy specific zones. However, each community typically intergrades with those adjoining at the ecotones.
Community 1.1
Alkali sacaton

Figure 5. Alkali sacaton
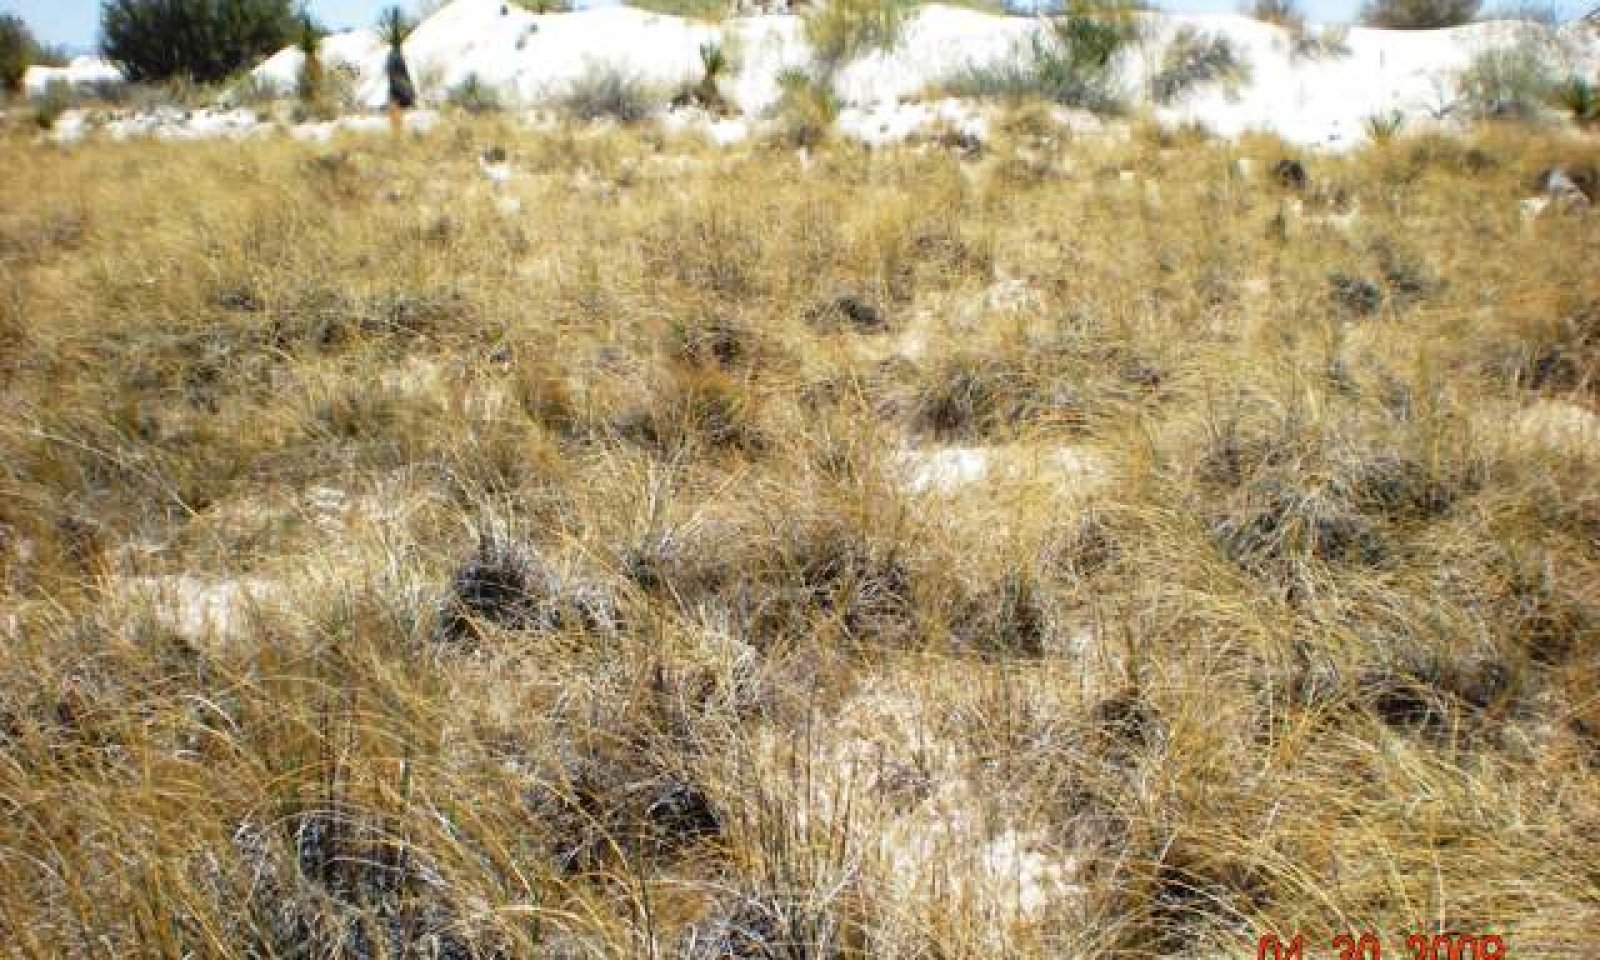
This community occupies the upper-most zone of the playa edge. Alkali sacaton is dominant and occurs in large tussocks. Other species typically include inland saltgrass and Trans-Pecos sea lavender. Occasionally, frankennia and Trans-Pecos false clapdaisy may be present. This community can be highly productive especially on the leeward side of the playa. Communities on the windward side are much less productive.
Figure 6. Annual production by plant type (representative values) or group (midpoint values)
Table 5. Annual production by plant type
| Plant type | Low (lb/acre) |
Representative value (lb/acre) |
High (lb/acre) |
|---|---|---|---|
| Grass/Grasslike | 265 | 1000 | 2150 |
| Shrub/Vine | 0 | 25 | 50 |
| Forb | 5 | 15 | 25 |
| Total | 270 | 1040 | 2225 |
Community 1.2
Inland saltgrass
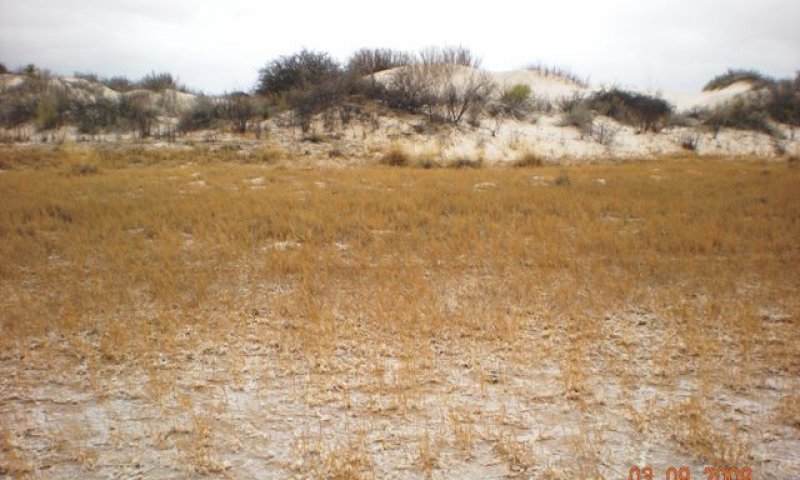
Figure 7. Inland saltgrass
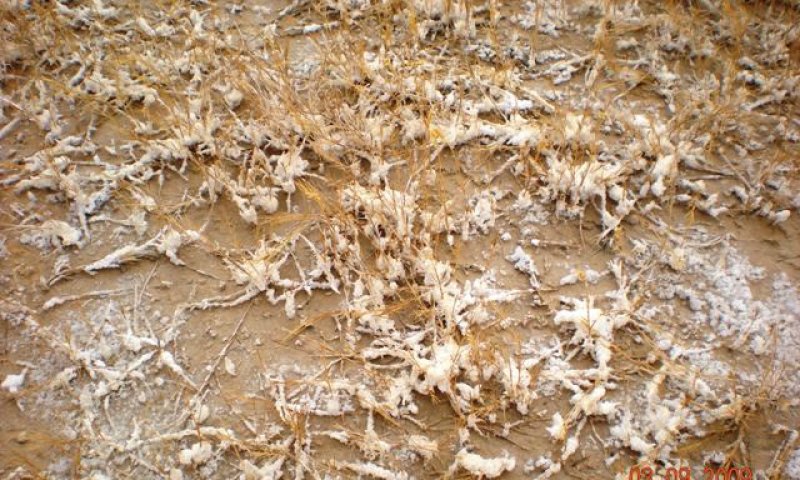
Figure 8. Saltgrass close-up photo
Inland saltgrass is the dominant species. Other species include Trans-Pecos sea lavender, alkali sacaton, and scattered iodinebush, Saltgrass has a high tolerance to both salinity and anerobic conditions.
Community 1.3
Iodinebush
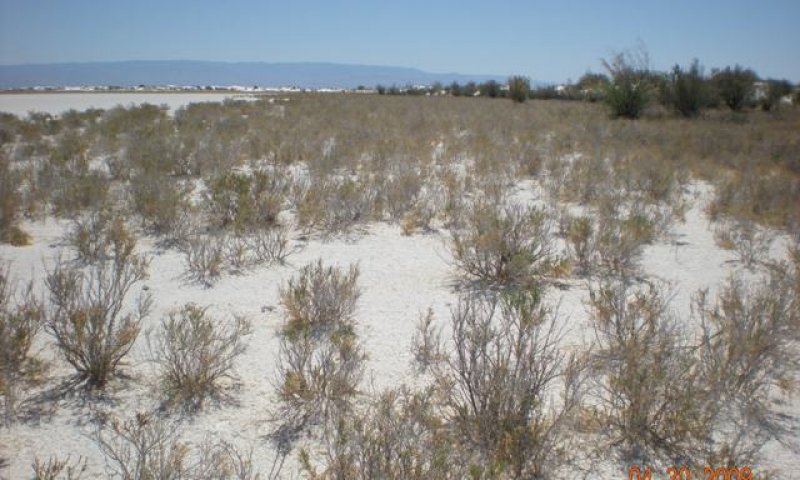
Figure 9. Iodinebush
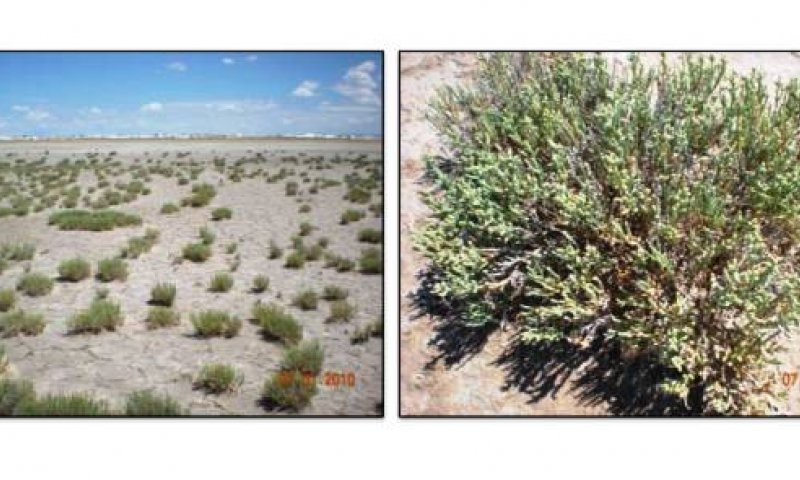
Figure 10. Utah swampfire
This is the first community moving up from the barren playa center. Iodinebush is dominant. Other species may include Trans-Pecos sea lavender, and alkali seepweed. Iodinebush seems to have very high tolerance to salinity and extended periods of inundation (anaerobic conditions). In some localized areas Utah swampfire (Sarcocornia utahensis) may be dominant with Iodinebush occurring as sub-dominant.
State 2
Exotic-Invaded
This state is characterized by the presence of saltcedar. The inland saltgrass community and associated ecotones seem to be most susceptible to the invasion of saltcedar. The depth to the water table of the iodinebush vegetation zone may be too shallow to allow establishment of saltcedar seedlings. Inland saltgrass is dominant.
Community 2.1
Alkali sacaton/Saltcedar
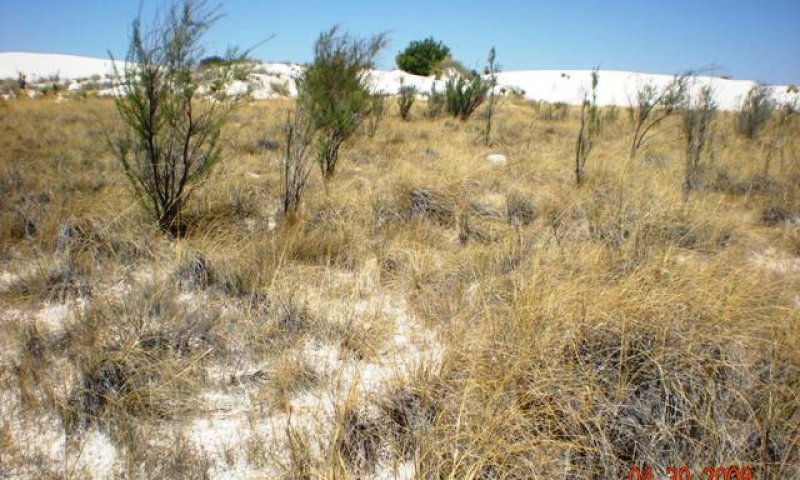
Figure 11. Saltcedar Invaded
Alkali sacaton is the dominant species, with scattered individual saltcedar present in varying amounts. This community occurs on the higher portion of the playa edge.
Community 2.2
Inland saltgrass/Saltcedar
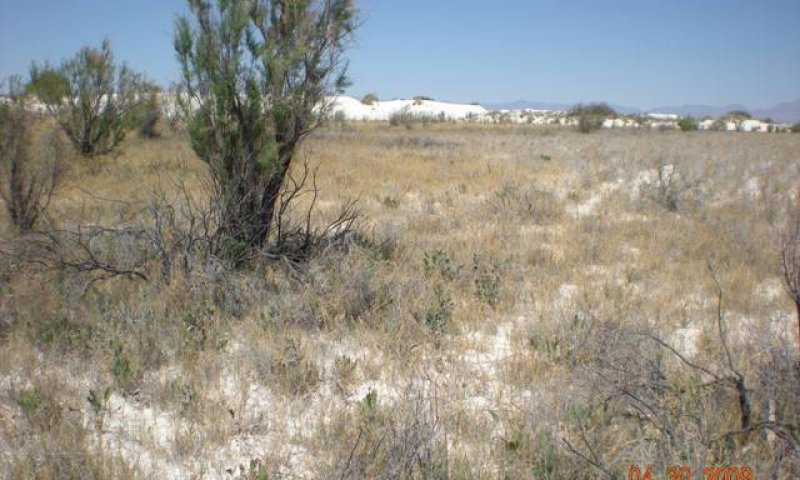
Figure 12. Saltgrass/saltcedar
Inland saltgrass is dominant with varying amounts of scattered saltcedar present.
State 3
Exotic-Dominated
Saltcedar may dominate, typically in relatively narrow bands that ring a portion of the playa.
Community 3.1
Saltcedar
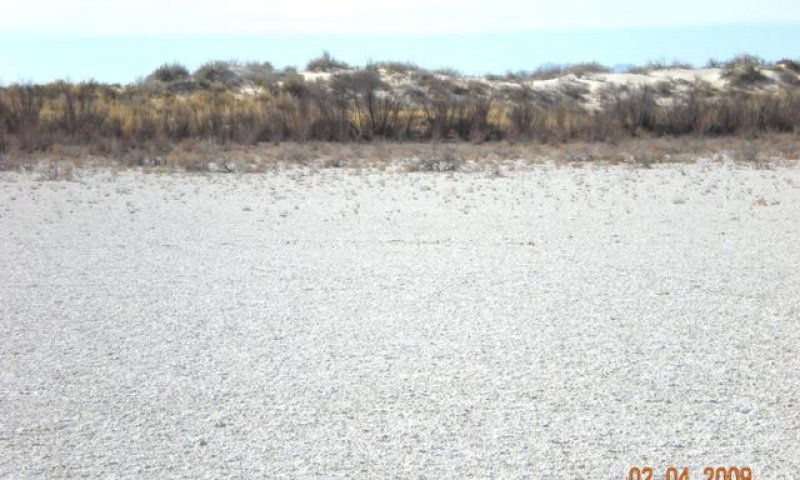
Figure 13. Saltcedar band
Saltcedar is the dominant species. Inland saltgrass may still be present, but as a minor component usually occupying small depressions or scattered outside clusters of saltcedar. Other species that may be present include alkali seepweed, iodinebush, alkali sacaton and Trans-Pecos sea lavender.
State 4
Playa Center
The playa center is typically devoid of vegetation. This is believed to be due to the strongly saline shallow water table and/or extended periods of inundation following heavy rainfall events.
Community 4.1
Barren
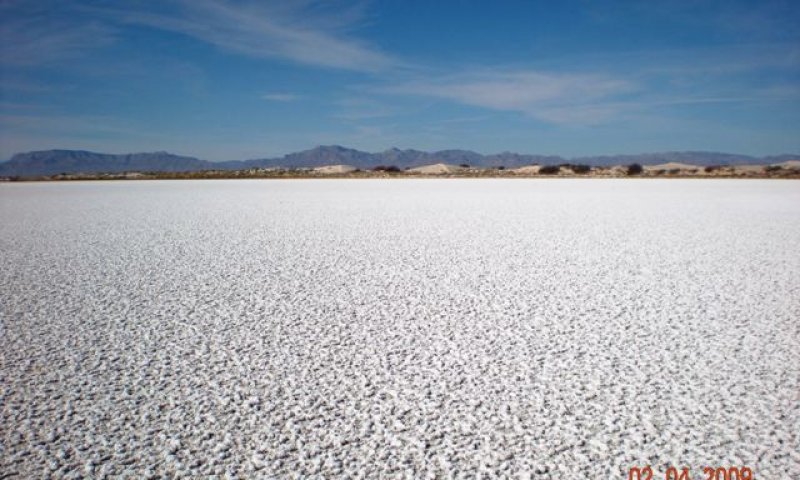
Figure 14. Playa Center
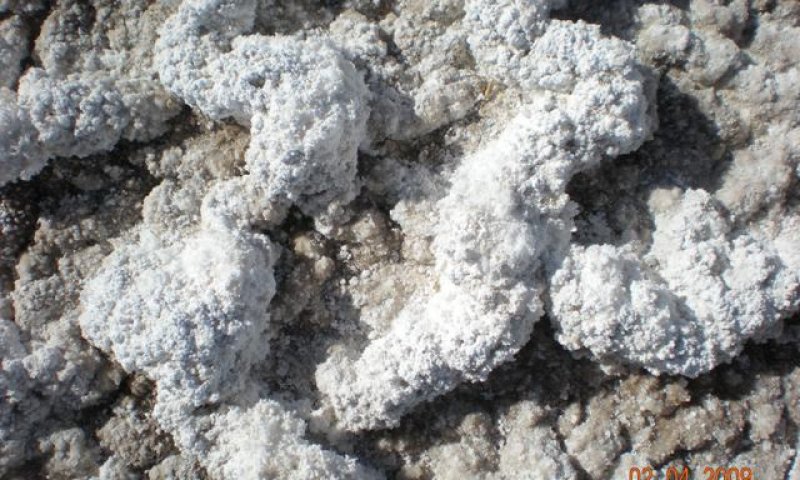
Figure 15. Surface close-up photo
The absence of vegetation characterizes this community phase.
Transition T1A
State 1 to 2
Introduction of seed is the primary factor in the cause of this transition. Due to the presence of a shallow water table, soils on this site usually contain adequate soil moisture necessary for seed germination. Locations adjacent to areas with an abundant seed source may also increase the likelihood of this transition.
Restoration pathway R2A
State 2 to 1
Brush management by chemical, mechanical or a combination can be used to remove saltcedar and return to the Grass/Shrub state. Manually removing and treating the cut stumps with“Garlon” is effective in the treatment of saltcedar. Additionally, spraying with “Arsenal” also has exhibited high kill rates. Regardless of the means of treatment, monitoring and follow-up will be necessary to insure missed plants and regrowth is addressed.
Transition T2A
State 2 to 3
Dense stands of saltcedar can occupy areas where the depth to water table is within the 5-20 ft. range. Additionally once established saltcedar is a fierce competitor for resources with its extensive root system, high seed production, and high salinity tolerance.
Restoration pathway R3A
State 3 to 2
Saltcedar must first be removed mechanically, chemically, or by a combination of these techniques. Monitoring and follow-up treatment is necessary to address plants that were missed during initial treatment and the subsequent re-growth of treated trees. Seeding with native species (such as inland saltgrass) which are capable of withstanding high salinity levels may help to compete against new saltcedar seedlings. Since water table depth is the key factor in the domination by saltcedar, treatment methods that cause a change in hydrology may be beneficial.
Additional community tables
Table 6. Community 1.1 plant community composition
| Group | Common name | Symbol | Scientific name | Annual production (lb/acre) | Foliar cover (%) | |
|---|---|---|---|---|---|---|
|
Grass/Grasslike
|
||||||
| 1 | Warm Season Midgrass | 250–2000 | ||||
| alkali sacaton | SPAI | Sporobolus airoides | 250–2000 | 15–50 | ||
| 2 | Warm-season short grasses | 15–150 | ||||
| saltgrass | DISP | Distichlis spicata | 15–150 | 1–5 | ||
|
Forb
|
||||||
| 3 | Perennial forbs | 5–25 | ||||
| spreading alkaliweed | CRTR5 | Cressa truxillensis | 5–15 | – | ||
| Trans-Pecos sea lavender | LILI4 | Limonium limbatum | 5–15 | – | ||
| Forb, perennial | 2FP | Forb, perennial | 3–7 | – | ||
| Forb, annual | 2FA | Forb, annual | 3–5 | – | ||
|
Shrub/Vine
|
||||||
| 4 | Sub-shrubs | 0–50 | ||||
| James' seaheath | FRJA | Frankenia jamesii | 0–25 | – | ||
| Trans-Pecos false clapdaisy | PSAR | Pseudoclappia arenaria | 0–25 | – | ||
Table 7. Community 1.2 plant community composition
| Group | Common name | Symbol | Scientific name | Annual production (lb/acre) | Foliar cover (%) |
|---|
Table 8. Community 1.3 plant community composition
| Group | Common name | Symbol | Scientific name | Annual production (lb/acre) | Foliar cover (%) |
|---|
Table 9. Community 2.2 plant community composition
| Group | Common name | Symbol | Scientific name | Annual production (lb/acre) | Foliar cover (%) |
|---|
Interpretations
Animal community
Animal Community:
Most animal species that frequent this site utilize the playa edge for hiding and thermal cover. Characteristic animals include coyote, black-tailed jackrabbit, desert cottontail, loggerhead shrike, horned lark, meadowlark, White Sands prairie lizard, White sands woodrat, Ord’s kangaroo rat, and the spotted ground squirrel. The Camel cricket, tiger beetle, lycosid spiders, and scorpions are also common to this site. Oryx (introduced African antelope) make use of the playas utilizing the shrub and tree cover along the playa edge, and also using the barren playa center as a source for water and salt.
Hydrological functions
This site is somewhat poorly drained with a seasonal high water table ranging from 0 to 40 inches in depth. It frequently ponds water following summer rainstorms.
Recreational uses
The scenic potential for photography, and nature hiking is quite high. Predator and oryx hunting can be productive on this site. Where this site occurs on areas of White Sands Missile Range and White Sands National Monument access is limited.
Wood products
The site has little, if any, significant value for wood products.
Other products
Gypsum
Supporting information
Other references
References:
Bennett, J., Wilder, D., 2009. Physical resources foundation report, White Sands National Monunent, Natural Resource Report NPS/NRPC/NRR—2009/166. National Park Service, Fort Collins, Colorado.
Di Tomaso, J. M., 1998. Impact, Biology, and Ecology of Saltcedar (Tamarix spp.) in the Southwestern United States. Weed Technology. 12: 326-336.
Fryberger, S.G., 2000. Geological overview of White Sands National Monument. http://www.nature.nps.gov/geology/parks/whsa/geows/index.htm
Kocurek , G., Carr, M.,Ewing, R., Havholm, K.G., Nagar, Y.C., Singhvi, a.K. 2007. White Sands Dune Field, New Mexico: Age, dune dynamics and recent accumulations. Sedimentaty Geology 197 (2007) 313-331
Langford, R.P., Rose, J.M., White, D.E., 2009. Groundwater salinity as a control on development of eolian landscape: An example from White Sands of New Mexico. Geomorphology 105(2009) 39-49.
Muldavin, E., Chauvin, Y., Harper, G., 2000 The Vegetation of White Sands Missile Range, New Mexico. Volume 1: Handbook of Vegetation Communities. Final Report, New Mexico Natural Heritage Program. University of New Mexico. Albuquerque, New Mexico.
Contributors
David Trujillo
Rangeland health reference sheet
Interpreting Indicators of Rangeland Health is a qualitative assessment protocol used to determine ecosystem condition based on benchmark characteristics described in the Reference Sheet. A suite of 17 (or more) indicators are typically considered in an assessment. The ecological site(s) representative of an assessment location must be known prior to applying the protocol and must be verified based on soils and climate. Current plant community cannot be used to identify the ecological site.
| Author(s)/participant(s) | |
|---|---|
| Contact for lead author | |
| Date | |
| Approved by | |
| Approval date | |
| Composition (Indicators 10 and 12) based on | Annual Production |
Indicators
-
Number and extent of rills:
-
Presence of water flow patterns:
-
Number and height of erosional pedestals or terracettes:
-
Bare ground from Ecological Site Description or other studies (rock, litter, lichen, moss, plant canopy are not bare ground):
-
Number of gullies and erosion associated with gullies:
-
Extent of wind scoured, blowouts and/or depositional areas:
-
Amount of litter movement (describe size and distance expected to travel):
-
Soil surface (top few mm) resistance to erosion (stability values are averages - most sites will show a range of values):
-
Soil surface structure and SOM content (include type of structure and A-horizon color and thickness):
-
Effect of community phase composition (relative proportion of different functional groups) and spatial distribution on infiltration and runoff:
-
Presence and thickness of compaction layer (usually none; describe soil profile features which may be mistaken for compaction on this site):
-
Functional/Structural Groups (list in order of descending dominance by above-ground annual-production or live foliar cover using symbols: >>, >, = to indicate much greater than, greater than, and equal to):
Dominant:
Sub-dominant:
Other:
Additional:
-
Amount of plant mortality and decadence (include which functional groups are expected to show mortality or decadence):
-
Average percent litter cover (%) and depth ( in):
-
Expected annual annual-production (this is TOTAL above-ground annual-production, not just forage annual-production):
-
Potential invasive (including noxious) species (native and non-native). List species which BOTH characterize degraded states and have the potential to become a dominant or co-dominant species on the ecological site if their future establishment and growth is not actively controlled by management interventions. Species that become dominant for only one to several years (e.g., short-term response to drought or wildfire) are not invasive plants. Note that unlike other indicators, we are describing what is NOT expected in the reference state for the ecological site:
-
Perennial plant reproductive capability:
Print Options
Sections
Font
Other
The Ecosystem Dynamics Interpretive Tool is an information system framework developed by the USDA-ARS Jornada Experimental Range, USDA Natural Resources Conservation Service, and New Mexico State University.
Click on box and path labels to scroll to the respective text.