
Natural Resources
Conservation Service
Ecological site EX043B23A140
Saline Lowland Drained (SLDr) Absaroka Lower Foothills
Last updated: 10/04/2019
Accessed: 03/30/2025
General information
Provisional. A provisional ecological site description has undergone quality control and quality assurance review. It contains a working state and transition model and enough information to identify the ecological site.

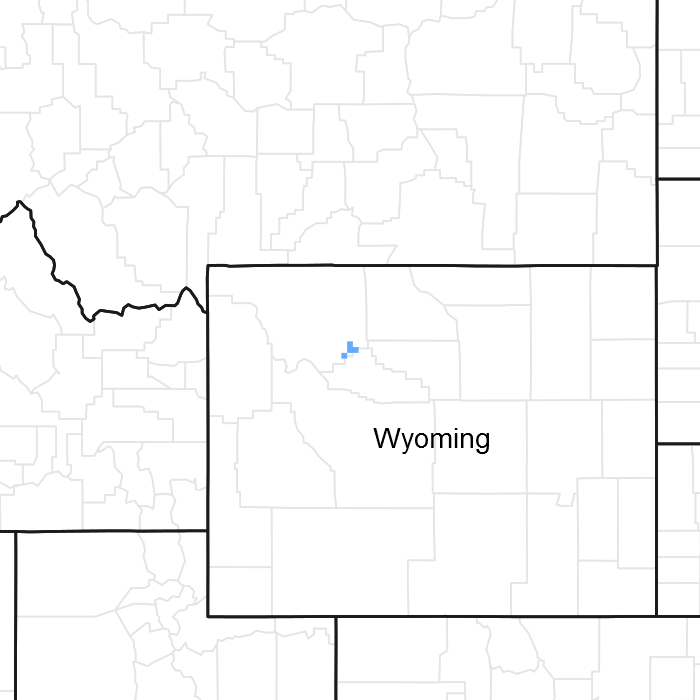
Figure 1. Mapped extent
Areas shown in blue indicate the maximum mapped extent of this ecological site. Other ecological sites likely occur within the highlighted areas. It is also possible for this ecological site to occur outside of highlighted areas if detailed soil survey has not been completed or recently updated.
MLRA notes
Major Land Resource Area (MLRA): 043B–Central Rocky Mountains
Major Land Resource Unit (MLRA) 43B: Central Rocky Mountains
43B – Central Rocky Mountains – The Central Rocky Mountains extends from northern Montana to southern extent of Wyoming and from Idaho to central Wyoming. The southern extent of 43B is comprised of a combination of metamorphic, igneous, and sedimentary mountains and foothills. Climatic changes across this extent are broad and create several unique breaks in the landscape.
Further information regarding MLRAs, refer to: United States Department of Agriculture, Natural Resources Conservation Service. 2006. Land Resource Regions and Major Land Resource Areas of the United States, the Caribbean, and the Pacific Basin. U.S. Department of Agriculture Handbook 296.
Available electronically at: http://www.nrcs.usda.gov/wps/portal/nrcs/detail/soils/ref/?cid=nrcs142p2_053624#handbook.
LRU notes
Land Resource Unit (LRU) 43B23A: Absaroka Lower Foothills
Based on the shifts in geology, precipitation patterns and other climatic factors, as well as elevations and vegetation, the Absaroka Range was divided into LRU 23. Further division of this LRU is necessary due to the gradient moving from the foothills to the summit, as well as aspect shifts (north/east face versus south/west face). Subset A is set for the lower elevations within the foothills with 10 to 14 inches of precipitation. To verify or identify the LRU A (the referenced LRU for this ecological site), refer to the Wyoming LRU matrix key contained within the Ecological Site Key. This particular LRU occurs along the eastern lower foothills of the Absaroka Range. This LRU starts north of Clark, WY and runs to the Thermopolis, WY area. Once the foothills cross into the Northern Beartooth Range, the climatic patterns and elevation changes shifts the plant community and allows for a break in LRU's near the Montana state line. As the LRU follows to the south and tracks east with the intersection of the Absaroka and Owl Creek Ranges, the face changes aspect and geology creating a shift in plant dynamics and a break in the LRU. The extent of soils currently correlated to this ecological site does not fit within the digitized boundary. Many of the noted soils are provisional and will be reviewed and corrected in mapping update projects. Other map units are correlated as small inclusions within other MLRA’s/LRU’s based on elevation, landform, and biological references.
Moisture Regime: Aridic Ustic or Ustic Aridic – Progressive Initial mapping has shown that soil correlations completed prior to 2014 were identified as ustic aridic, after further evaluation of climatic and soil taxonomy information the proper moisture regime is aridic ustic. Both are recorded here until an update project is completed to correct the previous correlations.
Temperature Regime: Frigid
Dominant Cover: Rangeland – Sagebrush Steppe (major species is Wyoming Big Sagebrush)
Representative Value (RV) Effective Precipitation: 10-14 inches (254 – 355 mm)
RV Frost-Free Days: 80-110 days
Classification relationships
Relationship to Other Established Classification Systems:
National Vegetation Classification System (NVC):
3 Xeromorphic Woodland, Scrub & Herb Vegetation Class
3.B Cool Semi-Desert Scrub & Grassland Subclass
3.B.1 Cool Semi-Desert Scrub & Grassland formation
3.B.1.NE Western North American Cool Semi-Desert Scrub & Grassland Division
M169 Great Basin & Intermountain Tall Sagebrush Shrubland & Steppe Macrogroup
Ecoregions (EPA):
Level I: 10 North American Deserts Level II: 10.1 Cold Deserts
Level III: 10.1.18 Wyoming Basin
Level IV: 10.1.18.b Big Horn Basin and
10.1.18.d Foothills and Low Mountains
Ecological site concept
• Site receives additional moisture from surrounding uplands.
• Site exists along degraded (down-cut) channel systems that have had a significant drop in the water table.
• Slope is < 6%
• Soils are:
o Textures range from sandy loam to clay in top 4” (10 cm) of mineral soil surface, and varies within profile.
o All subsurface horizons in the particle size control section have a weighted average of <18% clay. (The particle size control section is the segment of the profile from either the start of an argillic horizon for 50 cm’s or from 25-100 cm’s).
o Moderately deep to very deep (20-80+ in. (50-200+ cm)
o Not skeletal (<35% rock fragments) within 20” (50 cm) of mineral soil surface, may have stratification with gravels.
o None to Slightly effervescent throughout top 20” (50 cm) of mineral soil surface
o Saline, sodic, or saline-sodic; but this may occur deeper in the profile (within rooting zone of woody species).
These are saline soils found along drainage ways with a water table below rooting depth of woody plants, usually as a result of down cutting or gully erosion. Soils may not have visible salt chemistry, but plants are still indicating a salty environment (greasewood, gardner's saltbush, alkali sacaton, and inland saltgrass).
Associated sites
R032XY338WY |
Saline Lowland (SL) 10-14" East Precipitation Zone Saline Lowland sites are found within the active channel, while the Saline Lowland Drained sites are found on the upper banks of the down-cut portions of the channel system. |
---|---|
R032XY328WY |
Lowland (LL) 10-14" East Precipitation Zone Lowland sites are found within active channels, while Saline Lowland Drained sites are found on the upper banks of the down-cut portions of the channel system. |
R032XY344WY |
Saline Upland (SU) 10-14" East Precipitation Zone Saline Upland sites are found up slopes or a step above the Saline Lowland Drained sites, on positions not receiving any additional moisture. |
R032XY304WY |
Clayey (Cy) 10-14" East Precipitation Zone Clayey sites are found up slope or the step above these lowland soils. Clayey also is lacking the soil chemistry that is or was characteristic of Saline Lowland Drained. Clayey resides on portions of the landscape not receiving any additional moisture. |
Similar sites
R032XY240WY |
Saline Lowland Drained (SLDr) 5-9” Wind River Basin Precipitation Zone Saline Lowland, Drained 5-9" Wind River Basin Precipitation Zone is lower in production than this site. |
---|
Table 1. Dominant plant species
Tree |
Not specified |
---|---|
Shrub |
(1) Sarcobatus vermiculatus |
Herbaceous |
(1) Sporobolus airoides |
Legacy ID
R043BX540WY
Physiographic features
This site normally occurs on land that receives overflow or runoff from adjacent slopes.
Table 2. Representative physiographic features
Landforms |
(1)
Foothills
> Alluvial fan
(2) Foothills > Drainageway (3) Foothills > Erosion remnant |
---|---|
Runoff class | Low to medium |
Flooding duration | Brief (2 to 7 days) |
Flooding frequency | None to occasional |
Ponding duration | Brief (2 to 7 days) |
Ponding frequency | None to rare |
Elevation | 5,400 – 7,500 ft |
Slope | 6% |
Aspect | Aspect is not a significant factor |
Climatic features
Annual precipitation and modeled relative effective annual precipitation ranges from 10 to 14 inches (254 – 355 mm). The normal precipitation pattern shows peaks in May and June and a secondary peak in September. This amounts to about 50% of the mean annual precipitation. Much of the moisture that falls in the latter part of the summer is lost by evaporation and much of the moisture that falls during the winter is lost by sublimation. Average snowfall is about 20 inches annually. Wide fluctuations may occur in yearly precipitation and result in more dry years than those with more than normal precipitation.
Temperatures show a wide range between summer and winter and between daily maximums and minimums, due to the high elevation and dry air, which permits rapid incoming and outgoing radiation. Cold air outbreaks from Canada in winter move rapidly from northwest to southeast and account for extreme minimum temperatures. Chinook winds may occur in winter and bring rapid rises in temperature. Extreme storms may occur during the winter, but most severely affect ranch operations during late winter and spring. High winds are generally blocked from the basin by high mountains, but can occur in conjunction with an occasional thunderstorm. Growth of native cool-season plants begins about April 15th and continues until about July 1st. Cool weather and moisture in September may produce some green up of cool season plants that will continue through late October.
Review of a 30 year trend of data for Average Temperature as well as Average Precipitation, there has been a warming trend, but as the last 12 years graphed, the temperatures have swayed high and low, but overall it has maintained a steady trajectory, neither increasing nor decreasing. Where on the moisture side, the trajectory in trend has been a slow decline. The swings of when spring warm up and first frost hit with the decline in average precipitation have produced a drought effect where the moisture is not being received when the plants and ground is able to utilize the moisture. And in some cases, the late precipitation has encouraged the warm season or mat forming species over the cool season bunchgrasses that are the drivers of the natural system. Early frosts, with dry open winters has created a more arid or desert effect on plants resulting in high rates of winter kill, loss of vigor or overall damage to the plant.
For detailed information visit the Natural Resources Conservation Service National Water and Climate Center at http://www.wcc.nrcs.usda.gov/. “Buffalo Bill Dam", "Cody 21SW", "Thermopolis", "Thermopolis 25WNW" and "Wapiti 1NE" are the representative weather stations within LRU D. The following graphs and charts are a collective sample representing the averaged normals and 30 year annual rainfall data for the selected weather stations from 1981 to 2010.
Table 3. Representative climatic features
Frost-free period (characteristic range) | 64-106 days |
---|---|
Freeze-free period (characteristic range) | 101-144 days |
Precipitation total (characteristic range) | 11-12 in |
Frost-free period (actual range) | 46-118 days |
Freeze-free period (actual range) | 88-147 days |
Precipitation total (actual range) | 10-13 in |
Frost-free period (average) | 80 days |
Freeze-free period (average) | 117 days |
Precipitation total (average) | 12 in |
Figure 2. Monthly precipitation range
Figure 3. Monthly minimum temperature range
Figure 4. Monthly maximum temperature range
Figure 5. Monthly average minimum and maximum temperature
Figure 6. Annual precipitation pattern
Figure 7. Annual average temperature pattern
Climate stations used
-
(1) BUFFALO BILL DAM [USC00481175], Cody, WY
-
(2) WAPITI 1NE [USC00489467], Cody, WY
-
(3) CODY 21 SW [USC00481855], Cody, WY
-
(4) SUNSHINE 3NE [USC00488758], Meeteetse, WY
-
(5) THERMOPOLIS 25WNW [USC00488888], Thermopolis, WY
-
(6) THERMOPOLIS [USC00488875], Thermopolis, WY
Influencing water features
The characteristics of these soils are derived from have no current influence from ground water (water table below 60 inches (150 cm)), but there is evidence of a historic water table that has been removed by the down-cutting of the stream channel or loss of hydrology. These sites have a continued influence from surface water/overland flow.
Wetland description
No wetland or stream type are identified in this site, but it is typically associated with these features.
Soil features
The soils of this site are moderately deep and very deep poorly to well-drained soils formed in alluvium. These soils have moderate to rapid permeability and are moderately to strongly saline and/or alkaline. Higher soluble salt concentrations may be found in the subsoils. The surface soil will be highly variable and vary from 2 to 8 inches in thickness. A water table if present is below 5 feet and is too deep to benefit the herbaceous species. These areas are subject to occasional overflow. The soil characteristics having the most influence on the plant community are the elimination of the water table near the surface, reduction in the potential to flood and the elevated quantities of soluble salts.
Major Soil Series correlated to this site include: Archin, Archin-like, Creed-like, Foreleft-like, and Ulm.
Table 4. Representative soil features
Parent material |
(1)
Alluvium
–
sandstone and shale
|
---|---|
Surface texture |
(1) Gravelly loam (2) Clay loam (3) Silt loam (4) Sandy clay loam (5) Clay (6) Fine sandy loam |
Family particle size |
(1) Loamy |
Drainage class | Poorly drained to well drained |
Permeability class | Moderate to moderately rapid |
Soil depth | 20 – 60 in |
Available water capacity (0-40in) |
3.3 – 4.5 in |
Calcium carbonate equivalent (0-40in) |
10% |
Electrical conductivity (0-40in) |
4 – 16 mmhos/cm |
Sodium adsorption ratio (0-40in) |
13 – 40 |
Soil reaction (1:1 water) (0-40in) |
7.4 – 9 |
Ecological dynamics
This site occurs as a direct result of a hydrologic disruption to the Saline Lowland 10-14 Foothills and Basins East ecological site (See Saline Lowland Ecological Site Description). This disturbance, whether natural or human caused, alters the hydrologic function of a Saline Lowland to such a degree that rehabilitation is not an option. As a result, subsoil that at one time was sufficiently moist during part of the growing season is literally drained as water is now diverted to deeply incised channels. Consequently, supplemental water that was predictable and available to herbaceous plants during part of the growing year is now lacking and the water table is permanently below the rooting depth of these plants. This site, however, gets occasional overflow from the adjacent uplands and the water table is commonly at a depth that is still beneficial to deep-rooted shrub species.
Potential vegetation on this site is dominated by tall and mid perennial grasses, which can tolerate soils with moderate amounts of salinity and/or alkalinity and adapt to periodic overflows. Other significant vegetation includes greasewood, rubber rabbitbrush, and a variety of forbs. The expected potential composition for this site is about 75% grasses, 10% forbs and 15% woody plants. The composition and production will vary naturally due to historical use, fluctuating precipitation and fire frequency.
As this site deteriorates, species such as inland saltgrass and greasewood will increase. Weedy annuals will invade. Grasses such as alkali sacaton, rhizomatous wheatgrasses, Indian ricegrass and basin wildrye will decrease in frequency and production.
The Historic Climax Plant Community (description follows the plant community diagram) has been determined by study of rangeland relic areas, or areas protected from excessive disturbance. Trends in plant communities going from heavily grazed areas to lightly grazed areas, seasonal use pastures, and historical accounts have also been used.
The following is a State and Transition Model Diagram that illustrates the common plant communities (states) that can occur on the site and the transitions between these communities. The ecological processes will be discussed in more detail in the plant community narratives following the diagram.
Plant Community Narratives
Following are the narratives for each of the described plant communities. These plant communities may not represent every possibility, but they probably are the most prevalent and repeatable plant communities. The plant composition tables shown above have been developed from the best available knowledge at the time of this revision. As more data is collected, some of these plant communities may be revised or removed, and new ones may be added. None of these plant communities should necessarily be thought of as “Desired Plant Communities”. According to the USDA NRCS National Range and Pasture Handbook, Desired Plant Communities (DPC’s) will be determined by the decision-makers and will meet minimum quality criteria established by the NRCS. The main purpose for including any description of a plant community here is to capture the current knowledge and experience at the time of this revision.
State and transition model

More interactive model formats are also available.
View Interactive Models
More interactive model formats are also available.
View Interactive Models
Click on state and transition labels to scroll to the respective text
State 1 submodel, plant communities
State 2 submodel, plant communities
State 3 submodel, plant communities
State 4 submodel, plant communities
State 5 submodel, plant communities
State 6 submodel, plant communities
State 1
Inland Saltgrass/ Basin Wildrye/ Alkali Sacaton
Community 1.1
Inland Saltgrass/ Basin Wildrye/ Alkali Sacaton
The interpretive plant community for this site is the Historic Climax Plant Community. This state evolved with grazing by large herbivores and periodic fires. Potential vegetation is about 75% grasses or grass-like plants, 10% forbs and 15% woody plants. Tall and medium grasses, which can tolerate saline and/or alkali conditions and occasional overflows, dominate this plant community. The major grasses include inland saltgrass, basin wildrye, alkali sacaton, and rhizomatous wheatgrasses, Woody plants include primarily greasewood and Gardner’s saltbush, but rubber rabbitbrush and basin big sagebrush can also occur. A variety of forbs also occurs in this state and plant diversity is high (see Plant Composition Table). The total annual production (air-dry weight) of this state is about 900 pounds per acre, but it can range from about 500 lbs./acre in unfavorable years to about 1200 lbs./acre in above average years. This state is stable and well adapted to the Northern Intermountain Desertic Basins climatic conditions. The diversity in plant species allows for high drought resistance. This is a sustainable plant community (site/soil stability, watershed function, and biologic integrity). Typically, relic rills and gullies are visible but are now stable. No recent accelerated erosion should be occurring in this state. Transitions or pathways leading to other plant communities are as follows: • Moderate, continuous season-long grazing will convert this plant community to the Inland Saltgrass/Rhizomatous Wheatgrasses/Greasewood Plant community. Prolonged drought will exacerbate this transition.
Figure 8. Annual production by plant type (representative values) or group (midpoint values)
Figure 9. Plant community growth curve (percent production by month). WY0701, 10-14E upland sites.
Jan | Feb | Mar | Apr | May | Jun | Jul | Aug | Sep | Oct | Nov | Dec |
---|---|---|---|---|---|---|---|---|---|---|---|
J | F | M | A | M | J | J | A | S | O | N | D |
5 | 25 | 40 | 10 | 5 | 10 | 5 |
State 2
Inland Saltgrass/ Rhizomatous Wheatgrasses/ Greasewood
Community 2.1
Inland Saltgrass/ Rhizomatous Wheatgrasses/ Greasewood
This plant community evolved under moderate grazing by domestic livestock and low fire frequency. Saline tolerant grasses make up the majority of the understory. The dominant grasses include rhizomatous wheatgrasses, bottlebrush squirreltail, inland saltgrass, alkali bluegrass, blue grama, and alkali sacaton. Forbs commonly found in this plant community include wild onion, pursh seepweed, smooth woodyaster, and povertyweed. Greasewood and Gardner’s saltbush may comprise as much as 20% of the total annual production. When compared to the Historical Climax Plant Community, basin wildrye, Indian ricegrass, and alkali sacaton have decreased. Inland Saltgrass, blue grama, greasewood and rubber rabbitbrush have increased. Total production is less as the tall and mid-grasses have been reduced. The total annual production (air-dry weight) of this state is about 700 pounds per acre, but it can range from about 450 lbs./acre in unfavorable years to about 1000 lbs./acre in above average years. This state is stable and protected from excessive erosion. The herbaceous component is mostly intact and plant vigor and replacement capabilities are sufficient. Only minimal occurrences of water flow patterns and litter movement is evident. Incidence of pedestalling is minimal. Soils are mostly stable and the surface shows minimum soil loss. Typically, relic rills and gullies are visible but are now stable. The watershed is functioning and the biotic community is intact. Transitional pathways leading to other plant communities are as follows: • Prescribed grazing or possibly long-term prescribed grazing will result in a plant community very similar to the Historic Climax Plant Community, except that greasewood will persist without a return to a normal fire regime or some form of brush control. • Frequent and severe grazing and no fire with the occasional overflow will convert this plant community to the Mixed Shrub/Short Grass Sod Plant Community. • Encroachment and no fire will convert this plant community to the Alkali Sacaton/Saltcedar and/or Russian Olive Plant Community. • Frequent and Severe grazing plus encroachment will convert this plant community to a Dense Saltcedar and/or Russian Olive Stand/Annuals Plant Community. Invasion of saltcedar or Russian olive should be considered serious and should be controlled. • Frequent and severe grazing with no overflow and no fire will convert this plant community to the Dense Shrub/Bare Ground Plant Community. Prolonged drought will exacerbate this transition.
Figure 10. Plant community growth curve (percent production by month). WY0701, 10-14E upland sites.
Jan | Feb | Mar | Apr | May | Jun | Jul | Aug | Sep | Oct | Nov | Dec |
---|---|---|---|---|---|---|---|---|---|---|---|
J | F | M | A | M | J | J | A | S | O | N | D |
5 | 25 | 40 | 10 | 5 | 10 | 5 |
State 3
Mixed Shrub/ Short Grass Sod
Community 3.1
Mixed Shrub/ Short Grass Sod
This plant community is the result of frequent and severe grazing with periodic overflows and no fire or brush control. This plant community is dominated by a dense sod of inland saltgrass, blue grama and alkali bluegrass and includes a mosaic shrub overstory. Greasewood and rubber rabbitbrush are the dominant overstory shrubs in this plant community. Shrubs comprise less than 25% of the annual production and are kept in check by the herbaceous sod understory. When compared to the Historic Climax Plant Community, the tall and medium grasses are absent or greatly reduced. Short warm season grasses are dominant and weedy annuals are common. Shrubs will have increased as a percentage of the total production, but will not dominate as the sod prevents a homogeneous shrub cover. Noxious weeds such as Russian knapweed are present, if a seed source is available. Total production is less as the tall and mid grasses have been removed. The total annual production (air-dry weight) of this state is about 600 pounds per acre, but it can range from about 350 lbs./acre in unfavorable years to about 800 lbs./acre in above average years. The sod component of this plant community is extremely resistant to change and continued frequent and severe grazing or the removal of grazing does not seem to affect the plant composition or structure of the plant community. The biotic integrity of this state is minimally functional as plant diversity is moderate to poor especially among the herbaceous species. However, the vegetative structure may still be partially intact as the shrub component is still within a reasonable percentage of the total composition. This sod bound plant community is very resistant to water infiltration. While this sod protects the site itself, excessive runoff increases erosion on bare ground areas and worsens the channelization already present. Water flow patterns are obvious in the bare ground areas and shrubs and sod patches are pedestalled. Rill channels are noticeable in the interspaces and lateral gullies will increase. The watershed is not minimally functioning, as runoff is excessive and erosional processes are accelerated. Transitional pathways leading to other plant communities are as follows: • Grazing land mechanical treatment (chiseling and seeding, etc.) and brush management followed by prescribed grazing and if necessary seeding will return this plant community to near Historic Climax Plant Community. • Frequent and severe grazing with no overflow will convert this plant community to the Dense Shrub/Bare Ground Sod Plant Community. Prolonged drought will exacerbate this transition. • Frequent and Severe grazing plus encroachment will convert this plant community to a Dense Saltcedar and/or Russian Olive Stand/Annuals Plant Community. Invasion of saltcedar or Russian olive should be consider serious and should be controlled.
Figure 11. Plant community growth curve (percent production by month). WY0701, 10-14E upland sites.
Jan | Feb | Mar | Apr | May | Jun | Jul | Aug | Sep | Oct | Nov | Dec |
---|---|---|---|---|---|---|---|---|---|---|---|
J | F | M | A | M | J | J | A | S | O | N | D |
5 | 25 | 40 | 10 | 5 | 10 | 5 |
State 4
Dense Shrub/ Bare Ground
Community 4.1
Dense Shrub/ Bare Ground
This plant community evolved under frequent and severe grazing plus a decrease in the number of periodic overflow events and the absence of fire. Drought will exacerbate this transition. Greasewood and rubber rabbitbrush are the dominant species of this plant community. Tall and medium grasses have been eliminated. The interspaces between shrubs have expanded leaving the amount of bare ground more prevalent and more soil surface exposed to erosive elements. The annual grasses and forbs, such as cheatgrass, foxtail barley, kochia, halogeton, and Russian thistle, make up the dominant understory along with noxious weeds such as Russian knapweed. Total annual production is mostly from shrubs and these weedy annuals. When compared to the HCPC the total production has been reduced but the increase in shrubs offsets some of the loss in the herbaceous production. The total annual production (air-dry weight) of this state is about 400 pounds per acre, but it can range from about 300 lbs./acre in unfavorable years to about 600 lbs./acre in above average years. This plant community is resistant to change as the stand becomes more decadent. These areas may actually be more resistant to fire as less fine fuels are available and the bare ground between the shrubs is increased. Continued frequent and severe grazing or the removal of grazing does not seem to affect the plant composition or structure of the plant community. Annual grasses, weedy species and bare ground compromise the biotic integrity. Plant diversity is poor and the potential for native grasses to reproduce is absent. The shift in the vegetative structure and function is extreme and the biotic integrity is lost. Soil erosion is accelerated because of increased bare ground. Water flow patterns and pedestalling are obvious. Infiltration is reduced and runoff is increased. Rill channels may be noticeable in the interspaces and lateral gullies are numerous. Transitional pathways leading to other plant communities are as follows: • Brush management, followed by prescribed grazing and seeding if necessary, will return this plant community at or near the HCPC. If prescribed fire is used as a means to reduce or remove the shrubs, sufficient fine fuels will need to be present. This may require deferment from grazing prior to treatment. Since both greasewood and rubber rabbitbrush are difficult to remove or control, repeated treatments or a combination of treatments may be necessary. Post management is critical to ensure success. This can range from two or more years of rest to partial growing season deferment, depending on the condition of the understory at the time of treatment and the growing conditions following treatment. In the case of an intense wildfire that occurs when desirable plants are not completely dormant, the length of time required to reach the HCPC may be increased and seeding of natives is recommended.
Figure 12. Plant community growth curve (percent production by month). WY0701, 10-14E upland sites.
Jan | Feb | Mar | Apr | May | Jun | Jul | Aug | Sep | Oct | Nov | Dec |
---|---|---|---|---|---|---|---|---|---|---|---|
J | F | M | A | M | J | J | A | S | O | N | D |
5 | 25 | 40 | 10 | 5 | 10 | 5 |
State 5
Alkali Sacaton/Saltcedar and/ or Russian Olive
Community 5.1
Alkali Sacaton/Saltcedar and/ or Russian Olive
This plant community occurs where saltcedar and/or Russian olive encroaches into the site and becomes established. This occurs with or without grazing and is the result of conditions conducive to the colonization of these to plants. An increase in bare ground is likely to increase the potential for colonization. However, areas that have been deferred or removed from grazing and had a healthy stand of alkali sacaton can be infested. Saline tolerant perennial plants make up the dominant understory species in this plant community. The dominant grasses include alkali sacaton, inland saltgrass, rhizomatous wheatgrasses, and blue grama. Forbs commonly found in this plant community include wild onion, pursh seepweed, smooth woodyaster, and povertyweed. Saltcedar and/or Russian olive comprise the majority of the woody species and usually make up greater than 35% of the annual production. Invasion of saltcedar or Russian olive should be considered serious and should be controlled. When compared to the Historical Climax Plant Community, basin wildrye has decreased. Inland Saltgrass has increased and saltcedar and/or Russian olive have invaded. Total production has been reduced but is similar to the Inland Saltgrass/Rhizomatous Wheatgrasses/Greasewood Plant community. The total annual production (air-dry weight) of this state is about 600 pounds per acre, but it can range from about 400 lbs./acre in unfavorable years to about 900 lbs./acre in above average years. This plant community is mostly resistant to change, but species composition can be altered through long-term overgrazing and further encroachment of saltcedar and Russian olive. The herbaceous component is stable and plant vigor and replacement capabilities are sufficient. The biotic community is not intact due to the encroachment of these invasive species. Plant diversity is moderate. Soils are mostly stabilized. Only minimal occurrences of water flow patterns and litter movement is evident. Incidence of pedestalling is minimal. Soils are mostly stable and the surface shows minimum soil loss. The watershed may or may not be functional. Transitions or pathways leading to other plant communities are as follows: • Frequent and severe grazing plus Encroachment will convert the plant community to the Dense Saltcedar and/or Russian Olive Stand/Annuals Plant Community. • Grazing land mechanical treatment, brush management, and prescribed grazing may convert this plant community to the Historic Climax Plant Community, but recovery is mostly impractical as removal of salt cedar and/or Russian olive is expensive and total removal is typically not obtainable. Salt cedar and Russian olive will still probably persist as suppression and containment of this plant is optimal. Any methods of control should be followed by revegetation to reduce regeneration of this plant and other weedy species.
Figure 13. Plant community growth curve (percent production by month). WY0701, 10-14E upland sites.
Jan | Feb | Mar | Apr | May | Jun | Jul | Aug | Sep | Oct | Nov | Dec |
---|---|---|---|---|---|---|---|---|---|---|---|
J | F | M | A | M | J | J | A | S | O | N | D |
5 | 25 | 40 | 10 | 5 | 10 | 5 |
State 6
Dense Saltcedar and/ or Russian Olive Stand/ Annuals
Community 6.1
Dense Saltcedar and/ or Russian Olive Stand/ Annuals
This plant community evolved under frequent and severe grazing and encroachment of saltcedar and/or Russian olive. Saltcedar and/or Russian olive dominate this plant community. Most of the tall and medium grasses are eliminated and an understory of weedy herbaceous plants is prevalent. The interspaces between woody plants have expanded leaving the amount of bare ground more typical and more soil surface exposed to erosive elements or invaders. The weedy plants, such as kochia, halogeton, Russian knapweed, and Russian thistle, make up the dominant understory. Total annual production is mostly from shrubs and these weedy plants. Saltcedar and/or Russian olive make up greater than 35% of the total annual production. When compared with the HCPC, the annual production is less due to the removal of the perennial grass and amount of bare ground. The increase in woody species, however, compensates for some of this loss. The total annual production (air-dry weight) of this state is about 450 pounds per acre, but it can range from about 300 lbs./acre in unfavorable years to about 600 lbs./acre in above average years. This plant community is resistant to change as the stand becomes denser. These areas may actually be more resistant to fire as less fine fuels are available and the bare ground between the shrubs is increased. Continued frequent and severe grazing or the removal of grazing does not seem to affect the plant composition or structure of the plant community. Saltcedar, Russian olive, annual grasses, weedy species and bare ground compromise the biotic integrity. Plant diversity is poor and the potential for native grasses to reproduce is absent. The shift in the vegetative structure and function is extreme and the biotic integrity is lost. The soil of this state is not protected as erosion has accelerated because of increased bare ground. Water flow patterns and pedestalling are obvious. Infiltration is reduced and runoff is increased. Rill channels may be noticeable in the interspaces and gullies may be establishing where rills have concentrated. The watershed is not functional due to excessive runoff, erosion and bare ground. Transitional pathways leading to other plant communities are as follows: • Brush management and prescribed grazing will result in an Alkali Sacaton/Saltcedar and/or Russian Olive Plant Community. Controlling both Saltcedar and Russian olive is a priority if these species have invaded. Any methods of control should be followed by revegetation to reduce regeneration of these two species and other weedy plants. • Grazing land mechanical treatment, brush management, and prescribed grazing may convert this plant community to the Historic Climax Plant Community, but recovery is mostly impractical as removal of salt cedar and/or Russian olive is both expensive and total removal is typically not obtainable. Salt cedar and Russian olive will still probably persist as suppression and containment of this plant is optimal. Any methods of control should be followed by revegetation to reduce regeneration of this plant and other weedy species.
Figure 14. Plant community growth curve (percent production by month). WY0701, 10-14E upland sites.
Jan | Feb | Mar | Apr | May | Jun | Jul | Aug | Sep | Oct | Nov | Dec |
---|---|---|---|---|---|---|---|---|---|---|---|
J | F | M | A | M | J | J | A | S | O | N | D |
5 | 25 | 40 | 10 | 5 | 10 | 5 |
Additional community tables
Table 5. Community 1.1 plant community composition
Group | Common name | Symbol | Scientific name | Annual production (lb/acre) | Foliar cover (%) | |
---|---|---|---|---|---|---|
Grass/Grasslike
|
||||||
1 | 90–180 | |||||
saltgrass | DISP | Distichlis spicata | 90–180 | – | ||
2 | 90–180 | |||||
alkali sacaton | SPAI | Sporobolus airoides | 90–180 | – | ||
3 | 90–180 | |||||
basin wildrye | LECI4 | Leymus cinereus | 90–180 | – | ||
4 | 45–135 | |||||
western wheatgrass | PASM | Pascopyrum smithii | 45–135 | – | ||
5 | 0–90 | |||||
Grass, perennial | 2GP | Grass, perennial | 0–45 | – | ||
Indian ricegrass | ACHY | Achnatherum hymenoides | 0–45 | – | ||
blue grama | BOGR2 | Bouteloua gracilis | 0–45 | – | ||
Canada wildrye | ELCA4 | Elymus canadensis | 0–45 | – | ||
squirreltail | ELELE | Elymus elymoides ssp. elymoides | 0–45 | – | ||
Forb
|
||||||
6 | 0–90 | |||||
Forb, perennial | 2FP | Forb, perennial | 0–45 | – | ||
textile onion | ALTE | Allium textile | 0–45 | – | ||
povertyweed | IVAX | Iva axillaris | 0–45 | – | ||
spiny phlox | PHHO | Phlox hoodii | 0–45 | – | ||
Pursh seepweed | SUCA2 | Suaeda calceoliformis | 0–45 | – | ||
smooth woodyaster | XYGL | Xylorhiza glabriuscula | 0–45 | – | ||
Shrub/Vine
|
||||||
7 | 45–90 | |||||
greasewood | SAVE4 | Sarcobatus vermiculatus | 45–90 | – | ||
8 | 9–45 | |||||
Gardner's saltbush | ATGA | Atriplex gardneri | 9–45 | – | ||
9 | 9–45 | |||||
Shrub (>.5m) | 2SHRUB | Shrub (>.5m) | 0–45 | – | ||
basin big sagebrush | ARTRT | Artemisia tridentata ssp. tridentata | 0–45 | – | ||
yellow rabbitbrush | CHVI8 | Chrysothamnus viscidiflorus | 0–45 | – | ||
rubber rabbitbrush | ERNA10 | Ericameria nauseosa | 0–45 | – |
Interpretations
Animal community
Animal Community – Wildlife Interpretations
Historic Climax Plant Community: The predominance of grasses in this plant community favors grazers and mixed-feeders, such as bison, deer, and antelope. Suitable thermal and escape cover for wildlife is available as quantities of woody plants are adequate. This plant community may provide brood rearing/foraging areas for upland game birds including sage grouse, especially when found adjacent to sagebrush dominated states. Other birds that would frequent this plant community include western meadowlarks, horned larks, and golden eagles as well as upland game birds. Many grassland obligate small mammals would occur here.
Inland Saltgrass/Rhizomatous wheatgrasses/greasewood: This plant community exhibits a high level of plant species diversity due to the accumulation of salts in the soil. It provides both thermal and escape cover for deer and antelope. Upland game birds including the sage grouse find both cover and brood rearing/foraging benefits especially when found adjacent to sagebrush dominated states. Other birds that would frequent this plant community include western meadowlarks, horned larks, and golden eagles as well as upland game birds. Many grassland obligate small mammals would occur here.
Mixed Shrub/Short Grass Sod: These communities provide some foraging and cover for deer, antelope, and other large ungulates. This plant community, especially if proximal to other woody cover, may be used by sage grouse and other game birds for foraging and cover.
Dense Shrub/Bare Ground: This plant community can provide important winter foraging and cover for mule deer and antelope during that time. This community provides excellent escape and thermal cover for large ungulates, as well as nesting habitat for sage grouse and other upland game birds.
Alkali Sacaton/Saltcedar and/or Russian Olive: This plant community may be useful for the same large grazers that would use the Historic Climax Plant Community. However, the plant community is less productive, and thus, less apt to meet the seasonal needs of these animals. The shrub cover does provide good thermal and escape cover for both large animals and upland birds. Russian olive may provide a good source of food for some upland game birds and large animals. Many grassland obligate small mammals would occur here.
Dense Saltcedar and/or Russian Olive Stand/Annuals: This plant community can provide important winter cover for mule deer and antelope during that time and some foraging value if Russian olive trees are present. The plant community composition comprises little diversity, and thus, less apt to meet the seasonal needs of large grazers. The dense shrub cover does provide good thermal and escape cover for both large animals and upland birds. Russian olive may provide a good source of food for some upland game birds and large animals. Many grassland obligate small mammals would occur here.
Animal Community – Grazing Interpretations
The following table lists suggested stocking rates for cattle under continuous season-long grazing under normal growing conditions. These are conservative estimates that should be used only as guidelines in the initial stages of the conservation planning process. Often, the current plant composition does not entirely match any particular plant community (as described in this ecological site description). Because of this, a field visit is recommended, in all cases, to document plant composition and production. More precise carrying capacity estimates should eventually be calculated using this information along with animal preference data, particularly when grazers other than cattle are involved. Under more intensive grazing management, improved harvest efficiencies can result in an increased carrying capacity. If distribution problems occur, stocking rates must be reduced to maintain plant health and vigor.
Plant Community Production Carrying Capacity*
(lb./ac) (AUM/ac)
Historic Climax Plant Community 500-1200 .35
Inland Saltgrass/R. Wheatgrasses/Greasewood 450-1000 .30
Mixed Shrub/Short Grass Sod 350-800 .15
Dense Shrub/Bare Ground 300-600 .07
Alkali Sacaton/Saltcedar and/or Russian Olive 400-900 .25
Dense Saltcedar and/or Russian Olive Stand/Annuals 300-600 .07
* - Continuous, season-long grazing by cattle under average growing conditions.
Grazing by domestic livestock is one of the major income-producing industries in the area. Rangeland in this area may provide yearlong forage for cattle, sheep, or horses. During the dormant period, the forage for livestock use needs to be supplemented with protein because the quality does not meet minimum livestock requirements.
Hydrological functions
Water is the principal factor limiting forage production on this site. This site is dominated by soils in hydrologic group B and C, with localized areas in hydrologic group D. Infiltration ranges from moderate to rapid. Runoff potential for this site varies from moderate to high depending on soil hydrologic group and ground cover. In many cases, areas with greater than 75% ground cover have the greatest potential for high infiltration and lower runoff. An example of an exception would be where short-grasses form a strong sod and dominate the site. Areas where ground cover is less than 50% have the greatest potential to have reduced infiltration and higher runoff (refer to Part 630, NRCS National Engineering Handbook for detailed hydrology information).
Rills and gullies should not typically be present with the exception of relics, which should now be stabilized. Water flow patterns should be barely distinguishable if at all present. Pedestals are only slightly present in association with bunchgrasses. Litter typically falls in place, and signs of movement are not common. Chemical and physical crusts may be present. Cryptogamic crusts are present, but only cover 1-2% of the soil surface.
Recreational uses
This site provides hunting opportunities for upland game species. The wide varieties of plants which bloom from spring until fall have an esthetic value that appeals to visitors
Wood products
No appreciable wood products are present on the site.
Other products
none noted
Supporting information
Inventory data references
Information presented in the original site description was derived from NRCS inventory data. Field observations from range trained personnel were also used. Those involved in developing the original site include: Chris Krassin, Range Management Specialist, NRCS and Everet Bainter, Range Management Specialist. Other sources used as references include USDA NRCS Water and Climate Center, USDA NRCS National Range and Pasture Handbook, USDI and USDA Interpreting Indicators of Rangeland Health Version 3, and USDA NRCS Soil Surveys from various counties.
Information presented here has been derived from NRCS inventory data, Field observations from range trained personnel, and the existing range site descriptions. Those involved in developing the Loamy range site include: Chris Krassin, Range Management Specialist, NRCS and Everet Bainter, Range Management Specialist.
Those involved in the development of the new concept for Loamy and Loamy Calcareous Ecological site include: Ray Gullion, Area Range Management Specialist, NRCS; Jim Wolf, Resource Manager, USDI-BLM; Jack Mononi, Range Management Specialist, USDI-BLM; Daniel Wood, MLRA Soil Survey Leader, NRCS; Jane Karinen, Soil Data Quality Specialist, NRCS; and Marji Patz, Ecological Site Specialist, NRCS.
Inventory Data References:
Ocular field estimations observed by trained personnel were completed at each site. Then sites were selected where a 100 foot tape was stretched and the following sample procedures were completed by inventory staff. For full sampling protocol and guidelines with forms please refer to the Wyoming ESI Operating Procedures, compiled in 2012 for the Powell and Rock Springs Soil Survey Office, USDA-NRCS.
• Double Sampling Production Data (9.6 hoop used to estimate 10 points, clipped a minimum of 3 of these estimated points, with two 21 foot X 21 foot square extended shrub plots).
• Line Point Intercept (over story and understory captured with soil cover). Height of herbaceous and woody cover is collected every three feet along established transect.)
• Continuous Line Intercept (Woody Canopy Cover, with minimum gap of 0.2 of a foot for all woody species and succulents. Intercept height collected at each measurement.),
• Gap Intercept (Basal Gap measured with a minimum gap requirement of 0.7 foot.),
• Sample Point (10 – 1 meter square point photographs taken at set distances on transect. Red using the sample point computer program established by the High Plains Agricultural Research Center, WY).
• Soil Stability (Slake Test – surface and subsurface samples collected and processed according to the soil stability guidelines provided by the Jornada Research Center, NM.)
Other references
Baker, William L. 2006. Fire and Restoration of Sagebrush Ecosystems. Wildlife Society Bulletin 34(1): 177-185.
Bestelmeyer, B., and J. R. Brown. 2005. State-and-transition models 101: a fresh look at vegetation change. The Quivira Coalition Newsletter, Vol. 7, No. 3.
Bestelmeyer, B., J. R. Brown, K. M. Havstad, B. Alexander, G. Chavez, J. E. Herrick. 2003. Development and use of state and transition models for rangelands. Journal of Range Management 56(2):114-126.
Bestelmeyer, B., J. E. Herrick, J. R. Brown, D. A. Trujillo, and K. M. Havstad. 2004. Land management in the American Southwest: a state-and-transition approach to ecosystem complexity. Environmental Management 34(1):38-51.
Herrick, J. E., J. W. Van Zee, K. M. Havstad, L. M. Burkett, and W. G. Whitford. 2005. Monitoring manual for grassland, shrubland and savanna Ecosystems. Volume I Quick Start. USDA - ARS Jornada Experimental Range, Las Cruces, New Mexico.
Herrick, J. E., J. W. Van Zee, K. M. Havstad, L. M. Burkett, and W. G. Whitford. 2005. Monitoring manual for grassland, shrubland and savanna Ecosystems. Volume II: Design, supplementary methods and interpretation. USDA - ARS Jornada Experimental Range, Las Cruces, New Mexico.
NRCS. 2014. (electronic) National Water and Climate Center. Available online at http://www.wcc.nrcs.usda.gov/
NRCS. 2014. (electronic) Field Office Technical Guide. Available online at http://efotg.nrcs.usda.gov/efotg_locator.aspx?map=WY NRCS. 2009. Plant Guide: Cheatgrass. Prepared by Skinner et al., National Plant Data Center.
Pellant, M., P. Shaver, D. A. Pyke, and J. E. Herrick. 2005. Interpreting indicators of rangeland health. Version 4. Technical Reference 1734-6. USDI-BLM. Ricketts, M. J., R. S. Noggles, and B. Landgraf-Gibbons. 2004. Pryor Mountain Wild Horse Range Survey and Assessment. USDA-Natural Resources Conservation Service.
Schoeneberger, P. J., D. A. Wysocki, E. C. Benham, and Soil Survey Staff. 2012. Field book for describing and sampling soils, Version 3.0. Natural Resources Conservation Service, National Soil Survey Center, Lincoln, NE. (http://soils.usda.gov/technical/fieldbook/)
Stringham, T. K. and W. C. Krueger. 2001. States, transitions, and thresholds: Further refinement for rangeland applications. Agricultural Experiment Station, Oregon State University. Special Report 1024.
Stringham, T. K., W. C. Kreuger, and P. L Shaver. 2003. State and transition modeling: an ecological process approach. Journal of Range Management 56(2):106-113.
United States Department of Agriculture. Soil Survey Division Staff. 1993. Soil Survey Manual, United States Department of Agriculture Handbook No. 18, Chapter 3: Examination and Description of Soils. Pg.192-196.
USDA, NRCS. 1997. National Range and Pasture Handbook. (http://www.glti.nrcs.usda.gov/technical/publications/nrph.html)
Trlica, M. J. 1999. Grass growth and response to grazing. Colorado State University. Cooperative Extension. Range. Natural Resource Series. No. 6.108.
U.S. Department of Agriculture, Natural Resources Conservation Service (USDA/NRCS). 2007. The PLANTS Database (http://plants.usda.gov). National Plant Data Center, Baton Rouge, LA 70874-4490 USA.
U.S. Department of Agriculture, Natural Resources Conservation Service (USDA/NRCS), Soil Survey Staff. 2010. Keys to Soil Taxonomy, Eleventh Edition, 2010.
USDA/NRCS Soil survey manuals for appropriate counties within MLRA 32X.
Western Regional Climate Center. (2014) (electronic) Station Metadata. Available online at: http://www.wrcc.dri.edu/summary/climsmwy.html.
Approval
Scott Woodall, 10/04/2019
Rangeland health reference sheet
Interpreting Indicators of Rangeland Health is a qualitative assessment protocol used to determine ecosystem condition based on benchmark characteristics described in the Reference Sheet. A suite of 17 (or more) indicators are typically considered in an assessment. The ecological site(s) representative of an assessment location must be known prior to applying the protocol and must be verified based on soils and climate. Current plant community cannot be used to identify the ecological site.
Author(s)/participant(s) | Ray Gullion, E. Bainter |
---|---|
Contact for lead author | ray.gullion@wy.usda.gov or 307-347-2456 |
Date | 05/01/2008 |
Approved by | E. Bainter |
Approval date | |
Composition (Indicators 10 and 12) based on | Annual Production |
Indicators
-
Number and extent of rills:
Rare to nonexistent. Where present, short and widely spaced. -
Presence of water flow patterns:
Barely observable. -
Number and height of erosional pedestals or terracettes:
Slight pedestalling evident. -
Bare ground from Ecological Site Description or other studies (rock, litter, lichen, moss, plant canopy are not bare ground):
Bare ground can range from 20-40%. -
Number of gullies and erosion associated with gullies:
Active gullies typically present associated with ephemeral drainages associated with this site. -
Extent of wind scoured, blowouts and/or depositional areas:
Minimal to nonexistent. -
Amount of litter movement (describe size and distance expected to travel):
Herbaceous litter expected to move only in small amounts. -
Soil surface (top few mm) resistance to erosion (stability values are averages - most sites will show a range of values):
Soil Stability Index ratings range from 2 (interspaces) to 5 (under plant canopy), but average values should be 3.5 or greater. -
Soil surface structure and SOM content (include type of structure and A-horizon color and thickness):
Soil data is limited for this site. Described A-horizons vary from 1 to 4 inches (3-10 cm). Organic matter is typically 1 to 2%. -
Effect of community phase composition (relative proportion of different functional groups) and spatial distribution on infiltration and runoff:
Plant community consists of 45-75% grasses, 10% forbs, and 15-45% shrubs. Evenly distributed plant canopy (40-80%) and litter, and slow to moderate infiltration rates result in slight to moderate runoff. Basal cover is typically less than 5% for this site and does very little to effect runoff on this site. -
Presence and thickness of compaction layer (usually none; describe soil profile features which may be mistaken for compaction on this site):
No compaction layer exists, but some soil crusting in dry conditions is typical. -
Functional/Structural Groups (list in order of descending dominance by above-ground annual-production or live foliar cover using symbols: >>, >, = to indicate much greater than, greater than, and equal to):
Dominant:
tall, cool season bunchgrassesSub-dominant:
perennial shrubs cool season rhizomatous grassesOther:
mid & short-size, cool season bunchgrasses = perennial forbsAdditional:
-
Amount of plant mortality and decadence (include which functional groups are expected to show mortality or decadence):
Minimal decadence, typically associated with shrub component. -
Average percent litter cover (%) and depth ( in):
Litter ranges from 10-25% of total canopy measurement with total litter (including beneath the plant canopy) from 25-50% expected. Herbaceous litter depth typically ranges from 3-10mm. Woody litter can be up to a couple inches (4-6 cm). -
Expected annual annual-production (this is TOTAL above-ground annual-production, not just forage annual-production):
English: 500-1200 lb/ac (850 lb/ac average); Metric: 560 -1344 kg/ha (952 kg/ha average). -
Potential invasive (including noxious) species (native and non-native). List species which BOTH characterize degraded states and have the potential to become a dominant or co-dominant species on the ecological site if their future establishment and growth is not actively controlled by management interventions. Species that become dominant for only one to several years (e.g., short-term response to drought or wildfire) are not invasive plants. Note that unlike other indicators, we are describing what is NOT expected in the reference state for the ecological site:
Bare ground greater than 50% is the most common indicator of a threshold being crossed. Greasewood and inland saltgrass are common increasers. Perennial pepperweed, annual mustards, halogeton, kochia, and Russian thistle are common invasive species in disturbed sites. -
Perennial plant reproductive capability:
All species are capable of reproducing, except in drought years.
Print Options
Sections
Font
Other
The Ecosystem Dynamics Interpretive Tool is an information system framework developed by the USDA-ARS Jornada Experimental Range, USDA Natural Resources Conservation Service, and New Mexico State University.
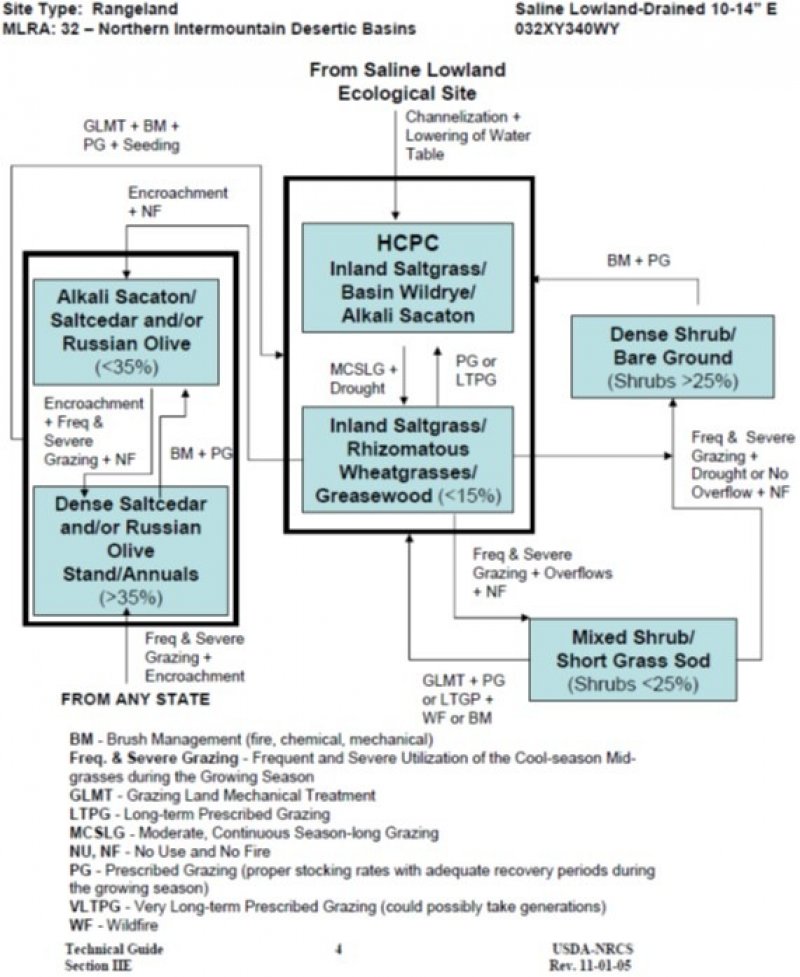
Click on box and path labels to scroll to the respective text.