
Natural Resources
Conservation Service
Ecological site R051XY314CO
Alkali Overflow
Last updated: 12/12/2024
Accessed: 02/09/2026
General information
Provisional. A provisional ecological site description has undergone quality control and quality assurance review. It contains a working state and transition model and enough information to identify the ecological site.
MLRA notes
Major Land Resource Area (MLRA): 051X–High Intermountain Valleys
This MLRA encompasses the San Luis Valley in south central Colorado and the Taos Plateau and Taos alluvial fans of north central New Mexico. As part of the northern portion of the Rio Grande Rift, the MLRA consists of large, alluvium filled basins washed down from adjacent mountain ranges. The Rio Grande River flows through this MLRA, continuing its long function of carrying mountain sediment down to the basin. Cenozoic volcanism is an extensive characteristic of the MLRA where large basalt flows with volcanic hills and domes are abundant .Ancient Lake Alamosa is a large feature within the MLRA.
Classification relationships
NRCS:
Major Land Resource Area 51, High Intermountain Valleys (United States Department of Agriculture, Natural Resources Conservation Service, 2006).
USFS:
331J – Northern Rio Grande Basin M331Ic > 331Ja - San Luis Valley, 331Jb - San Luis Hills and 331C - Mogotes
EPA:
22 - Arizona/New Mexico Plateau > 22a - San Luis Shrublands and Hills ; 22b -San Luis Alluvial Flats and Wetlands ; 22c - Salt Flats; 22e - Sand Dunes and Sand Sheets and 22f -Taos Plateau (Griffith, 2006).
USGS:
Southern Rocky Mountain Province
Ecological site concept
A large portion of the San Luis Valley, north of Alamosa is a closed basin. Drainages flowing into this closed basin include: irrigation diversions from the Rio Grande River; Carnero, La Garita, and Saguache Creeks from the west; San Luis Creek from the north; and North Crestone and Sand creeks from the east.The low area or "sump" area extends from San Luis Lake to the Blanca wetlands. As water flows into the closed basin it spreads out across the valley floor where it evaporates or infiltrates, recharging the underground aquifer.
This site exists in the lowest reaches of this closed basin. It is mostly correlated to playas, playettes, and ephemeral streams and rivers which flow into the closed basin. Water regularly floods these sites and then evaporative discharge leads to accumulated salts at the surface. Plants are adapted to these high saline-alkali conditions and must endure prolonged periods of both flooding and drought.
Associated sites
| R051XY312CO |
Sand Hummocks The sand hummocks site is the most commonly associated site. It essentially occupies the playa dune component where salts and sand accumulate on the leeward side of the playa. The alkali overflow occupies the playa floor, playa slope, and playa annulus. |
|---|---|
| R051XY263CO |
Salt Flats The salt flats site occupies an upland position out of the alkali overflow system. It does not receive regular flooding. It has a mix of shrubs and grass. |
| R051XY264CO |
Chico Land Chico land is upland out of the alkali overflow system. The soils are higher in alkalinity and salts than the salt flats site. |
Similar sites
| R051XY263CO |
Salt Flats The salt flats site occupies an upland position out of the alkali overflow system. It does not receive regular flooding. It has a mix of shrubs and grass. |
|---|
Table 1. Dominant plant species
| Tree |
Not specified |
|---|---|
| Shrub |
Not specified |
| Herbaceous |
(1) Distichlis spicata |
Physiographic features
This site occupies the lowest parts of the closed basin floor and is flat. It exists on the lower reaches of poorly defined drainage courses with no outlets and around the edges of shallow, land-locked lakebeds, Common landforms it is found on are: playa rims, playa lakes, relict lakebeds and depressions on alluvial valley floors. The playa dunes component is correlated to the sand hummocks ecological site.
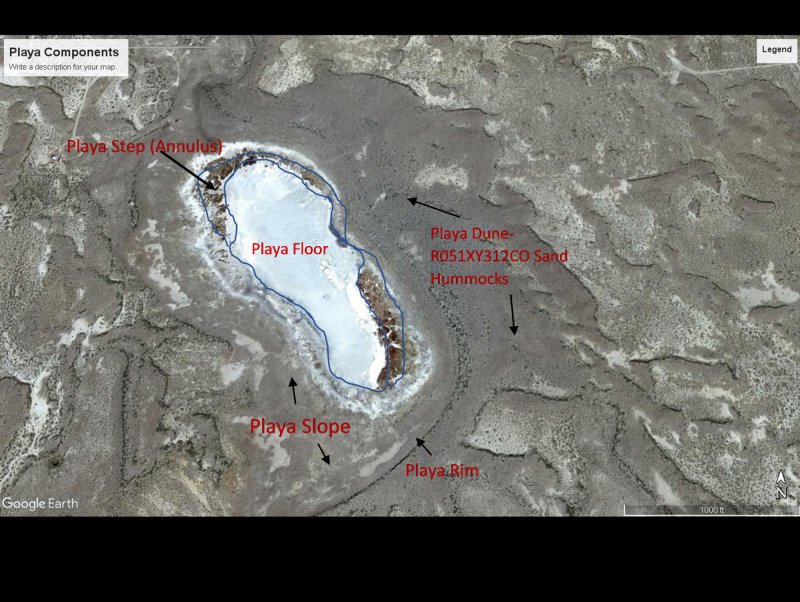
Figure 1. The playa components of the alkali overflow site.
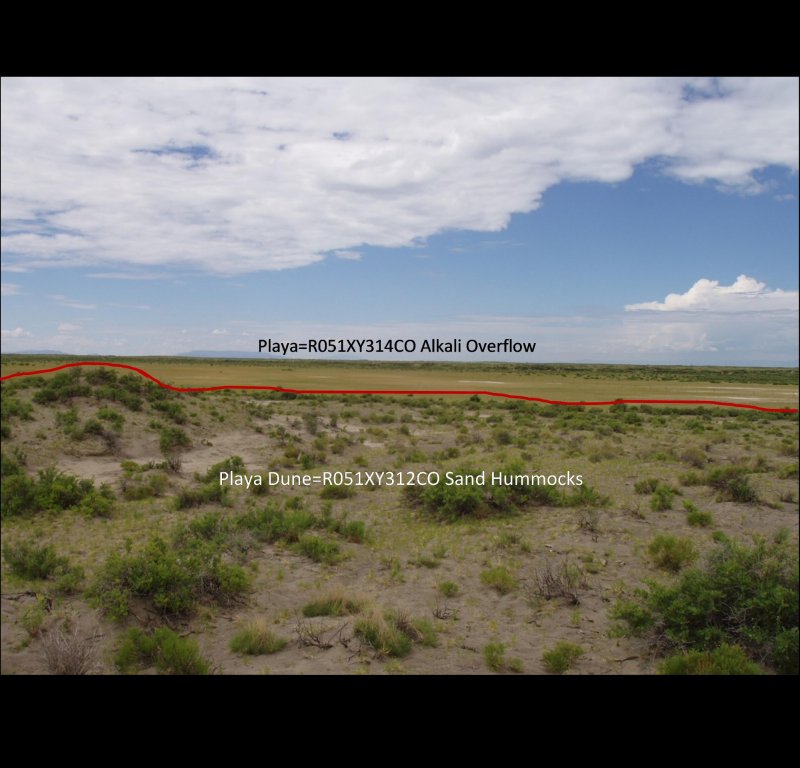
Figure 2. Sand Hummocks site in the foreground, Alkali Overflow site in the background
Table 2. Representative physiographic features
| Landforms |
(1)
Valley floor
(2) Lakebed (relict) (3) Playa lake (4) Playa rim |
|---|---|
| Runoff class | Low to medium |
| Flooding duration | Brief (2 to 7 days) |
| Flooding frequency | None to frequent |
| Ponding duration | Long (7 to 30 days) |
| Ponding frequency | None to frequent |
| Elevation | 7,500 – 8,000 ft |
| Slope | 2% |
| Water table depth | 36 in |
| Aspect | Aspect is not a significant factor |
Climatic features
The climate that typifies the High Intermountain Valley, ranges from arid to semi-arid, and is characterized by cold winters, moderate summers, and much sunshine. Average annual precipitation ranges from 6 to 10 inches along the valley floor and throughout most of the resource area. Upper elevations and southern reaches range from 11 to 13 inches. Precipitation extremes vary from 3 to 20 inches per year depending on location. The San Juan mountain range to the west and the Sangre de Cristo Mountains to the east intercept much of the precipitation causing a two-way rain shadow effect. Approximately 60 to 65 percent of the annual precipitation falls between May 1 and October 1, mostly from short duration high intensity thundershowers in July and August. Snowfall averages 34 inches annually; snow cover is light or patchy throughout much of the winter. Wind speeds average 7 miles per hour annually. High wind velocities are common in the spring.
Cold air from the encompassing mountain ranges drain into the valley and settle. This phenomena results in long cold winters and moderate summer temperatures. July is the hottest month and January is the coldest. Summer temperatures range from highs in the upper 70’s and low 80’s and occasionally reach to the mid 90o F. Summer nights are cool, with lows averaging in the mid 40’s. Temperatures of -20oF to -40oF can be expected each year and are common during some winters. Higher elevations can receive a dusting of snow as early as September 1. There is a 50% probability that the first frost in the fall will occur near September 16, and the last frost in the spring on about June 9. The average length of the growing season is 119 days and varies from 94 to 143 days. Summer humidity is low. Evaporation rates average lower than those of dry regions because of the cool climate.
Most major plant species initiate growth between mid May and late July, but growth may extend into September. Some cool season plants begin growth earlier and complete growth by mid June.
Table 3. Representative climatic features
| Frost-free period (characteristic range) | 70-83 days |
|---|---|
| Freeze-free period (characteristic range) | 95-107 days |
| Precipitation total (characteristic range) | 6-10 in |
| Frost-free period (actual range) | 69-83 days |
| Freeze-free period (actual range) | 94-108 days |
| Precipitation total (actual range) | 6-10 in |
| Frost-free period (average) | 77 days |
| Freeze-free period (average) | 101 days |
| Precipitation total (average) | 8 in |
Figure 3. Monthly precipitation range
Figure 4. Monthly minimum temperature range
Figure 5. Monthly maximum temperature range
Figure 6. Monthly average minimum and maximum temperature
Figure 7. Annual precipitation pattern
Figure 8. Annual average temperature pattern
Climate stations used
-
(1) BLANCA 4 NW [USC00050776], Blanca, CO
-
(2) ALAMOSA SAN LUIS AP [USW00023061], Alamosa, CO
-
(3) MANASSA [USC00055322], La Jara, CO
-
(4) MONTE VISTA 2W [USC00055706], Monte Vista, CO
-
(5) CENTER 4 SSW [USC00051458], Center, CO
Influencing water features
A playa is an internally drained area that receives additional moisture from surrounding uplands by means of overland flow and throughflow. In the spring, due to snowmelt the playa system will experience ponding of surface water or at least a saturated soil profile to near the surface. On drier years, there may be no water table present within the profile. In a saline playa, the period transitioning from wet to dry status induces capillary water movement, facilitated by high clay content, from deep in the profile to the soil surface, where the moisture is transpired by plants or evaporated from bare soil. In either case, salts from within the profile are transported to the surface and accumulated through evapotranspiration.
The alkali overflow ecological site is associated with wetlands systems --hydric soils are common and wetland species, though intermittent with alternating wet and dry years, inhabit these sites—in that water tables are near the surface for some duration during the growing season. During wetter periods, the water table can be very near the surface, and water can even be ponded for long periods of time. As these playas dry out, they tend to form some type of salt crust, ranging from thin (1 mm or thinner) and discontinuous to thick (2 mm or thicker) and continuous for several square meters.
Soil features
The soils range from generally have clay loam surface texture with a subsurface (20 inches) of 30 to 40% clay., are derived from alluvium, are deep to very deep, and are underlain with sand or gravel. They are typically wet and are highly alkaline and saline. Water intake rates and subsoil permeability may be extremely slow, causing water to pond for significant periods following infrequent overflow periods. During dry periods, capillary action causes rapid loss of moisture from the surface and the formation of impermeable salt crusts.
Typical soil of this site is Biedell.
Table 4. Representative soil features
| Parent material |
(1)
Alluvium
–
basalt
(2) Alluvium – igneous and metamorphic rock |
|---|---|
| Surface texture |
(1) Clay loam |
| Family particle size |
(1) Clayey-skeletal over sandy or sandy-skeletal |
| Drainage class | Poorly drained |
| Permeability class | Very slow to slow |
| Soil depth | 60 – 120 in |
| Surface fragment cover <=3" | Not specified |
| Surface fragment cover >3" | Not specified |
| Available water capacity (Depth not specified) |
3.7 – 5 in |
| Calcium carbonate equivalent (Depth not specified) |
5% |
| Electrical conductivity (Depth not specified) |
8 – 16 mmhos/cm |
| Sodium adsorption ratio (Depth not specified) |
1 – 10 |
| Soil reaction (1:1 water) (Depth not specified) |
7.9 – 9 |
| Subsurface fragment volume <=3" (Depth not specified) |
254% |
| Subsurface fragment volume >3" (Depth not specified) |
2% |
Ecological dynamics
The site is subject to overflow but will go long periods without the benefit of any runoff or precipitation. Plants adapted to severe saline-alkali conditions and prolonged periods of either drought or flooding occupy the site. Very little vegetation is found on the playa floor. Inland saltgrass is the most dominant species on the playa step and playa slope. Other species such as Baltic rush, spikerush, and creeping wildrye, will occur. Minor amounts of alkali sacaton, alkali cordgrass, alkali bluegrass, and alkali grass may be present along the playa rim. Greasewood and fourwing saltbush are minor species on the site and may be subject to loss during periods of prolonged flooding. Low areas more subject to flooding will have very little vegetation.
State and transition model
More interactive model formats are also available.
View Interactive Models
Click on state and transition labels to scroll to the respective text
Ecosystem states
State 1 submodel, plant communities
State 2 submodel, plant communities
State 1
Reference
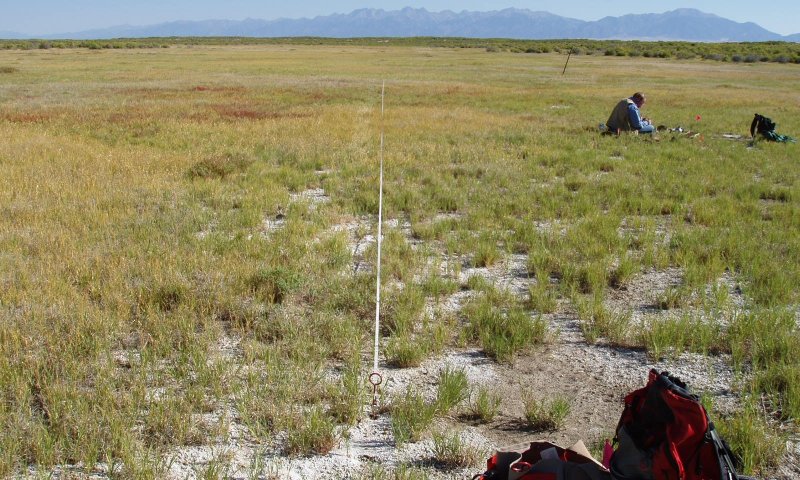
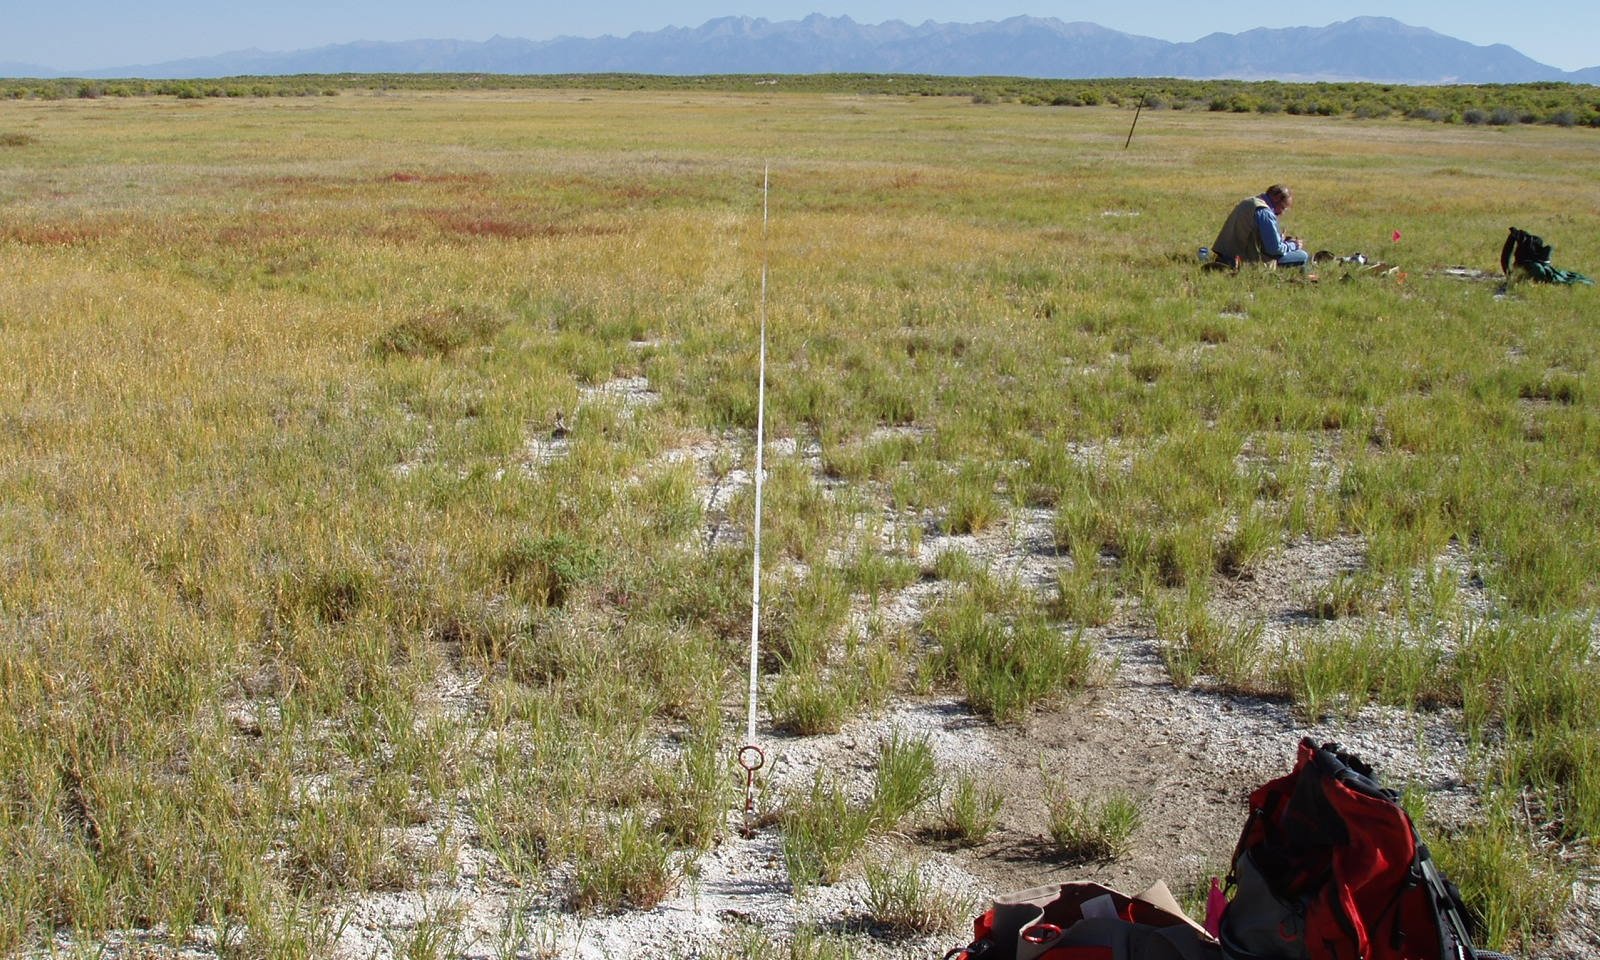
Figure 9. Grass and grasslike dominant on the playa slope
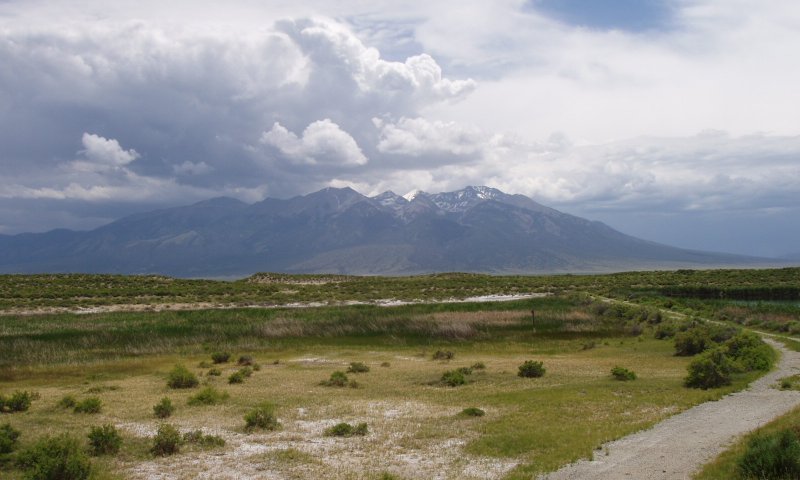
Figure 10. A playette, a small inclusion of the alkali overflow site
The playa floor has very little vegetation, the playa slope, in reference condition will be dominant in grass and grass-like plants. Inland saltgrass is the dominant plant.
Community 1.1
Inland Saltgrass Dominant

Figure 11. Inland Saltgrass dominant on the playa slope.
This community phase is characterized by a mix of cool and warm season grasses with inland saltgrass being the dominant species.
Dominant plant species
-
saltgrass (Distichlis spicata), grass
Figure 12. Annual production by plant type (representative values) or group (midpoint values)
Table 5. Annual production by plant type
| Plant type | Low (lb/acre) |
Representative value (lb/acre) |
High (lb/acre) |
|---|---|---|---|
| Grass/Grasslike | 765 | 1020 | 1275 |
| Shrub/Vine | 90 | 120 | 150 |
| Forb | 45 | 60 | 75 |
| Total | 900 | 1200 | 1500 |
Figure 13. Plant community growth curve (percent production by month). CO5104, Warm season dominant, cool season sub-dominant MLRA-51; valley floor- fine textured soils.
| Jan | Feb | Mar | Apr | May | Jun | Jul | Aug | Sep | Oct | Nov | Dec |
|---|---|---|---|---|---|---|---|---|---|---|---|
| J | F | M | A | M | J | J | A | S | O | N | D |
| 0 | 0 | 0 | 3 | 30 | 35 | 15 | 10 | 5 | 2 | 0 | 0 |
Community 1.2
Flooded
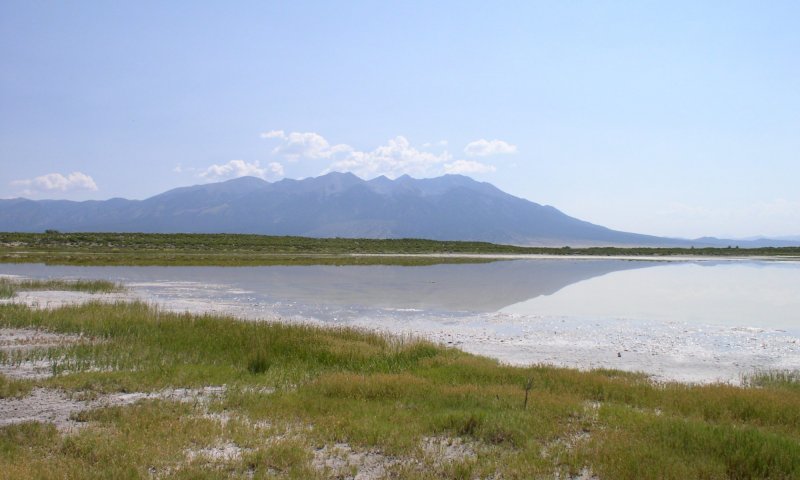
Figure 14. A flooded alkali overflow site
This playa site gets flooded on a regular basis, especially during the spring.
Pathway 1.1A
Community 1.1 to 1.2


Flooding from upland positions saturate the playa. First the playa floor gets saturated, then the playa slope becomes flooded.
Pathway 1.2A
Community 1.2 to 1.1


The water evaporates and plants recover to send out shoots and roots.
State 2
Expanded Playa Floor
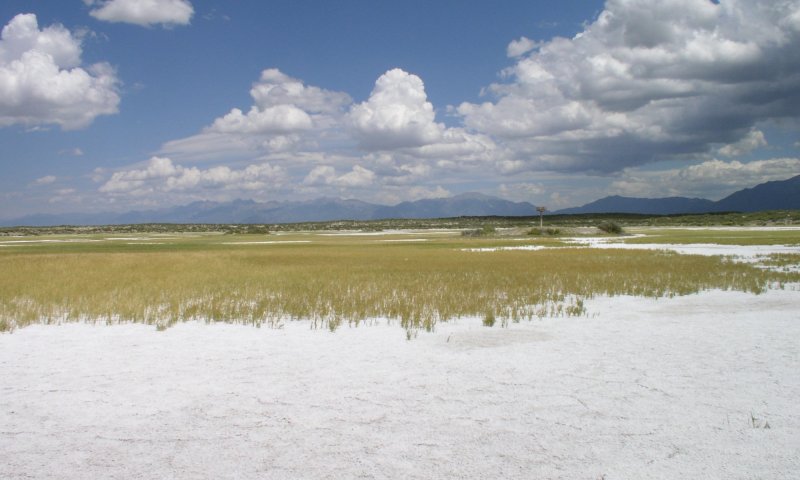
Figure 15. Expanded Playa Floor
The playa floor has sparse vegetation and may expand if run-on from other areas increases and management causes a decrease in stabilizing hydrophytic plants. It is possible for noxious weeds such as halogeton to expand on this site.
Community 2.1
Expanded Playa Floor
The playa floor has sparse vegetation and may expand if run-on from other areas increases and management causes a decrease in stabilizing hydrophytic plants. It is possible for noxious weeds such as halogeton to expand on this site.
Transition T1A
State 1 to 2


Over time the playa floor may increase in size due to increased runoff from higher areas in the watershed causing lengthened ponding.
Restoration pathway R2A
State 2 to 1


The increase of vegetation due to management coupled with a decrease in the length of ponding may cause a decrease in salt encrusted-barren playa floor.
Additional community tables
Table 6. Community 1.1 plant community composition
| Group | Common name | Symbol | Scientific name | Annual production (lb/acre) | Foliar cover (%) | |
|---|---|---|---|---|---|---|
|
Grass/Grasslike
|
||||||
| 1 | Grasses | 800–1200 | ||||
| saltgrass | DISP | Distichlis spicata | 450–750 | – | ||
| spikerush | ELEOC | Eleocharis | 90–150 | – | ||
| beardless wildrye | LETR5 | Leymus triticoides | 90–150 | – | ||
| western wheatgrass | PASM | Pascopyrum smithii | 45–75 | – | ||
| Sandberg bluegrass | POSE | Poa secunda | 45–75 | – | ||
| Nevada bulrush | SCNE | Scirpus nevadensis | 45–75 | – | ||
| alkali cordgrass | SPGR | Spartina gracilis | 0–15 | – | ||
| alkali sacaton | SPAI | Sporobolus airoides | 0–15 | – | ||
| slender wheatgrass | ELTR7 | Elymus trachycaulus | 0–15 | – | ||
| alkali wildrye | LESI5 | Leymus simplex | 0–15 | – | ||
| sandhill muhly | MUPU2 | Muhlenbergia pungens | 0–15 | – | ||
| blue grama | BOGR2 | Bouteloua gracilis | 0–15 | – | ||
| thickspike wheatgrass | ELLAL | Elymus lanceolatus ssp. lanceolatus | 0–15 | – | ||
| seaside arrowgrass | TRMA20 | Triglochin maritima | 0–1 | – | ||
|
Forb
|
||||||
| 2 | Forbs | 20–50 | ||||
| painted milkvetch | ASCE | Astragalus ceramicus | 0–5 | – | ||
| flaxflowered ipomopsis | IPLO2 | Ipomopsis longiflora | 0–5 | – | ||
| povertyweed | IVAX | Iva axillaris | 0–5 | – | ||
| tanseyleaf tansyaster | MATA2 | Machaeranthera tanacetifolia | 0–5 | – | ||
| bractless blazingstar | MENU | Mentzelia nuda | 0–5 | – | ||
| crownleaf evening primrose | OECO2 | Oenothera coronopifolia | 0–5 | – | ||
| lemon scurfpea | PSLA3 | Psoralidium lanceolatum | 0–5 | – | ||
| lanceleaf goldenweed | PYLA | Pyrrocoma lanceolata | 0–5 | – | ||
| scarlet globemallow | SPCO | Sphaeralcea coccinea | 0–5 | – | ||
|
Shrub/Vine
|
||||||
| 3 | Shrubs | 90–150 | ||||
| fourwing saltbush | ATCA2 | Atriplex canescens | 45–75 | – | ||
| greasewood | SAVE4 | Sarcobatus vermiculatus | 45–75 | – | ||
| Pursh seepweed | SUCA2 | Suaeda calceoliformis | 0–25 | – | ||
| red swampfire | SARU | Salicornia rubra | 0–25 | – | ||
| Greene's rabbitbrush | CHGR6 | Chrysothamnus greenei | 5–15 | – | ||
| rubber rabbitbrush | ERNAC2 | Ericameria nauseosa ssp. consimilis | 5–15 | – | ||
Interpretations
Animal community
Grazing:
This site has a medium value rating for cattle and sheep and a low value rating for horses.
Wildlife:
This site has a high value rating for cottontail and jackrabbit, a medium value rating for waterfowl, and a low value rating for antelope, bison, deer, elk, and upland game birds. Alkali overflow sites in the Blanca Wetlands area are of the few remaining breeding and nesting areas for Snowy Plovers in Colorado.
Hydrological functions
NA
Recreational uses
This site has a low value rating for recreation and natural beauty.
Wood products
NA
Other information
Rare, Threatened or Endangered Plants and Animals:
(To be added when known)
Supporting information
Inventory data references
Location of Typical Example of the Site:
Along lower drainage of San Luis Creek, 4 1/2 miles east and one mile south of Hooper on road to Medano Ranch.
Field Offices in Colorado Where the Site Occurs:
Alamosa, Center, and San Luis
References
-
. 2021 (Date accessed). USDA PLANTS Database. http://plants.usda.gov.
Other references
Chapman, S.S., G.E. Griffith, J.M. Omernik, A.B. Price, J. Freeouf, and D.L. Schrupp. 2006. Ecoregions of Colorado. (2-sided color posterwith map, descriptive text, summary tables, and photographs). U.S. Geological Survey, Reston, VA. Scale 1:1,200,000.
Cleland, D.T.; Freeouf, J.A.; Keys, J.E.; Nowacki, G.J.; Carpenter, C.A.; and McNab, W.H. 2007. Ecological Subregions: Sections and Subsections for the conterminous United States. Gen. Tech. Report WO-76D [Map on CD-ROM] (A.M. Sloan, cartographer). Washington DC: U.S. Department of Agriculture, Forest Service, presentation scale 1:3,500,000; colored.
Soil Conservation Service (SCS). February 1977. Range Site Description for Alkali Overflow #314. : USDA, Denver Colorado.
United States Department of Agriculture, Natural Resources Conservation Service. 2006. Land Resource Regions and Major Land Resource Areas of the United States, the Caribbean, and the Pacific Basin. U.S. Department of Agriculture Handbook 296.
Contributors
C. Villa, H. Garcia, Scott Woodall
Suzanne Mayne-Kinney
Approval
Kirt Walstad, 12/12/2024
Acknowledgments
Project Staff:
Suzanne Mayne-Kinney, Ecological Site Specialist, NRCS MLRA, Grand Junction SSO
Alan Stuebe, MLRA Soil Survey Leader, NRCS MLRA Alamosa SSO
Program Support:
Rachel Murph, NRCS CO State Rangeland Management Specialist, Denver
Eva Muller, Regional Director, Rocky Mountain Regional Soil Survey Office, Bozeman, MT
B.J. Shoup, CO State Soil Scientist, Denver
Eugene Backhaus, CO State Resource Conservationist, Denver
--Site Development and Testing Plan--:
Future work to validate and further refine the information in this Provisional Ecological Site Description is necessary. This will include field activities to collect low-, medium-, and high-intensity sampling, soil correlations, and analysis of that data.
Additional information and data are required to refine the Plant Production and Annual Production tables for this ecological site. The extent of MLRA 51 must be further investigated.
Field testing of the information contained in this Provisional ESD is required. As this ESD is moved to the Approved ESD level, reviews from the technical team, quality control, quality assurance, and peers will be conducted.
Rangeland health reference sheet
Interpreting Indicators of Rangeland Health is a qualitative assessment protocol used to determine ecosystem condition based on benchmark characteristics described in the Reference Sheet. A suite of 17 (or more) indicators are typically considered in an assessment. The ecological site(s) representative of an assessment location must be known prior to applying the protocol and must be verified based on soils and climate. Current plant community cannot be used to identify the ecological site.
| Author(s)/participant(s) | |
|---|---|
| Contact for lead author | |
| Date | 12/10/2024 |
| Approved by | Kirt Walstad |
| Approval date | |
| Composition (Indicators 10 and 12) based on | Annual Production |
Indicators
-
Number and extent of rills:
-
Presence of water flow patterns:
-
Number and height of erosional pedestals or terracettes:
-
Bare ground from Ecological Site Description or other studies (rock, litter, lichen, moss, plant canopy are not bare ground):
-
Number of gullies and erosion associated with gullies:
-
Extent of wind scoured, blowouts and/or depositional areas:
-
Amount of litter movement (describe size and distance expected to travel):
-
Soil surface (top few mm) resistance to erosion (stability values are averages - most sites will show a range of values):
-
Soil surface structure and SOM content (include type of structure and A-horizon color and thickness):
-
Effect of community phase composition (relative proportion of different functional groups) and spatial distribution on infiltration and runoff:
-
Presence and thickness of compaction layer (usually none; describe soil profile features which may be mistaken for compaction on this site):
-
Functional/Structural Groups (list in order of descending dominance by above-ground annual-production or live foliar cover using symbols: >>, >, = to indicate much greater than, greater than, and equal to):
Dominant:
Sub-dominant:
Other:
Additional:
-
Amount of plant mortality and decadence (include which functional groups are expected to show mortality or decadence):
-
Average percent litter cover (%) and depth ( in):
-
Expected annual annual-production (this is TOTAL above-ground annual-production, not just forage annual-production):
-
Potential invasive (including noxious) species (native and non-native). List species which BOTH characterize degraded states and have the potential to become a dominant or co-dominant species on the ecological site if their future establishment and growth is not actively controlled by management interventions. Species that become dominant for only one to several years (e.g., short-term response to drought or wildfire) are not invasive plants. Note that unlike other indicators, we are describing what is NOT expected in the reference state for the ecological site:
-
Perennial plant reproductive capability:
Print Options
Sections
Font
Other
The Ecosystem Dynamics Interpretive Tool is an information system framework developed by the USDA-ARS Jornada Experimental Range, USDA Natural Resources Conservation Service, and New Mexico State University.
Click on box and path labels to scroll to the respective text.