
Natural Resources
Conservation Service
Ecological site R151XY008LA
Fresh Fluid Marsh 60-64 PZ
Last updated: 3/24/2025
Accessed: 04/25/2025
General information
Approved. An approved ecological site description has undergone quality control and quality assurance review. It contains a working state and transition model, enough information to identify the ecological site, and full documentation for all ecosystem states contained in the state and transition model.
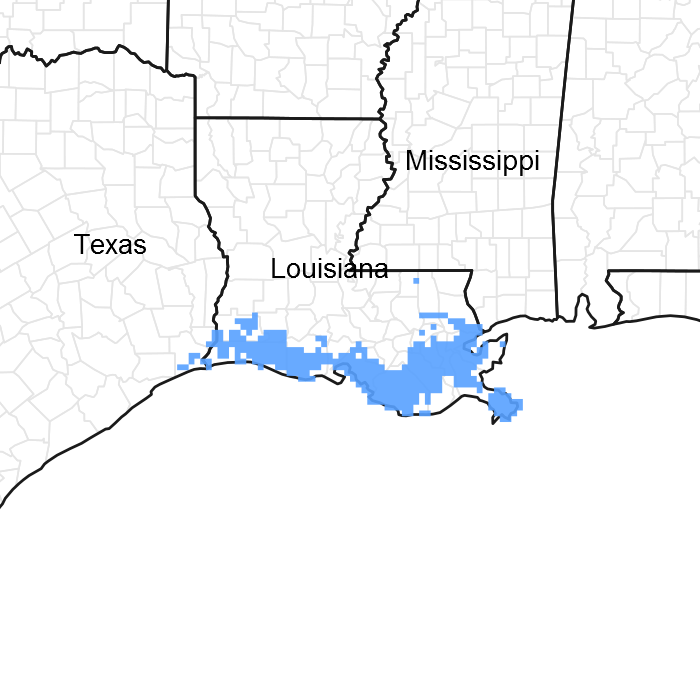
Figure 1. Mapped extent
Areas shown in blue indicate the maximum mapped extent of this ecological site. Other ecological sites likely occur within the highlighted areas. It is also possible for this ecological site to occur outside of highlighted areas if detailed soil survey has not been completed or recently updated.
MLRA notes
Major Land Resource Area (MLRA): 151X–Gulf Coast Marsh
Major land resource area (MLRA)151, Gulf Coast Marsh, is in Louisiana (95 percent), Texas (4 percent), and Mississippi (1 percent). It makes up about 8,495 square miles (22,015 square kilometers). The towns of Gretna, Chalmette, and Marrero, Louisiana, and the city of New Orleans, Louisiana, are in the eastern part of this MLRA. The town of Port Arthur, Texas, is in the western part. Interstate 10 and U.S. Highway 90 cross the area. The New Orleans Naval Air Station is in this MLRA. Fort Jackson, overlooking the mouth of the Mississippi River, and the Jean Lafitte National Historic Park and Preserve are in the MLRA. A number of national wildlife refuges and State parks occur throughout this area. MLRA 151 is a very complex ecosystem with active deltaic development and subsidence with extreme anthropogenic impact by man with construction of flood protection levees and channelization occurring on the eastern portion of the MLRA. The Western portion of the MLRA is more stable in that portions of the landscape is protected naturally by the Chenier's, although there is Anthropogenic affects of the interior due to channelization for navigation.
Classification relationships
Major Land Resource Area (MLRA) and Land Resource Unit (LRU) (USDA-Natural Resources Conservation Service, 2006)
The Natural Communities of Louisiana - (Louisiana Natural Heritage Program - Louisiana Department of Wildlife and Fisheries)
Ecological site concept
These areas are on low Gulf of America coastal fresh water marshes at elevations of 1 foot or less. Slopes range from 0 to 0.1 percent. The soils formed in moderately thick, well decomposed herbaceous organic plant remains overlying fluid clayey or silty sediments or they formed in fluid clayey or loamy sediments deposited under water that have never air-dried and consolidated. The unconsolidated mineral and organic sediments are too soft for cattle to graze. These areas flood very frequently and frequently with fresh water during high water levels from the local rivers and during severe storms by sea water from the gulf; and remain ponded for very long duration. When water depths range from minus 2 inches to plus 6 inches and the water contains less than 0.5 ppt salt, Jamaica sawgrass is dominant. As average water depth increases to 0 to 12 inches, giant cutgrass and American lotus dominates. Giant cutgrass also prefers a salt content of less than 0.5 ppt. In the deepest fresh marsh, where water levels average 1 to 12 inches and salt content is from 5 to 10 ppt, maidencane is dominant. Cattails grow with the California bulrush, especially in water 2 to 18 inches deep and containing up to 15 ppt salt. These plant communities intergrade where water tolerance levels overlap. Other plants such as switchgrass and common reed are locally prominent where their optimum water levels and salinity content are found.
Associated sites
| R151XY005LA |
Brackish Firm Mineral Marsh 55-64 PZ The Fresh Fluid Mineral Marsh frequently occurs adjacent to the Brackish Firm Mineral Marsh. |
|---|---|
| R151XY009LA |
Fresh Firm Mineral Marsh 60-64 PZ The Fresh Fluid Mineral Marsh frequently occurs adjacent to the Brackish Firm Mineral Marsh. |
Similar sites
| R151XY009LA |
Fresh Firm Mineral Marsh 60-64 PZ Similar primary species composition and proportions on both sides. The firm site is potentially about 20% more productive than the fluid site. |
|---|
Table 1. Dominant plant species
| Tree |
Not specified |
|---|---|
| Shrub |
Not specified |
| Herbaceous |
Not specified |
Physiographic features
These areas are on low gulf coastal fresh water marshes at elevations of 1 foot or less. Slopes range from 0 to 0.2 percent. The soils formed in moderately thick, well decomposed herbaceous organic plant remains overlying fluid clayey or silty sediments or they formed in fluid clayey or loamy sediments deposited under water that have never air-dried and consolidated. The unconsolidated mineral and organic sediments are too soft for cattle to graze. These areas flood very frequently and frequently with fresh water during high water levels from the local rivers and during severe storms by sea water from the gulf; and remain ponded for very long duration.
Table 2. Representative physiographic features
| Landforms |
(1)
Marsh
(2) Delta plain |
|---|---|
| Flooding duration | Very long (more than 30 days) |
| Flooding frequency | Frequent to very frequent |
| Ponding duration | Very long (more than 30 days) |
| Ponding frequency | Frequent |
| Elevation | 0 – 2 m |
| Slope | 0% |
| Ponding depth | 0 – 61 cm |
| Water table depth | 0 – 69 cm |
| Aspect | Aspect is not a significant factor |
Climatic features
The average annual precipitation is 60 to 65 inches. About 70 percent of the precipitation occurs during the growing season. Rainfall typically occurs as post-frontal precipitation in the winter and heat-convection showers and thunderstorms in the spring and summer. In addition, tropical storms can bring large amounts of rainfall. The freeze-free period averages 325 days and ranges from 290 to 365 days, increasing in length from north to south.
Table 3. Representative climatic features
| Frost-free period (average) | 327 days |
|---|---|
| Freeze-free period (average) | 327 days |
| Precipitation total (average) | 1,600 mm |
Figure 2. Monthly precipitation range
Figure 3. Monthly average minimum and maximum temperature
Figure 4. Annual precipitation pattern
Figure 5. Annual average temperature pattern
Influencing water features
Marsh ecosystems are characterized by unique vegetative and hydrologic factors. Salinity, depth of water, duration of inundation, and slight differences in elevation determine the kinds of plants that can persist in marsh ecosystems. Frequent to very frequent flooding occurs as the result of high water from up-stream and from occasional tidal surge. Because of the flat slopes and concave surface of these areas, these floodwaters become trapped, resulting in surface ponding of long duration. Several factors may affect salinity and/or water depth as well as duration of inundation:
Natural Factors:
• Upstream Hydrology – the duration of flooding is influenced by the volume of water discharged upstream (runoff) in the hydrologic unit. This may be a permanent or transient feature of the water regime.
• Tidal Exchange – all marsh ecosystems are affected to some degree by tidal exchange.
• Salinity – the amount of salt per unit volume of water is a limiting factor in determining which plants can persist in a marsh ecosystem. Measured in parts per thousand (ppt). Relatively few plants can tolerate prolonged exposure or inundation to waters with high salt concentrations. Salinity level in the Fresh Firm Mineral Marsh is less than 3 ppt.
Human Induced Factors
• Navigation Enhancement – canals and realignment of natural water courses may have catastrophic effects on marsh ecosystems. These features can inject salt water into areas that previously had lower levels of salinity, and/or they may prolong salt water inundation. Navigation features are frequently deeper than previous natural hydrologic conduits. Salt water is heavier than fresh water and creates a salt water wedge below the fresher surface water in a canal or other navigation feature. In marshes near the gulf or adjacent natural water bodies, navigation features can alter the duration and salinity of tidal flux.
• Salt Water Sills or Barriers – these structural measures limit tidal flow. They are usually in a navigable stream or canal and are designed to limit the amount and/or duration of saline inundation.
• Water Control Structures – these structures are designed to maintain optimum water depth in a hydrologic or management unit. They may be used to manipulate water depth for wildlife, moderate salinity levels, and enhance vegetation management.
Soil features
Soils on this site include Allemands, Balize, Carlin, Kenner and Larose. The soils formed in moderately thick, well decomposed herbaceous organic plant remains overlying fluid clayey or silty sediments or they formed in fluid clayey or loamy sediments deposited under water that have never air-dried and consolidated. The thickness or organic material ranges from 0 to 63 inches to the contact with fluid clays or silty clays. The herbaceous surface material is mainly sapric material, but hemic and fibric materials as woody peat or wood fragments occur as thin strata. The unconsolidated mineral and organic sediments are too soft for cattle to graze. The n-values are generally greater than 1.0, but range from 0.7 to more than 1.0. These soils flood frequently and very frequently with fresh water during high water level events from local rivers and during severe storms by sea water from the gulf; and remain ponded for very long duration.
Taxonomic Classification:
Allemands -Clayey, smectitic, euic, hyperthermic Terric Haplosaprists
Balize -Fine-silty, mixed, superactive, nonacid, hyperthermic Typic Hydraquents
Carlin -Clayey, smectitic, euic, hyperthermic Terric Haplosaprists
Kenner -Euic, hyperthermic Fluvaquentic Haplosaprists
Larose – Very-fine, smectitic, nonacid, hyperthermic Typic Hydraquents
Parent material kind is a Decomposed herbaceous organic material overlying fluid clayey and silty alluvium. The parent material origin is fluid clayey backswamp deposits. The surface texture is muck, with mineral content ranging from 15 to 40 percent that is dominantly clay.
Table 4. Representative soil features
| Surface texture |
(1) Mucky (2) Mucky peat |
|---|---|
| Family particle size |
(1) Clayey |
| Drainage class | Poorly drained to very poorly drained |
| Permeability class | Very slow |
| Soil depth | 183 – 254 cm |
| Surface fragment cover <=3" | 0% |
| Surface fragment cover >3" | 0% |
| Available water capacity (0-101.6cm) |
15.24 – 35.56 cm |
| Calcium carbonate equivalent (0-101.6cm) |
0% |
| Electrical conductivity (0-101.6cm) |
0 – 4 mmhos/cm |
| Sodium adsorption ratio (0-101.6cm) |
0 – 15 |
| Subsurface fragment volume <=3" (Depth not specified) |
0% |
| Subsurface fragment volume >3" (Depth not specified) |
0% |
Ecological dynamics
The Fresh Fluid Marsh ecological site is found in coastal marsh adjacent to bayous and relict or existing rivers. These sites have little to no surface drainage. Relief is flat to concave with slopes less than 1%. Elevations range from 0 to 7 feet above mean sea level. The soils are of recent geological origin.
The fresh marsh ecosystem occurs where salinity levels are consistently less than 3 parts per thousand (ppt). Salinity is generally less than 1 ppt, but may fluctuate slightly on the site throughout the year depending on rainfall, tides, and other influences. The site is continually saturated with fresh water which is at the soil surface or as much as 8 to 10 inches above the surface. During extremely dry periods, the site may not have any surface water at low tide. During storm tides the site may have as much as 3 feet of water. These variations cause temporary shifts in kinds, amounts, and proportions of vegetation from species that are typically associated with fresh marsh to those that are generally associated with intermediate marsh conditions.
Vegetation consists almost entirely of grasses and grass-like plants. The site is dominated by maidencane (paille fine) with giant cutgrass, California bulrush (bullwhip), and cattail as the most significant sub-dominant species. The Fresh Fluid Marsh is a dynamic ecosystem which changes constantly, and sometimes rapidly, as a result of natural environmental conditions and climatic events. Tidal exchange determines depth of water, duration of inundation, and salinity of surface and ponded water. These are all factors that influence the amount and kind of vegetation that is present in a selected state.
Areas of open water with floating aquatic vegetation are included within this site. These open water areas are very important to waterfowl and other wildlife.
Water control plans have been developed and implemented on a hydrologic unit basis
on some areas. These plans include the use of water control structures that are designed to maintain constant water depth and salinity in order to support a desired plant community.
The site is subject to flooding from gulf storms. Abnormally high tides that occasionally flood the site are the primary source of soil salinity. The extremely flat slopes and dense vegetation restrict water runoff. Reduced runoff, abundant rainfall, and low evapotranspiration cause the soil to be saturated to the surface most of the year. During the winter months, the soil may have up to 3 inches of water on the surface. During the summer months, increased evapotranspiration rates and higher temperatures may cause the water table to drop to 2 to 10 inches below the soil surface.
The marsh serves as a natural filtration system for the adjacent coastal waters. It captures sediments, waste, pollutants, and nutrients deposited from agricultural, urban, and industrial areas above the marsh. As upstream waters move through the marsh ecosystem, the continuous filtering action releases cleaner water into the gulf. Marsh sites function as nitrogen and phosphorous sinks, resulting in the improvement in the quality of water that passes through the site. It can serve as a buffer to modify the effects of storms. Marsh vegetation also stabilizes the shoreline and reduces erosion caused by tides, wave action, storms, and flooding.
The proximity to the gulf makes this site susceptible to degradation by several natural and human induced actions. Hurricanes and tropical storms can cause entire plant communities to be destroyed in a very short period of time. Constant wind action and low topographic relief make shoreline erosion a constant threat. Those areas with a long fetch of open water are especially vulnerable to wave action. Deepening of existing water bodies and/or dredging new access to canals can cause changes in water depth and increase salinity levels, which may affect marsh vegetation. This may lead to permanent loss of vegetation and eventually result in regression to open water.
Frequency and intensity of fire is an important factor that affects plant composition and production. Elimination of fire from the ecosystem can result in an unhealthy plant community dominated by senescent vegetation and a loss of plant diversity. Fire is primary tool for management of marsh ecosystems. In order for fire to play a beneficial role in marsh management, burning must be done in a prescribed manner. Burning should be done when there is at least six (6) inches of water covering the marsh. This cushion of water protects the vegetative reproduction tissues of marsh plants.
Fire is a primary tool for removal of old growth to encourage vigorous high quality growth and enhance wildlife habitat. Burning increases the quality of the vegetation and changes the structure of the plant community. This attracts geese and small furbearing animals to the freshly burned areas. Wildlife grazing pressure presents a management challenge because it is not possible to consistently control the numbers and movements of most wildlife species. Uncontrolled grazing may result in the decline or elimination of historic vegetation which is replaced by more aggressive and competitive species. Recently burned areas attract wildlife to the area and are subject to overgrazing. Burns should be sufficient in size to prevent destructive grazing (eatouts) by furbearers and geese.
Some plant communities that are dominated by bunchgrasses may be susceptible to sheet erosion. Upright vegetation and the basal stools of these bunchgrasses do not dissipate the energy from tidal fluctuations. Water flow between the basal stools of these bunchgrasses washes away the soil, increases water depth, and jeopardizes the existence of the bunchgrass plant community.
Trafficability is severely restricted on this site because of the saturated soil conditions. The soils on this site are too soft to support livestock grazing. Cattle walkways have been constructed in some areas to provide cattle access for limited grazing on the edges of the site.
State and Transitional Pathways:
The State and Transition Diagram which follows provides information on some of the most typical pathways that the vegetation on this site can follow as the result of natural events, management inputs, and application of conservation treatments. There may be other plant communities that can exist on this site under certain conditions. Consultation with local experts and professionals is recommended prior to application of practices or management strategies in order to ensure that specific objectives will be met.
State and transition model
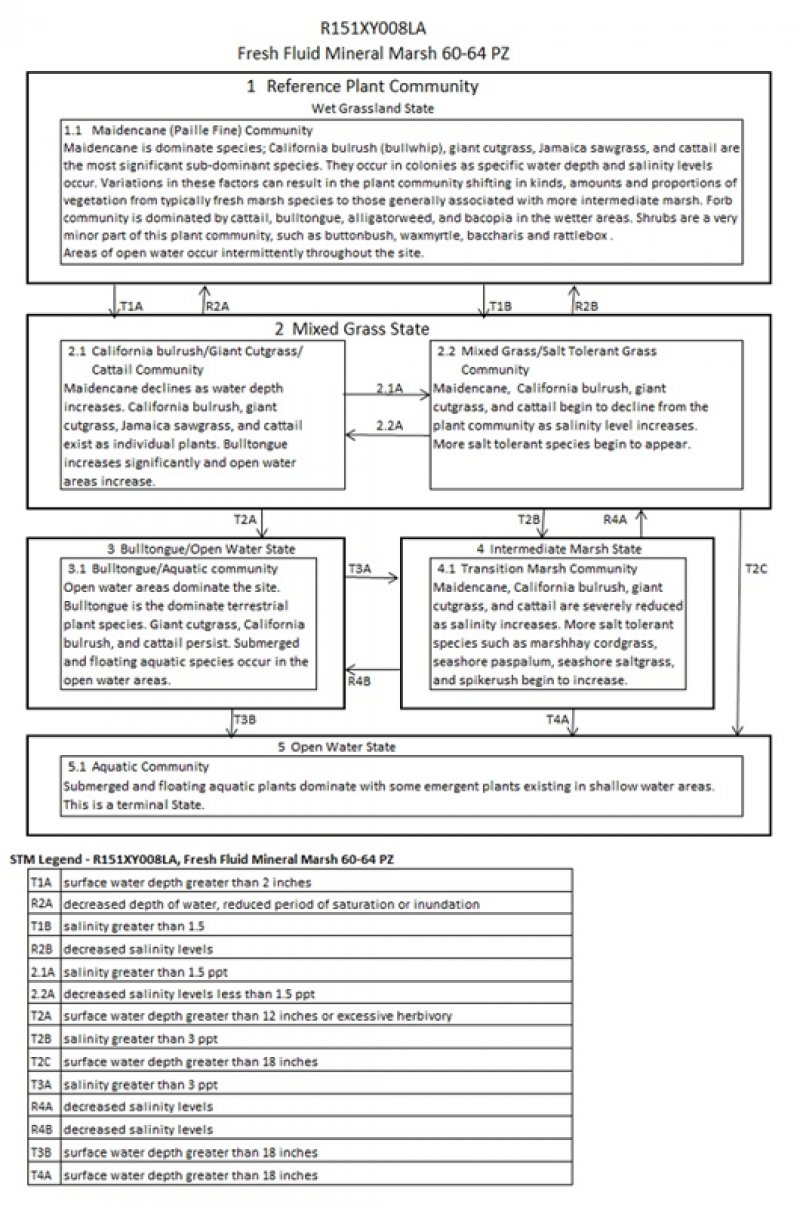
Figure 6. 151XY008 - STM
More interactive model formats are also available.
View Interactive Models
More interactive model formats are also available.
View Interactive Models
Click on state and transition labels to scroll to the respective text
State 1 submodel, plant communities
State 2 submodel, plant communities
State 3 submodel, plant communities
State 4 submodel, plant communities
State 5 submodel, plant communities
State 1
Wet Grassland
Community 1.1
Maidencane (Panicum hemitomon) Community

Figure 7. Fresh Fluid Mineral Marsh - 1.1 Community
The Fresh Firm Mineral Marsh ecological site can potentially support a relatively diverse mixture of grasses, grass-like plants, forbs, and a few widely scattered shrubs. In its historic or pristine state, the vegetation of the Fresh Mineral Marsh ecological site can best be characterized as a plant community comprised of colonies of different plant species interconnected by a single dominant plant species to form a vegetative matrix. Maidencane (paille fine) is the dominant species in this plant community and is the distinctive species that ties the individual colonies of Jamaica sawgrass, California bulrush (bullwhip), giant cutgrass, and cattail together. Each colony exists due to a unique set of factors. Vegetation is directly influenced by factors such as elevation, water depth, and salinity. Variations in one or more of these factors can result in the plant community shifting back and forth from species that are typically associated with more intermediate marsh conditions to species that are generally associated with fresh marsh. Maidencane is most abundant in areas where water depth is less than 2 inches and salinity levels are less than 1 ppt. Jamaica sawgrass is most commonly found in areas where water depths range up to 6 inches, and salinity levels of 3 ppt or more. Giant cutgrass occurs along the edges of waterways and around open water areas within the marsh where the water level increases to 12 inches and the salinity level remains at less than 2 ppt. California bulrush (bullwhip) is prevalent in the deeper fresh marsh areas where water level is up to 12 inches and salinity level increases up to 3.5 ppt. Cattail is present in areas where water depth is 2 to 18 inches. It is most abundant where salinity levels are no more than 1.5 ppt, but can persist where salinity levels are as high as 4 ppt. These plant communities intergrade where water depth and salinity level tolerances overlap. Bulltongue is found in the intermediate ranges of salinity (3 ppt or greater) on this site. Species such as common reed (Roseau cane), switchgrass, bushy bluestem, and sprangletop as well as most forbs and shrubs are found in areas of higher elevation on this site. California bulrush, cattail, giant cutgrass, bulltongue, and alligatorweed occur in areas where depth of water increases. Marshhay cordgrass, seashore paspalum, and spikerush may be found in areas where salinity levels are higher. The leading edge of the plant community is at or near mean high tide (MHT). At MHT, the depth of water can be 1 to 1.5 feet. This plant community can withstand longer periods of inundation as it experiences the longest period of tidal exchange. This plant community must also be able to withstand wave action from adjacent open water bodies. Open water areas, which are frequent in this site, are populated by aquatic plants such as American lotus, water lily, and submerged aquatic species. The primary forbs found on this site are cattail, bulltongue, and alligatorweed. A few widely scattered shrubs may occur on this site, but are not a primary component of the historic climax plant community. Those shrubby species may include buttonbush, waxmyrtle, eastern baccharis, and rattlebox. Tidal energy is dissipated as it moves through this plant community. In some instances, the energy dissipation may result in the development of high banks which can provide a site for more shrubs and woody plants to establish. Fresh Firm Mineral Marsh sites have the potential to produce tremendous amounts of biomass. This extremely high amount of production can be very beneficial, but it can also be detrimental. Prescribed burning can maintain a highly productive marsh dominated by maidencane with significant colonies of other high quality plant species such as Jamaica sawgrass, giant cutgrass, California bulrush, and cattail. If maidencane is allowed to grow over an extended period of time without fire to remove herbage removal by fire, the thatch from previous years accumulates to the point that it restricts sunlight to emerging plants and impedes establishment, reproduction, and growth of desired plant species. A decline in maidencane production results in patchy growth in areas scattered throughout the site. In the areas with restricted or reduced populations of maidencane, plants such as bulltongue may become established. In many instances these patchy growth areas are susceptible to becoming open water areas.
Figure 8. Annual production by plant type (representative values) or group (midpoint values)
Table 5. Annual production by plant type
| Plant type | Low (kg/hectare) |
Representative value (kg/hectare) |
High (kg/hectare) |
|---|---|---|---|
| Grass/Grasslike | 7846 | 13450 | 22417 |
| Forb | 1121 | 1569 | 3363 |
| Shrub/Vine | – | 56 | 112 |
| Total | 8967 | 15075 | 25892 |
Figure 9. Plant community growth curve (percent production by month). LA1511, Louisiana Gulf Coast Marshes. Fresh, Brackish, and Saline Marshes of the Louisiana Gulf Coast .
| Jan | Feb | Mar | Apr | May | Jun | Jul | Aug | Sep | Oct | Nov | Dec |
|---|---|---|---|---|---|---|---|---|---|---|---|
| J | F | M | A | M | J | J | A | S | O | N | D |
| 1 | 3 | 13 | 23 | 25 | 10 | 7 | 5 | 5 | 5 | 2 | 1 |
State 2
Mixed Grass State
Community 2.1
California Bulrush/Giant Cutgrass/Cattail Community
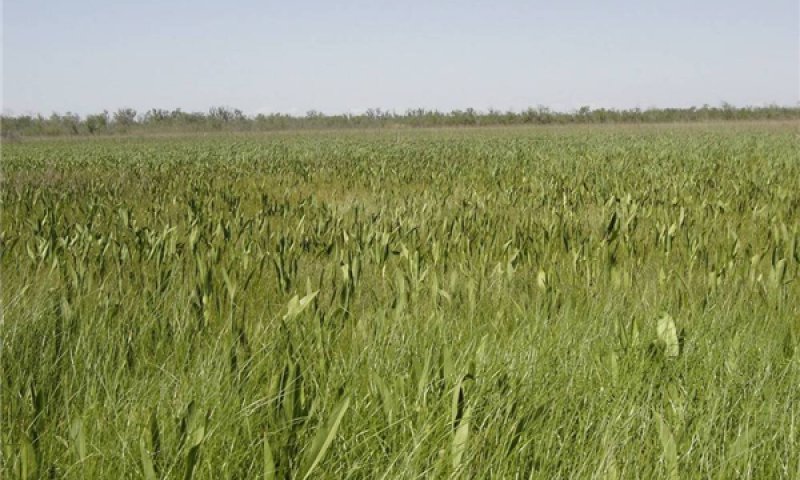
Figure 10. Fresh Fluid Mineral Marsh - 2.1 Community
Marsh plants exist in a delicate balance with water depth and salinity levels. When either of these factors is altered, the plant community adapts to the new regime. As water depth increases, the marsh begins to break up and open water areas increase. The plant species composition is altered in a predictable sequence. As maidencane and Jamaica sawgrass decline, they are replaced by California bulrush, giant cutgrass, cattail, bulltongue, and alligatorweed. As these changes occur plants may exist as individuals rather than in colonies. These changes occur in the following sequence: When water depths exceed 3 inches, maidencane is significantly reduced. Jamaica sawgrass declines as water levels exceed 6 inches. California bulrush and giant cutgrass will persist until water depths exceed 12 inches. Cattail will withstand water depths up to 18 inches. Eventually, only colonies of plants that can persist in deeper water will remain.
Figure 11. Annual production by plant type (representative values) or group (midpoint values)
Table 6. Annual production by plant type
| Plant type | Low (kg/hectare) |
Representative value (kg/hectare) |
High (kg/hectare) |
|---|---|---|---|
| Grass/Grasslike | 2802 | 4483 | 7846 |
| Forb | 1401 | 3923 | 5604 |
| Shrub/Vine | – | – | – |
| Total | 4203 | 8406 | 13450 |
Figure 12. Plant community growth curve (percent production by month). LA1511, Louisiana Gulf Coast Marshes. Fresh, Brackish, and Saline Marshes of the Louisiana Gulf Coast .
| Jan | Feb | Mar | Apr | May | Jun | Jul | Aug | Sep | Oct | Nov | Dec |
|---|---|---|---|---|---|---|---|---|---|---|---|
| J | F | M | A | M | J | J | A | S | O | N | D |
| 1 | 3 | 13 | 23 | 25 | 10 | 7 | 5 | 5 | 5 | 2 | 1 |
Community 2.2
Mixed Grass/Salt Tolerant Grass Community
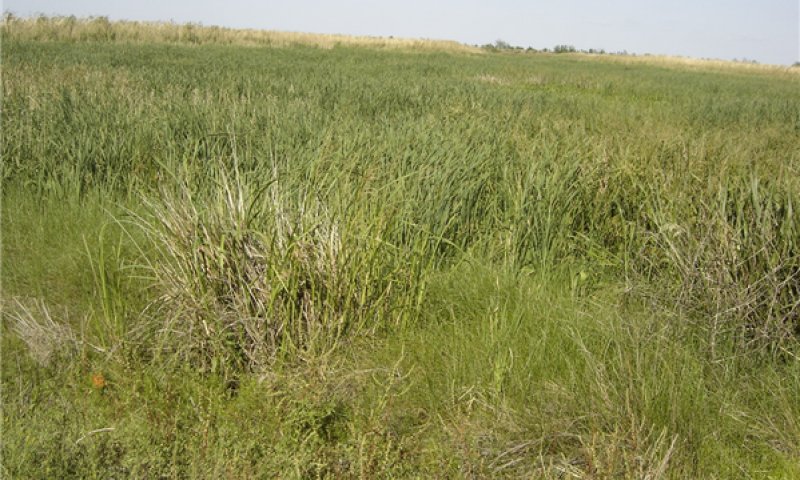
Figure 13. Fresh Fluid Mineral Marsh - 2.2 Community
The fresh marsh is extremely sensitive to increases in salinity. The salinity level of the Fresh Firm Mineral Marsh is consistently less than 3 ppt, and is optimally less than 1 ppt. As salinity increases, the less salt tolerant species begin to decline. Maidencane declines when salinity is consistently greater than 1 ppt. Giant cutgrass can’t tolerate salinity levels greater than 2 ppt. California bulrush will persist in salinity up to 3 ppt. Jamaica sawgrass and cattail are more salt tolerant and will persist when salinity levels are 4 ppt., which grades into an intermediate marsh site. As fresh marsh plants begin to decline from the plant community, more salt tolerant species such as marshhay cordgrass, seashore paspalum, and spikerush begin to appear. This depends on the availability of plant material from adjacent sites
Figure 14. Annual production by plant type (representative values) or group (midpoint values)
Table 7. Annual production by plant type
| Plant type | Low (kg/hectare) |
Representative value (kg/hectare) |
High (kg/hectare) |
|---|---|---|---|
| Grass/Grasslike | 1681 | 2802 | 5604 |
| Forb | 560 | 1121 | 2242 |
| Shrub/Vine | – | – | – |
| Total | 2241 | 3923 | 7846 |
Figure 15. Plant community growth curve (percent production by month). LA1511, Louisiana Gulf Coast Marshes. Fresh, Brackish, and Saline Marshes of the Louisiana Gulf Coast .
| Jan | Feb | Mar | Apr | May | Jun | Jul | Aug | Sep | Oct | Nov | Dec |
|---|---|---|---|---|---|---|---|---|---|---|---|
| J | F | M | A | M | J | J | A | S | O | N | D |
| 1 | 3 | 13 | 23 | 25 | 10 | 7 | 5 | 5 | 5 | 2 | 1 |
Pathway 2.1A
Community 2.1 to 2.2


Salinity increases to greater than 1.5 PPT.
Pathway 2.2A
Community 2.2 to 2.1


Salinity levels decreased to less than 1.5 PPT.
State 3
Bulltongue/Open Water State
Community 3.1
Bulltongue/Aquatic Community
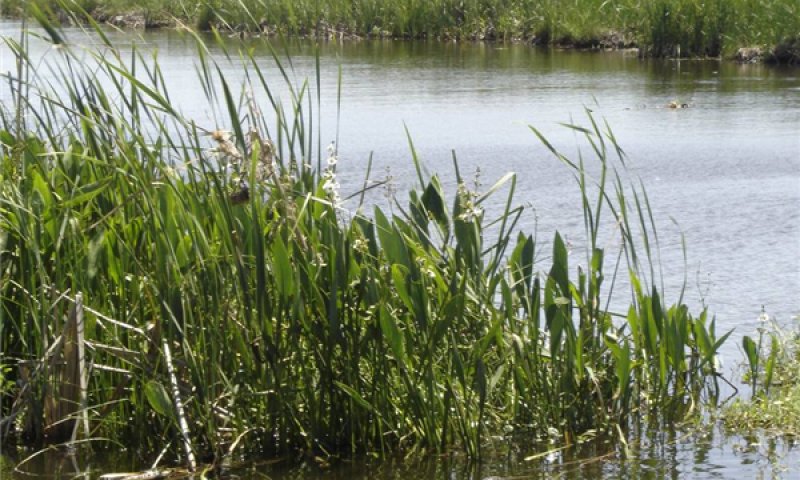
Figure 16. Fresh Fluid Mineral Marsh - 3.1 Community
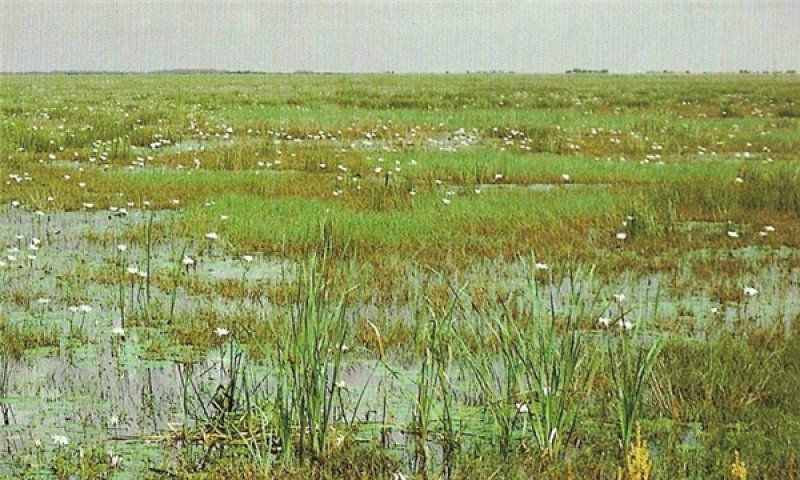
Figure 17. Fresh Fluid Mineral Marsh - 3.1 Community
Increased water depth or destructive grazing by wildlife will cause the marsh to start breaking up. This will eventually result in a community dominated by open water. Bulltongue becomes a dominant plant species. California bulrush and giant cutgrass will still be present in areas where water is less than 12 inches deep. Cattail can withstand water depths up to 18 inches. Aquatic plants including alligatorweed, American lotus, water lily and submergent aquatic species begin to dominate the deeper water areas
Figure 18. Annual production by plant type (representative values) or group (midpoint values)
Table 8. Annual production by plant type
| Plant type | Low (kg/hectare) |
Representative value (kg/hectare) |
High (kg/hectare) |
|---|---|---|---|
| Forb | 336 | 897 | 1681 |
| Grass/Grasslike | 560 | 1121 | 1681 |
| Shrub/Vine | – | – | – |
| Total | 896 | 2018 | 3362 |
Figure 19. Plant community growth curve (percent production by month). LA1511, Louisiana Gulf Coast Marshes. Fresh, Brackish, and Saline Marshes of the Louisiana Gulf Coast .
| Jan | Feb | Mar | Apr | May | Jun | Jul | Aug | Sep | Oct | Nov | Dec |
|---|---|---|---|---|---|---|---|---|---|---|---|
| J | F | M | A | M | J | J | A | S | O | N | D |
| 1 | 3 | 13 | 23 | 25 | 10 | 7 | 5 | 5 | 5 | 2 | 1 |
State 4
Intermediate Marsh State
Community 4.1
Transition Marsh Community
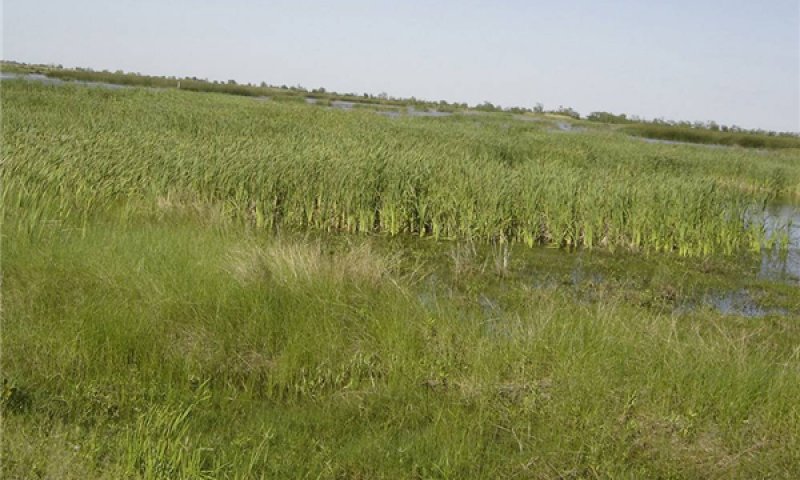
Figure 20. Transition Marsh Community
As salinity levels approach 4 ppt, virtually all of the fresh marsh vegetation dies out. More salt tolerant species such as marshhay cordgrass, spikerush, seashore paspalum, and seashore saltgrass may begin to establish on this site if the plant materials are available from adjacent marsh sites. When this transition occurs the fresh marsh site is actually being converted into an intermediate marsh ecological site.
Figure 21. Annual production by plant type (representative values) or group (midpoint values)
Table 9. Annual production by plant type
| Plant type | Low (kg/hectare) |
Representative value (kg/hectare) |
High (kg/hectare) |
|---|---|---|---|
| Grass/Grasslike | 560 | 1121 | 3923 |
| Forb | 560 | 1121 | 2242 |
| Shrub/Vine | – | – | – |
| Total | 1120 | 2242 | 6165 |
Figure 22. Plant community growth curve (percent production by month). LA1511, Louisiana Gulf Coast Marshes. Fresh, Brackish, and Saline Marshes of the Louisiana Gulf Coast .
| Jan | Feb | Mar | Apr | May | Jun | Jul | Aug | Sep | Oct | Nov | Dec |
|---|---|---|---|---|---|---|---|---|---|---|---|
| J | F | M | A | M | J | J | A | S | O | N | D |
| 1 | 3 | 13 | 23 | 25 | 10 | 7 | 5 | 5 | 5 | 2 | 1 |
State 5
Open Water State
Community 5.1
Aquatic Community
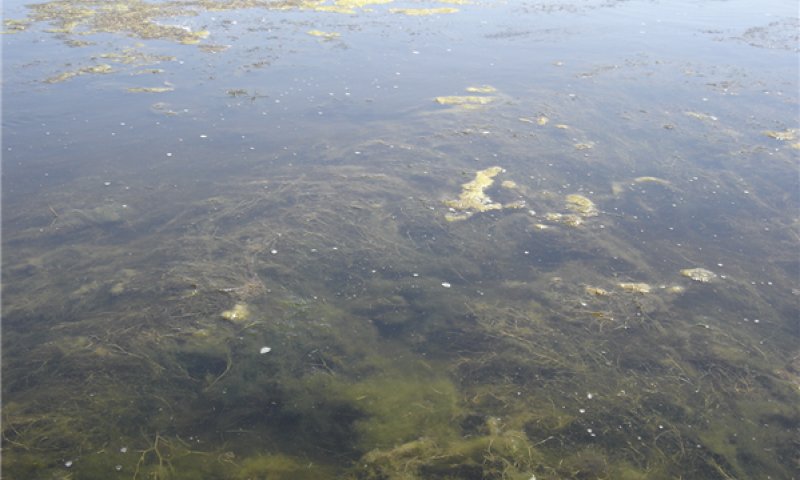
Figure 23. Aquatic Community
As the marsh breaks up, increased water depth precludes the establishment of grasses and the site is transformed into open water. At this stage, widgeongrass and floating, submerged aquatic plants are dominant. A few emergent plants may persist in the shallower water areas. This is a terminal State. Without the implementation of extraordinary conservation or restoration activities, open water will increase into adjacent emergent marsh.
Transition 1A
State 1 to 2
Surface water depth increases to greater than 2 inches.
Transition 1B
State 1 to 2
Salinity increases to greater than 1.5 PPT.
Restoration pathway 2A
State 2 to 1
Decreased depth of water, reduced period of saturation or inundation.
Restoration pathway 2B
State 2 to 1
Decreased salinity levels.
Transition 2A
State 2 to 3
Surface water depth increases to greater than 12 inches or excessive herbivory.
Transition 2B
State 2 to 4
Salinity increases to greater than 3 PPT.
Transition 3A
State 3 to 4
Salinity increases to greater than 3 PPT.
Transition 3B
State 3 to 5
Surface water depth increase to greater than 18 inches.
Restoration pathway 4A
State 4 to 2
Decreased salinity levels.
Restoration pathway 4B
State 4 to 3
Decreased salinity levels.
Transition 4A
State 4 to 5
Surface water depths increase to greater than 18 inches.
Transition 4A
State 4 to 5
Surface water depth increases to greater than 18 inches.
Additional community tables
Table 10. Community 1.1 plant community composition
| Group | Common name | Symbol | Scientific name | Annual production (kg/hectare) | Foliar cover (%) | |
|---|---|---|---|---|---|---|
|
Grass/Grasslike
|
||||||
| 1 | Grasses/Grasslike | 13450–22417 | ||||
| maidencane | PAHE2 | Panicum hemitomon | 1905–22417 | – | ||
| Jamaica swamp sawgrass | CLMAJ | Cladium mariscus ssp. jamaicense | 2242–11208 | – | ||
| giant cutgrass | ZIMI | Zizaniopsis miliacea | 2242–11208 | – | ||
| California bulrush | SCCA11 | Schoenoplectus californicus | 1121–4483 | – | ||
| common reed | PHAU7 | Phragmites australis | 0–2242 | – | ||
| saltmeadow cordgrass | SPPA | Spartina patens | 0–560 | – | ||
| spikerush | ELEOC | Eleocharis | 0–560 | – | ||
| Malabar sprangletop | LEFU21 | Leptochloa fusca | 0–560 | – | ||
| switchgrass | PAVI2 | Panicum virgatum | 0–112 | – | ||
| chairmaker's bulrush | SCAM6 | Schoenoplectus americanus | 0–112 | – | ||
| coast cockspur grass | ECWA | Echinochloa walteri | 0–112 | – | ||
| bushy bluestem | ANGL2 | Andropogon glomeratus | 0–112 | – | ||
|
Forb
|
||||||
| 2 | Forbs | 1121–3363 | ||||
| cattail | TYPHA | Typha | 1121–3363 | – | ||
| bulltongue arrowhead | SALA | Sagittaria lancifolia | 224–1121 | – | ||
| pickerelweed | POCO14 | Pontederia cordata | 224–1121 | – | ||
| knotweed | POLYG4 | Polygonum | 0–112 | – | ||
| alligatorweed | ALPH | Alternanthera philoxeroides | 0–112 | – | ||
| herb of grace | BAMO | Bacopa monnieri | 0–112 | – | ||
|
Shrub/Vine
|
||||||
| 3 | Shrubs | 0–112 | ||||
| eastern baccharis | BAHA | Baccharis halimifolia | 0–112 | – | ||
| common buttonbush | CEOC2 | Cephalanthus occidentalis | 0–112 | – | ||
| wax myrtle | MOCE2 | Morella cerifera | 0–112 | – | ||
| rattlebox | SEPU7 | Sesbania punicea | 0–112 | – | ||
Interpretations
Animal community
The Fresh Firm Mineral Marsh provides good habitat for a variety of terrestrial and avian wildlife species because of the diversity of plant species composition and structure. Deer, alligator, nutria, swamp rabbit, crawfish, and duck concentrations are generally highest in the fresh marsh. Mink, otter, raccoon, geese, and a wide variety of non-game birds also thrive in the fresh marsh. Predators such as coyotes and bobcats are present on this site.
Native white-tailed deer in the marsh have adapted to the wet environment. They have developed exceptionally large hooves that allow them to travel easily in the soft and frequently saturated soils of the marsh. They feed on the tender leaves of the grasses and forbs in the open grasslands of the fresh marsh, and then return to the higher ground in areas where spoil piles from canals and the natural levees of rivers and bayous occur. These slightly elevated and dryer areas support “brushy” vegetation that provides escape cover and shade. These woody plants are also a source of browse, twigs, leaves, fruits, seeds, and mast that are eaten by the deer.
Migratory ducks arrive in the marsh in October, and stay though the winter until late March before returning to the North. Geese prefer to feed in open areas with very short, tender vegetation. They eat the roots, tubers, and tender leaf growth of plants. Recently burned areas are favored feeding grounds for geese. After heavy grazing by geese, these areas are heavily disturbed and often denuded.
Alligators are abundant in the fresh marsh, especially in Cameron, Vermilion, and Calcasieu Parishes. Although they were once a threatened species and were federally protected, their numbers have now increased so greatly that there is a special harvest season to remove surplus animals from the marsh. They are also commercially raised on alligator farms throughout the marsh region.
Nutria are the most common and most abundant furbearer in the fresh marsh. They have the ability to reproduce rapidly and frequently. They can quickly overpopulate an area. They can be very destructive and disruptive of the marsh ecosystem. They burrow into ditch banks, build feeding rafts in the marsh, and severely overgraze vegetation in the marsh. These overgrazed areas are known as “eat outs”. Constant overgrazing by nutria causes deterioration of the desired plant community and is detrimental to other wildlife species.
Trafficability is severely restricted on this site because of the saturated soil conditions. The soils on this site are too soft to support livestock grazing. Cattle walkways have been constructed in some areas to provide cattle access for limited grazing on the edges of the site
Hydrological functions
Waterways such as canals, trapper ditches, and property line ditches, have been developed to gain access to and within inland marshes which were not accessible by natural riverine systems. The development of deepwater navigation canals, as well as the deepening and realignment of natural riverine systems has also provided a conduit for salt water into previously fresher marsh ecosystems.
Geologic subsidence is another major factor in salt water intrusion into fresher marshes. Many of the navigation features that have been installed restrict overbank flow of sediment during periods of high fresh water flow. These sediments help offset the effects of geologic subsidence.
Duration of tidal inundation is also affected by these geologic and human activities. During periods of low fresh water flow, tidal inundation overpowers fresh water head, and saltwater enters previously fresher marsh ecosystems. Tidal salt water inundation results in the die-off of less salt tolerant plant species. The loss of these plants and their root systems leads to soil loss, and result in the area becoming open water. The hydrologic function of tidal fluctuation is a determining factor in fresh marsh ecosystems.
Recreational uses
Hunting, camping, tourism, and bird watching offer recreational opportunities for the public as well as economic opportunities for landowners in the marsh. Duck and goose hunting are prevalent in this area. The marsh sites are preferred areas for resident and migratory waterfowl, songbirds, shore birds, and wading birds. Hunting and fishing camps are common in the marsh. There are many state and national wildlife refuges in the marsh. Commercial enterprises offer air boat excursions, marsh tours, and sightseeing in some areas. Recreational boating, fishing, and crabbing are common activities in adjacent water bodies. In recent years, bird watching has become increasingly popular with the public. Bird watching potential can be enhanced by constructing observation platforms, boardwalks, etc. to provide access for visitors.
Other products
Trappers often use marsh sites to harvest mammals which are valued for their pelts. The marsh provides habitat for numerous furbearers such as muskrats, raccoons, minks, otters, bobcats, and coyotes. Nutria are trapped and harvested as a food source for alligators being produced on alligator farms.
Alligators are harvested for their hides and meat. Alligator eggs are removed from their nests and provided to alligator farms where the eggs are hatched and alligators are produced commercially.
The fresh marsh plays a critical role in the life cycle of many species of estuarine wildlife such as shrimp, blue crab, and menhaden. Fresh marshes serve as nurseries for these species as they mature from the juvenile to the adolescent stage.
Other information
NO LIVESTOCK GRAZING ON THIS SITE.
Supporting information
Inventory data references
Production and Composition Data for Native Grazing Lands (SCS-RANGE-417) clipping data was reviewed to determine species occurrence and production on soils that are representative of the Fresh Fluid Mineral Marsh ecological site. In addition vegetation transect data from Terrebonne, Cameron, and Lafourche Parishes collected from 1991-1995 was used to determine species occurrence and production on typical Fresh Fluid Mineral Marsh ecological sites.
Other references
• Allen, Dr. Charles, Dawn Allen Newman, and Dr. Harry Winters. Grasses of Louisiana, 3rd Edition. Allen’s Native Ventures. Pitkin, LA. 2004.
• Ball, D.M., C.S. Hoveland, and G.D. Lacefield. Southern Forages, Third Edition. Potash and Phosphate Institute and Foundation for Agronomic Research. Norcross, GA. 2002.
• Brown, Clair A. Wildflowers of Louisiana and Adjoining States. Louisiana State University Press. Baton Rouge, LA. 1991.
• Chabreck, Robert H. and R.E. Condrey. Common Vascular Plants of the Louisiana Marsh. Sea Grant Publication No. LSU-T-79-003. Louisiana State University Center for Wetland Resources. Baton Rouge, LA. 1979.
• Chabreck, Robert H. Vegetation, Water and Soil Characteristics of the Louisiana Coastal Region. Bulletin 664. Louisiana State University. Baton Rouge, LA. 1972.
• Cutshall, Jack R. Vegetation Establishment of Smooth Cordgrass (Spartna alterniflora) for Shoreline Erosion Control. Soil Conservation Service, Alexandria, LA. 1984.
• Daigle, Jerry, et. al. Ecoregions of Louisiana. Interagency map and descriptions. US EPA, USDA NRCS, and USGS.
• Louisiana Department of Wildlife and Fisheries. The Natural Communities of Louisiana. Louisiana Natural Heritage Program. LDWF. Baton Rouge, LA. 2004
• Southeast Texas Resource Conservation and Development Sponsors. Southeast Texas Resource Conservation and Development, Inc. Coastal Marsh Management–Southeast Texas.
• Stutzenbaker, Charles D. Aquatic and Wetland Plants of the Western Gulf Coast. Texas Parks and Wildlife Department, Wildlife Division. Austin, TX. 1999.
• Tarver, David P., John A. Rodgers, Michael J. Mahler, and Robert L. Lazor. Aquatic and Wetland Plants of Florida Second Edition. Bureau of Aquatic Plant Research and Control. Florida Department of Natural Resources. 1979.
• Radford, Albert E., Harry E. Ahles and C. Ritchie Bell. Manual of the Vascular Flora of the Carolinas. The University of north Carolina Press. Chapel Hill, NC. 1987
• Thomas, R. Dale & Charles M. Allen. Atlas of the Vascular Flora of Louisiana, Vol.I: Ferns & Fern Allies, Conifers, & Monocotyledons. Louisiana Department of Wildlife & Fisheries Natural Heritage Program and The Nature Conservancy. Baton Rouge, LA. 1993.
• Thomas, R. Dale & Charles M. Allen. Atlas of the Vascular Flora of Louisiana, Vol.II: Dicotyledons, Acanthaceae – Euphorbiaceae. Louisiana Department of Wildlife & Fisheries Natural Heritage Program and The Nature Conservancy. Baton Rouge, LA. 1996.
• Thomas, R. Dale & Charles M. Allen. Atlas of the Vascular Flora of Louisiana, Vol.III: Dicotyledons, Fabaceae – Zygophyllaceae. Louisiana Department of Wildlife & Fisheries Natural Heritage Program and The Nature Conservancy. Baton Rouge, LA. 1998.
• United States Army Corps of Enginerers. New Orleans District, Regulatory Functions Brabch. USACOE, New Orleans, LA. 1977.
• United States Department of Agriculture Natural Resources Conservation Service. The PLANTS Database http://plants.usda.gov. USDA NRCS National Plant Data Center. Baton Rouge, LA. 2008.
• United States Department of Agriculture Natural Resources Conservation Service. Cameron-Creole Watershed 2003 Vegetative Monitoring Report. USDA NRCS. Alexandria, LA. 2007.
• United States Department of Agriculture Natural Resources Conservation Service. Ag Handbook 296. Land Resource Regions and Major Land Resource Areas of the United States, the Caribbean, and the Pacific Basin. USDA NRCS Soil Survey Division. Washington, DC. 2006.
• United States Department of Agriculture Natural Resources Conservation Service. Production and Composition Record for Native Grazing Lands. SCS-RANGE-417 data from Cameron, Vermillion, Iberia, St. Mary, Terrebonne, and La Fourche Parishes. 1981-1986.
• United States Department of Agriculture Natural Resources Conservation Service. Published Soil Surveys from Cameron, Vermillion, Iberia, St. Mary, Terrebonne, and La Fourche Parishes. Various publication dates.
• United States Department of Agriculture Natural Resources Conservation Service. Web Soil Survey. http://websoilsurvey.nrcs.usda.gov/app. USDA NRCS Soil Survey Division. Washington, DC. 2008.
• United States Department of Agriculture Soil Conservation Service. Louisiana Wetlands Plant List. USDA SCS Louisiana Bulletin No. 190-7-3. USDA SCS. Alexandria, LA. 1986.
• United States Department of Agriculture Soil Conservation Service. Range Site Descriptions for the Gulf Coast Marsh Major Land Resource Area 151. USDA SCS. Alexandria, LA. Various publication dates.
• United States Department of Agriculture Soil Conservation Service. Range Site Descriptions for the Coastal Saline Prairie Major Land Resource Area 150B. USDA SCS. Alexandria, LA. Various publication dates.
• United States Department of Agriculture Soil Conservation Service. Submerged and Floating Aquatic Plants of South Louisiana. Alexandria, LA. 1988.
• United States Department of Agriculture Soil Conservation Service. Marshland Vegetation for Waterfowl and Furbearers. Alexandria, LA. 1988.
• United States Department of Agriculture Soil Conservation Service. Southern Wetland Flora. USDA SCS South National Technical Center, Fort Worth, TX.
• United States Department of Agriculture Soil Conservation Service. Louisiana’s Native Ranges and Their Proper Use. USDA SCS. Alexandria, LA. 1982.
• United States Department of Agriculture Soil Conservation Service. Gulf Coast Wetlands Handbook. USDA SCS. Alexandria, LA. 1977.
• United States Department of Agriculture Soil Conservation Service. 100 Native Forage Grasses in 11 Southern States. Agriculture Handbook 389. 1971
• United States Department of Agriculture Soil Conservation Service. Louisiana Range Handbook. USDA SCS. Alexandria, LA. 1956.
• United States Department of Agriculture Soil Conservation Service. Results of Plant Analyses From Samples Sent In During 1950 (Louisiana). USDA Soil Conservation Service Operations Laboratory. Soil Conservation Service. Fort Worth, TX. 1951.
• United States Department of Interior Fish and Wildlife Service. Classification of Wetlands and Deepwater Habitats of the United States. USDI FWS. Washington, DC. 1979.
• United States Department of Interior Fish and Wildlife Service. National List of Plant Species That Occur In wetlands: Southeast Region (Region 2). USDI FWS Biological Report 88. Washington, DC. 1988.
• Yarlett, Lewis A. Common Grasses of Florida and the Southeast. The Florida Native Plant Society. Spring Hill, FL. 1996.
ACKNOWLEDGEMENTS
We would like to express our appreciation to the following for their assistance and input in the development of this document:
Apache Louisiana Minerals, Inc., Houma, LA
Johanna Pate, State Grazing Lands Specialist, USDA Natural Resources Conservation Service, Alexandria, LA
Contributors
D. Charles Stemmans II
Jack Cutshall And Dan Caudle
Jack R. Cutshall And Dan M. Caudle
Approval
Matthew Duvall, 3/24/2025
Rangeland health reference sheet
Interpreting Indicators of Rangeland Health is a qualitative assessment protocol used to determine ecosystem condition based on benchmark characteristics described in the Reference Sheet. A suite of 17 (or more) indicators are typically considered in an assessment. The ecological site(s) representative of an assessment location must be known prior to applying the protocol and must be verified based on soils and climate. Current plant community cannot be used to identify the ecological site.
| Author(s)/participant(s) |
Johanna Pate Louisiana NRCS State Grazing Lands Specialist |
|---|---|
| Contact for lead author |
3737 Government Street Alexandria, LA 71302 318-473-7808 |
| Date | 04/21/2009 |
| Approved by | Matthew Duvall |
| Approval date | |
| Composition (Indicators 10 and 12) based on | Annual Production |
Indicators
-
Number and extent of rills:
N/A -
Presence of water flow patterns:
Daily tidal exchange -
Number and height of erosional pedestals or terracettes:
Dissected by canals, bayous, and relict rivers. Significant amount of open water areas interspersed throughout the site. -
Bare ground from Ecological Site Description or other studies (rock, litter, lichen, moss, plant canopy are not bare ground):
Expect less than 5% exposed soil surface. -
Number of gullies and erosion associated with gullies:
N/A -
Extent of wind scoured, blowouts and/or depositional areas:
N/A -
Amount of litter movement (describe size and distance expected to travel):
Excessive litter accumulation from herbaceous plants (leaves 3-6 inches wide and up to 4-8 feet tall). Little movement in normal conditions. Most is flushed away by extreme weather events. -
Soil surface (top few mm) resistance to erosion (stability values are averages - most sites will show a range of values):
Soil surface around base of plants is subject to sheet erosion due to daily tidal activity. Shoreline is subject to erosion due to excessive wave action. -
Soil surface structure and SOM content (include type of structure and A-horizon color and thickness):
0-8 inches dark gray muck, 8-60+ inches very fluid, very dark gray mucky clay. Significant amount of coarse fibers, roots, and plant litter. -
Effect of community phase composition (relative proportion of different functional groups) and spatial distribution on infiltration and runoff:
N/A -
Presence and thickness of compaction layer (usually none; describe soil profile features which may be mistaken for compaction on this site):
N/A -
Functional/Structural Groups (list in order of descending dominance by above-ground annual-production or live foliar cover using symbols: >>, >, = to indicate much greater than, greater than, and equal to):
Dominant:
Warm-season grasses and grass-likesSub-dominant:
Perennial forbsOther:
Sod forming grasses, shrubsAdditional:
-
Amount of plant mortality and decadence (include which functional groups are expected to show mortality or decadence):
Perennial grasses will naturally exhibit a minor amount (less than 5%) of senescence and some mortality every year. -
Average percent litter cover (%) and depth ( in):
Significant litter (up to 30-40%). Litter and detritus is flushed away during extreme weather events. Litter is consumed by prescribed fires. -
Expected annual annual-production (this is TOTAL above-ground annual-production, not just forage annual-production):
7000 to 20,000 pounds per acre -
Potential invasive (including noxious) species (native and non-native). List species which BOTH characterize degraded states and have the potential to become a dominant or co-dominant species on the ecological site if their future establishment and growth is not actively controlled by management interventions. Species that become dominant for only one to several years (e.g., short-term response to drought or wildfire) are not invasive plants. Note that unlike other indicators, we are describing what is NOT expected in the reference state for the ecological site:
N/A -
Perennial plant reproductive capability:
All perennial species should be capable of reproducing every year unless disrupted by catastrophic events occurring immediately prior to, or during the reproductive phase.
Print Options
Sections
Font
Other
The Ecosystem Dynamics Interpretive Tool is an information system framework developed by the USDA-ARS Jornada Experimental Range, USDA Natural Resources Conservation Service, and New Mexico State University.
Click on box and path labels to scroll to the respective text.