Ecological dynamics
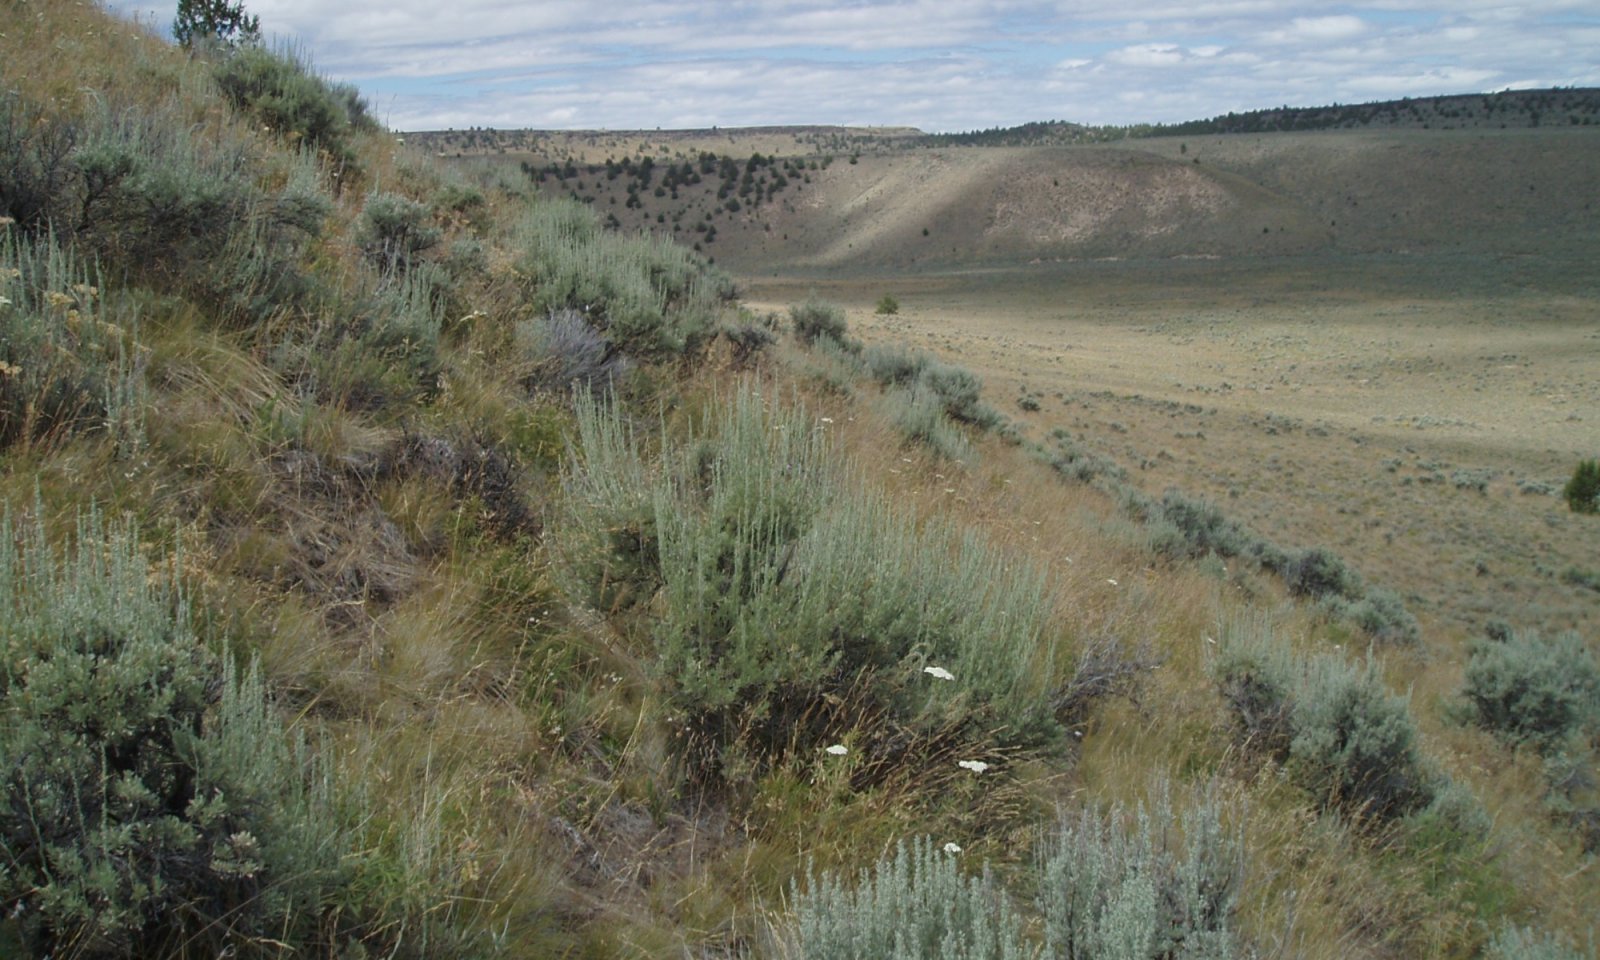
The reference plant community is dominated by Idaho fescue and bluebunch wheatgrass in the understory and mountain big sagebrush in the overstory. Sandberg bluegrass, prairie junegrass, squirreltail and a variety of forbs are also present.
Ecological Dynamics and Disturbance Response:
Ecological dynamics of this site are primarily driven by interactions between climatic patterns and disturbance regimes. Frequent low intensity fires were the historical disturbance that maintained the reference state and drove plant community shifts within the state. Intensity and frequency of these fires is strongly influence by drought cycles and insect or disease attacks on the plant community. Introduction of exotic annual grasses compromises the resistance and resiliency of the site, putting it at higher risk of crossing a threshold into another state.
Periodic drought regularly influences sagebrush ecosystems and drought duration and severity has increased throughout the 20th century in much of the Intermountain West. Major shifts away from historical precipitation patterns have the greatest potential to alter ecosystem function and productivity. Species composition and productivity can be altered by the timing of precipitation and water availability with the soil profile (Bates et al. 2006).
The Great Basin sagebrush communities have high spatial and temporal variability in precipitation both among years and within growing seasons. Nutrient availability is typically low but increases with elevation and closely follows moisture availability. The invasibility of plant communities is often linked to resource availability. Disturbance can decrease resource uptake due to damage or mortality of the native species and depressed competition or can increase resource pools by the decomposition of dead plant material following disturbance. The invasion of sagebrush communities by cheatgrass (Bromus tectorum) has been linked to disturbances (fire, abusive grazing) that have resulted in fluctuations in resources (Chambers et al. 2007).
The range and density of western juniper has increased since the middle of the nineteenth century (Tausch 1999, Miller and Tausch 2000). Causes for expansion of western juniper into sagebrush ecosystems include wildfire suppression, historic livestock grazing, and climate change (Bunting 1994). Mean fire return intervals prior to European settlement in mountain big sagebrush ecosystems were 15 to 25 years (Burkhardt and Tisdale 1976, Young and Evans 1981), frequent enough to inhibit the encroachment of western juniper into these big sagebrush cover types (Miller and Tausch 2000). With the increased suppression of wildfire and livestock grazing, which reduces ground fuels and understory competition, regeneration and establishment of western juniper have expanded into suitable sites previously dominated by big sagebrush (Burns and Honkala 1990). An increase in crown density causes a decrease in understory perennial vegetation and an increase in bare ground. This allows for the invasion of non-native annual species such as cheatgrass (Bromus tectorum) and medusahead (Taeniatherum caput-medusae). With annual species in the understory wildfire can become more frequent and increase in intensity. With frequent wildfires these plant communities can convert to annual species with a sprouting shrub and juvenile tree overstory.
Treatment Response:
North facing aspects respond positively to juniper removal if soil erosion is not significant. Seeding may be necessary if there is less than one to two bunchgrass plants per meter square in the understory. Sagebrush and forbs may also need to be seeded if adult plants are no longer present in the understory.
Adapted from: Stringham, et al. 2017
State 1
Historic Reference
The Reference State 1.0 is a representation of the natural range of variability under pristine conditions. The reference state has 3 general community phases; a shrub-grass dominant phase, a perennial grass dominant phase and a shrub dominant phase. State dynamics are maintained by interactions between climatic patterns and disturbance regimes. Negative feedbacks enhance ecosystem resilience and contribute to the stability of the state. These include the presence of all structural and functional groups, low fine fuel loads, and retention of organic matter and nutrients. Plant community phase changes are primarily driven by fire, periodic drought and/or insect or disease attack. Negative feedbacks enhance ecosystem resilience and contribute to the stability of the state. These feedbacks include the presence of all structural and functional groups, low fine fuel loads, and retention of organic matter and nutrients.
Community 1.1
Reference Community
Mountain Big Sagebrush - Idaho Fescue
Deep-rooted perennial bunchgrasses and sagebrush are dominant, with a diverse forb component present. Annual non-native species present.
Table 5. Annual production by plant type
| Plant type |
Low
(lb/acre) |
Representative value
(lb/acre) |
High
(lb/acre) |
| Grass/Grasslike |
740 |
905 |
1150 |
| Shrub/Vine |
95 |
115 |
145 |
| Forb |
50 |
60 |
80 |
| Tree |
15 |
20 |
25 |
| Total |
900 |
1100 |
1400 |
Table 6. Ground cover
| Tree foliar cover |
0-1%
|
| Shrub/vine/liana foliar cover |
5-10%
|
| Grass/grasslike foliar cover |
50-60%
|
| Forb foliar cover |
0-5%
|
| Non-vascular plants |
25-35%
|
| Biological crusts |
0%
|
| Litter |
5-10%
|
| Surface fragments >0.25" and <=3" |
3-5%
|
| Surface fragments >3" |
4-6%
|
| Bedrock |
0%
|
| Water |
0%
|
| Bare ground |
0-2%
|
| Jan |
Feb |
Mar |
Apr |
May |
Jun |
Jul |
Aug |
Sep |
Oct |
Nov |
Dec |
| J |
F |
M |
A |
M |
J |
J |
A |
S |
O |
N |
D |
Community 1.2
Perennial Bunchgrasses Dominant
Deep-rooted perennial bunchgrasses are dominant and forbs may increase.
Community 1.3
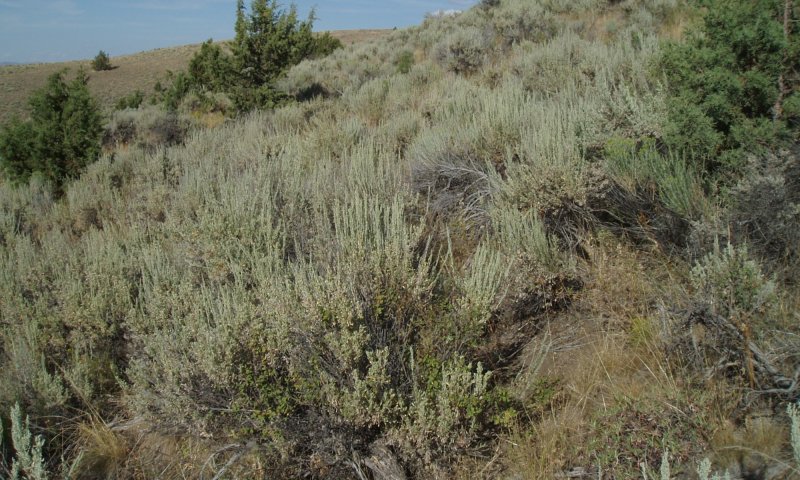
Sagebrush Dominant
Sagebrush increases while the deep-rooted perennial bunchgrasses decrease and young juniper increase.
Pathway 1.1A
Community 1.1 to 1.2
Low severity fire creates a grass and sagebrush mosaic; high severity fire significantly reduces sagebrush cover and leads to a community dominated by grasses and forbs.
Pathway 1.1B
Community 1.1 to 1.3
Time and lack of disturbance such as fire facilitates an increase in the shrub overstory.
Pathway 1.2A
Community 1.2 to 1.1
Time and lack of disturbance allows for shrub regeneration.
Pathway 1.3A
Community 1.3 to 1.1
High severity fire significantly reduces sagebrush and juniper cover and leads to a community dominated by grasses and forbs.
Pathway 1.3B
Community 1.3 to 1.2
Low severity fire reduces sagebrush and juniper cover and creates a sagebrush and grass mosaic.
State 2
Current Potential
This state is similar to the Reference State 1.0 with three similar community phases. Ecological function has not changed, however the resiliency of the state has been reduced by the presence of invasive weeds. Non-natives may increase in abundance but will not become dominant within this State. These non-natives can be highly flammable and can promote fire where historically fire had been infrequent. Negative feedbacks enhance ecosystem resilience and contribute to the stability of the state. These feedbacks include the presence of all structural and functional groups, low fine fuel loads, and retention of organic matter and nutrients. Positive feedbacks decrease ecosystem resilience and stability of the state. These include the non-natives’ high seed output, persistent seed bank, rapid growth rate, residual dry matter accumulation, and adaptations for seed dispersal.
Community 2.1
Bunchgrasses/Sagebrush
Deep-rooted perennial bunchgrasses and sagebrush are dominant, with a diverse forb component present. Annual non-native species are present.
Community 2.2
Perennial Bunchgrasses/Annuals
Deep-rooted perennial bunchgrasses are dominant with annual non-native species present to increase. Forbs may increase.
Community 2.3
Sagebrush/Annuals
Sagebrush increases while the deep-rooted perennial bunchgrasses decrease. The young juniper are increasing and the non-native annual species are present and increasing.
Pathway 2.1A
Community 2.1 to 2.2
Low severity fire creates a grass and sagebrush mosaic; high severity fire significantly reduces sagebrush cover and leads to a community dominated by grasses and forbs. Brush treatments and tree thinning would also reduce the overstory allowing the perennial understory to increase.
Pathway 2.1B
Community 2.1 to 2.3
Time and lack of disturbance such as fire facilitates an increase in the shrub overstory; may be coupled with drought.
Pathway 2.2A
Community 2.2 to 2.1
Time and lack of disturbance allows for shrub regeneration.
Pathway 2.3A
Community 2.3 to 2.1
Moderate to high severity fire reduces sagebrush and juniper cover and leaves a community dominated by grasses and forbs. Brush treatments and tree thinning would also reduce the overstory allowing the perennial understory to increase.
Pathway 2.3B
Community 2.3 to 2.2
Low severity fire creates a sagebrush and grass mosaic. Brush treatments and tree thinning would also reduce the overstory allowing the perennial understory to increase.
State 3
Shrub
This state is a product of many years of heavy grazing during time periods harmful to perennial bunchgrasses, changes in the historic fire regime or long-term drought favoring shrub establishment. Grazing tolerant Sandberg bluegrass will increase with a reduction in deep rooted perennial bunchgrass competition and become the dominant grass. Sagebrush dominates the overstory and rabbitbrush may be a significant component. Sagebrush cover exceeds site concept and may be decadent, reflecting stand maturity and lack of seedling establishment due to competition with mature plants. The shrub overstory and Sandberg bluegrass understory dominate site resources such that soil water, nutrient capture, nutrient cycling and soil organic matter are temporally and spatially redistributed (3.1). In both community phases, bare ground may be significant with soil redistribution occurring between interspace and shrub locations. Western juniper increases and may begin to influence the understory vegetation.
Community 3.1
Sagebrush/Bluegrass/Annuals
Sagebrush is dominant and Sandberg bluegrass is increasing. The deep-rooted perennial bunchgrasses are a minor component or are missing. Non-native annual species are present and increasing. Western juniper is present to increasing.
Community 3.2
Bluegrass/Sagebrush/Annuals
Sandberg bluegrass is dominant with sagebrush decreasing. Deep-rooted perennial grasses are a minor component or missing. Non-native annual species are present to increasing. Western juniper is present to increasing.
Pathway 3.1A
Community 3.1 to 3.2
Fire or brush treatments with minimal soil disturbance.
Pathway 3.2A
Community 3.2 to 3.1
Time and lack of disturbance allows for sagebrush to recover. Western juniper may increase.
State 4
Annual
This community is characterized by the dominance of annual non-native species such as cheatgrass, medusahead, and tansy mustard in the understory. Sagebrush and rabbitbrush may dominate the overstory.
Community 4.1
Shrubs/Annuals
Sagebrush and rabbitbrush is dominant in the community with annual non-native species dominant in the understory. Mat forming forbs increase and Western juniper present to increasing.
Community 4.2
Annuals
Annual non-native species are dominant once the perennial grasses decrease. Western juniper may be present. Rabbitbrush and other sprouting shrubs may increase.
Pathway 4.1A
Community 4.1 to 4.2
Fire
Pathway 4.2A
Community 4.2 to 4.1
Time and lack of disturbance allows for sagebrush and sprouting shrubs to increase. Western juniper may be present.
State 5
Tree
This state is characterized by a dominance of western juniper in the overstory. Sagebrush and perennial bunchgrasses may still be present, but they are no longer controlling site resources. Soil moisture, soil nutrients and soil organic matter distribution and cycling have been spatially and temporally altered.
Community 5.1
Juniper/Sagebrush
Western juniper becomes dominant as sagebrush decreases. Deep-rooted perennial grasses decrease and Sandberg bluegrass may increase. Non-native annual species increase.
Community 5.2
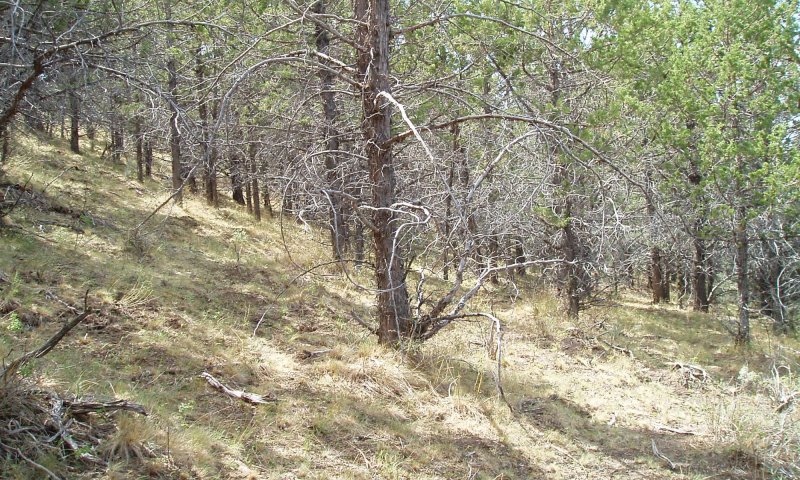
Juniper Woodland
Western juniper is dominant with only a minor component of sagebrush. Deep-rooted perennial grasses are also a minor component or may be missing. Non-native annual species increase and the bare ground may be increasing.
Pathway 5.1A
Community 5.1 to 5.2
Time and lack of disturbance allows for maturation of the tree community.
Transition T1A
State 1 to 2
Introduction of non-native species
Transition T2A
State 2 to 3
Less frequent fire or extended drought reduces perennial bunchgrasses and allows for an increase in shrub and tree species
Transition T2B
State 2 to 4
Catastrophic fire, often coupled with soil disturbing activities or extended drought.
Transition T2C
State 2 to 5
Time and lack of disturbance allows for maturation of the tree community
Transition T3A
State 3 to 4
Catastrophic fire, multiple fires, or soil disturbing treatments or activities.
Transition T3B
State 3 to 5
Time and lack of disturbance allows for maturation of the tree community.
Restoration pathway R5A
State 5 to 2
Mechanical treatment of trees coupled with seeding of desired species.
Restoration pathway R5B
State 5 to 3
Mechanical treatment of trees
Transition T5A
State 5 to 4
Catastrophic fire