
Natural Resources
Conservation Service
Ecological site R018XI104CA
Thermic Ultramafic North-Facing Steep Slopes
Last updated: 4/24/2024
Accessed: 11/22/2024
General information
Provisional. A provisional ecological site description has undergone quality control and quality assurance review. It contains a working state and transition model and enough information to identify the ecological site.
MLRA notes
Major Land Resource Area (MLRA): 018X–Sierra Nevada Foothills
Major Land Resource Area (MLRA) 18, Sierra Nevada Foothills is located entirely in California and runs north to south adjacent to, down-slope, and east of the Sierra Nevada Mountains (MLRA 22A). MLRA 18 includes rolling to steep dissected hills and low mountains, with several very steep river valleys. Climate is distinctively Mediterranean (xeric soil moisture regime) with hot, dry summers, and relatively cool, wet winters. Most of the precipitation comes as rain; average annual precipitation ranges from 15 to 55 inches in most of the area (precipitation generally increases with elevation and from south to north). Soil temperature regime is thermic; mean annual air temperature generally ranges between 52 and 64 degrees F. Geology is rather complex in this region; there were several volcanic flow and ashfall events, as well as tectonic uplift, during the past 25 million years that contributed to the current landscape.
LRU notes
This LRU (designated XI) is located on moderate to steep hills in the Sierra Nevada Foothills east of Sacramento, Stockton, and Modesto, CA. Various geologies occur in this region: metavolcanics, granodiorite, slate, marble, argillite, schist and quartzite, as well as ultramafic bands to a limited and localized extent. It includes mesa formations from volcanic flows, where vernal pool habitats occur. Soil temperature regime is thermic and soil moisture regime is xeric. Elevation ranges between 300 and 3400 feet above sea level. Precipitation ranges from 14 to 42 inches annually. Most precipitation falls between the months of November and March in the form of rain. Dominant vegetation includes annual grasslands, blue oak (Quercus douglasii), interior live oak (Quercus wislizeni), chamise (Adenostoma fasciculatum), buckbrush (Ceanothus cuneatus), and foothill pine (Pinus sabiniana).
Classification relationships
CLASSIFICATION RELATIONSHIPS
This site is located within M261F, the Sierra Nevada Foothills Section, (McNab et al., 2007) of the National Hierarchical Framework of Ecological Units (Cleland et al., 1997), M261Fb, the Lower Foothills Metamorphic Belt Subsection.
Level III and Level IV ecoregions systems (Omernik, 1987, and EPA, 2011) are: Level III, Central California Foothills and Coastal Mountains and Level IV, Ecoregion 6b, Northern Sierran Foothills, Ecoregion 6c, Comanche Terraces.
Ecological site concept
This site is defined by soil formed from ultramafic bedrock on north-facing aspects (30-70% slopes). These soils are characterized by low Ca:Mg ratios (generally < 2 in the subsurface horizons) and high heavy metal concentrations (Cr, Ni, Zn, Cu, Fe Co Cd, etc.) These higher concentrations of metals are toxic to many plants and often cause stunted growth or reduced productivity. The influence of soil chemistry is readily apparent on vegetation composition, production, and species distribution, with strikingly different plant communities than in the adjacent non-serpentinite derived soils (see Kruckeberg, 1984; McGahan et al., 2009. Vegetation expression on soils formed from serpentinite vary from completely barren ground to chaparral (Lazarus et al., 2011), to altered species composition and conifer density in forest communities (e.g. coastal Oregon, Kruckeberg, 1984). These variations depend on the chemical composition and degree of alteration of the parent material as well as the climate and topography of the particular site.
This ecological site concept is primarily defined by the parent material type, and to a secondary degree aspect, which consists of north to east facing aspects. The vegetation community, primarily the shrub component, is more diverse than what is observed in other ultramafic sites that occur on drier, south facing slopes. In this ecological site, toyon (Heteromeles arbutifolia), buckthorn (Rhamnus spp.), and manzanita (Arctostaphylos spp.) compete with buckbrush for dominance. The production RV is about 380 lbs per acre and ranges between 96 and 662 lbs per acre.
Supporting Documentation
Kruckeberg, A. R. 1984. California serpentines: flora, vegetation, geology, soils, and management problems. University of California Press: Berkeley and Los Angeles, CA.
Lazarus, B. E., J. H. Richards, V. P. Claassen, R. E. O’Dell, and M. A. Ferrell. 2011. Species and specific plant-soil interactions influence plant distribution on serpentine soils. Plant and Soil 342:327-344.
McGahan, D. G., R. J. Southard, and V. P. Claassen. 2009. Plant-Available calcium varies widely in soils on serpentinite landscapes. Soil Science Society of America Journal 73:2087-2095.
Associated sites
| R018XI102CA |
Thermic Ultramafic Foothills Extremely High Magnesium Content (Ca:Mg Ratio Less Than 0.5) This site commonly occurs nearby. |
|---|
Similar sites
| R018XI102CA |
Thermic Ultramafic Foothills Extremely High Magnesium Content (Ca:Mg Ratio Less Than 0.5) Site relationships being developed. |
|---|---|
| R018XI103CA |
Thermic Ultramafic Foothills Moderately High Magnesium Content (Ca:Mg Ratio 0.5 To 2) Site relationships being developed. |
Table 1. Dominant plant species
| Tree |
(1) Pinus sabiniana |
|---|---|
| Shrub |
(1) Heteromeles arbutifolia |
| Herbaceous |
Not specified |
Physiographic features
This site is tentatively set up for ultramafic soils in the Red Hills area of CA630. This ecological site occurs on steep slopes (30 to 70%) on all aspects. The cooler aspects (north to west) where deeper soils exist have a distinctive community type favoring a more diverse mix of shrubs.
Table 2. Representative physiographic features
| Landforms |
(1)
Foothills
> Hill
(2) Foothills > Saddle |
|---|---|
| Runoff class | Medium |
| Flooding frequency | None |
| Ponding frequency | None |
| Elevation | 229 – 600 m |
| Slope | 30 – 70% |
| Ponding depth |
Not specified |
| Aspect | W, NW, N |
Table 3. Representative physiographic features (actual ranges)
| Runoff class | Medium |
|---|---|
| Flooding frequency | None |
| Ponding frequency | None |
| Elevation | 229 – 600 m |
| Slope | 30 – 70% |
| Ponding depth | Not specified |
Climatic features
This ecological site is a found in a broad Mediterranean climatic region, with hot, dry summers and cool, wet winters. Average annual precipitation ranges between 25 to 29 inches per year, mostly occurring between November and April in the form of rain. Mean annual temperature ranges between 50 and 74 degrees F. The frost free period is 234 to 332 days and the freeze-free period is approximately 258 to 300 days.
Table 4. Representative climatic features
| Frost-free period (characteristic range) | 234-332 days |
|---|---|
| Freeze-free period (characteristic range) | 365 days |
| Precipitation total (characteristic range) | 635-737 mm |
| Frost-free period (actual range) | 209-357 days |
| Freeze-free period (actual range) | 365 days |
| Precipitation total (actual range) | 610-762 mm |
| Frost-free period (average) | 283 days |
| Freeze-free period (average) | 365 days |
| Precipitation total (average) | 686 mm |
Figure 1. Monthly precipitation range
Figure 2. Monthly minimum temperature range
Figure 3. Monthly maximum temperature range
Figure 4. Monthly average minimum and maximum temperature
Figure 5. Annual precipitation pattern
Figure 6. Annual average temperature pattern
Climate stations used
-
(1) NEW MELONES DAM HQ [USC00046174], Angels Camp, CA
-
(2) CAMP PARDEE [USC00041428], Valley Springs, CA
Influencing water features
Due to the topographic position, this site does not have water features or wetlands.
Wetland description
N/A
Soil features
The soils in this ecological site are formed from the colluvium and residuum of serpentinite and other ultramafic rock. Soils are moderately deep and are loamy-skeletal in the particle size control section. Surface texture is extremely channery loam. The bedrock is a restrictive layer found between 26 and 35 inches of depth. Gravels (< 3 inch diameter) range between 10 to 20% cover, while larger fragments (= 3 inch diameter) cover 4 to 7% of the soil surface. Subsurface gravels range between 10 to 20% and larger fragments occupy 20 to 32% by volume. The soils in this ecological site are well drained and the permeability class is moderately rapid. Available Water Capacity (AWC) is between 3 and 4 inches and the soil reaction ranges from 5.6 to 7.3 throughout the profile.
The most common soil correlated to this ecological site is Crimeahouse (Loamy-skeletal, magnesic, thermic Mollic Haploxeralfs).
Table 5. Representative soil features
| Parent material |
(1)
Colluvium
–
ultramafic rock
(2) Residuum – ultramafic rock |
|---|---|
| Surface texture |
(1) Extremely channery loam |
| Drainage class | Well drained |
| Permeability class | Moderately rapid |
| Depth to restrictive layer | 66 – 89 cm |
| Soil depth | 66 – 89 cm |
| Surface fragment cover <=3" | 10 – 20% |
| Surface fragment cover >3" | 4 – 7% |
| Available water capacity (0-101.6cm) |
7.62 – 10.16 cm |
| Soil reaction (1:1 water) (0-25.4cm) |
5.6 – 7.3 |
| Subsurface fragment volume <=3" (0-101.6cm) |
10 – 20% |
| Subsurface fragment volume >3" (0-101.6cm) |
20 – 32% |
Table 6. Representative soil features (actual values)
| Drainage class | Well drained |
|---|---|
| Permeability class | Moderately rapid |
| Depth to restrictive layer | 51 – 99 cm |
| Soil depth | 51 – 99 cm |
| Surface fragment cover <=3" | 5 – 30% |
| Surface fragment cover >3" | 0 – 10% |
| Available water capacity (0-101.6cm) |
4.57 – 10.67 cm |
| Soil reaction (1:1 water) (0-25.4cm) |
5.5 – 7.5 |
| Subsurface fragment volume <=3" (0-101.6cm) |
5 – 25% |
| Subsurface fragment volume >3" (0-101.6cm) |
10 – 35% |
Ecological dynamics
The main controlling factor in soils forming in ultramafic parent material is the chemical composition. The overwhelming abundance of extractable Mg at the cation exchange sites (at the expense of extractable Ca (Brooks, 1987)) prevents many plants from establishing. In addition to very low Ca:Mg ratios, serpentinite, dunite, and perioditite contain elevated levels of heavy metals (Woodruff et al., 2009), Ni Mn, etc. The chemical composition is often heterogeneous in distribution, often due to subtle changes in geology, but also topographical differences. Some ultramafic soils include barren pockets of highly toxic soil, where no plants grow (see Lazarus et al., 2011). At the other extreme, one can find areas where the toxicity is minimal and occasional blue oaks (Quercus douglasii) have been observed within the area. Kruckeberg (1984) outlined vegetative response to ultramafic conditions: plants are 1) endemic to serpentine (restricted), 2) not restricted (e.g. local indicators), 3) indifferent to serpentine (Bodenvag), and 4) excluded from serpentine (e.g. blue oak).
Buckbrush (Ceanothus cuneatus) falls under the second category of local indicator. Lazarus et al. (2011) found that buckbrush growing in pots from barren serpentinite were able to avoid accumulation of magnesium and other toxic elements to a greater degree than several restricted herbaceous plants. Buckbrush often grows in the understory of adjacent blue oak sites, yet at much lower densities than what is found in R018XI102CA. Given, the ability to avoid heavy metal accumulation, buckbrush is the most common plant species in the Red Hills. Foothill pine, on the other hand is likely a Bodenvag or indifferent species. It also is found in adjacent ecosites, yet its productivity is roughly equal in both ultramafic and non-ultramafic sites alike.
Ultramafic soils have been thought to be refuges for native endemics as well as perennial bunchgrases (Kruckeburg, 1984; Huenneke, 1990) which might have been more abundant in the historical state. As might be expected, our field work did not yield many rare plants; the ones that we did encounter were in trace amounts.
State and transition model
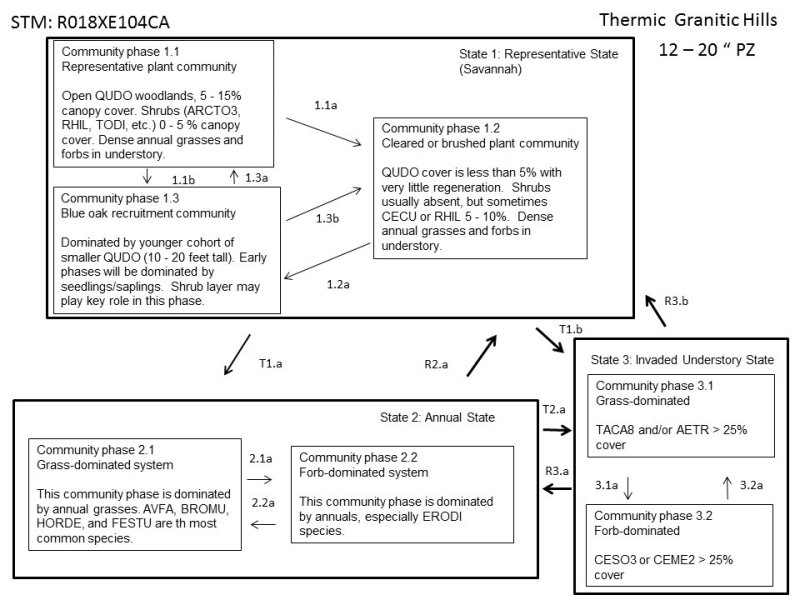
Figure 7. State and Transition Model
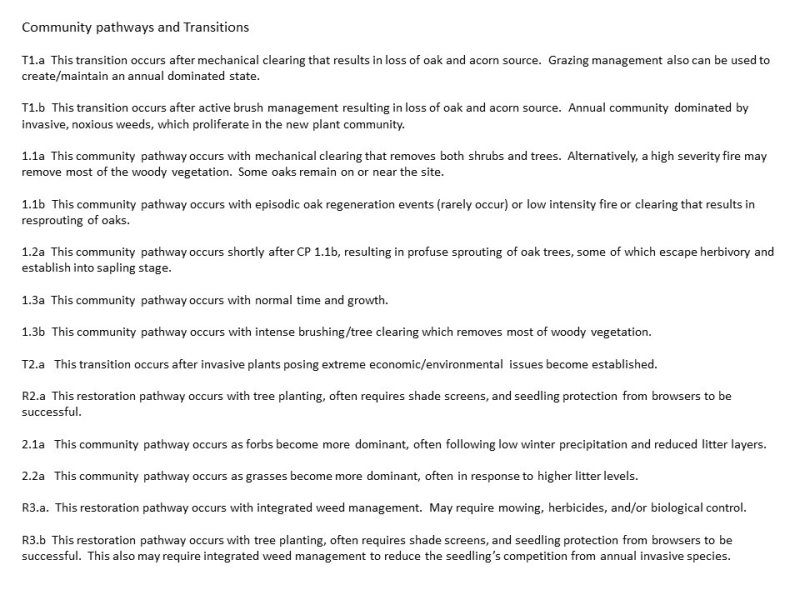
Figure 8. Community Pathways and Transitions (Pg.1 of 2).
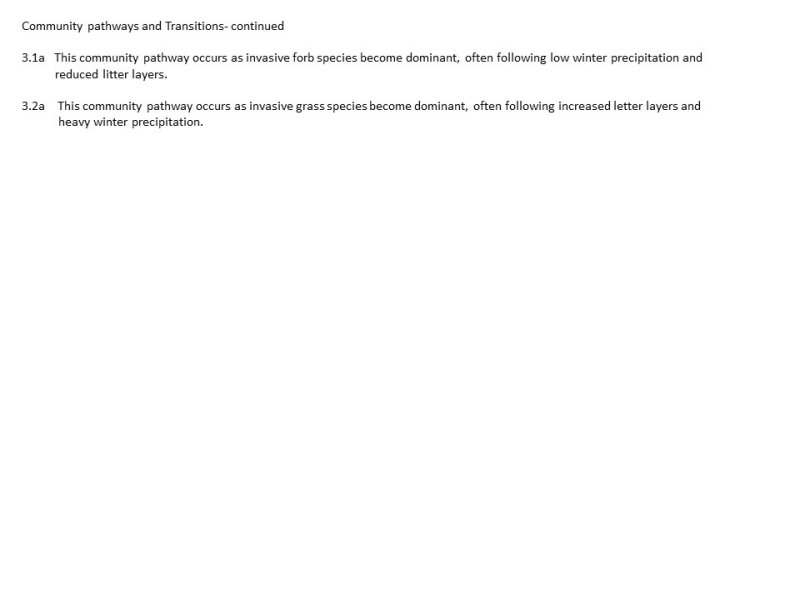
Figure 9. Community Pathways and Transitions (Pg. 2 of 2).
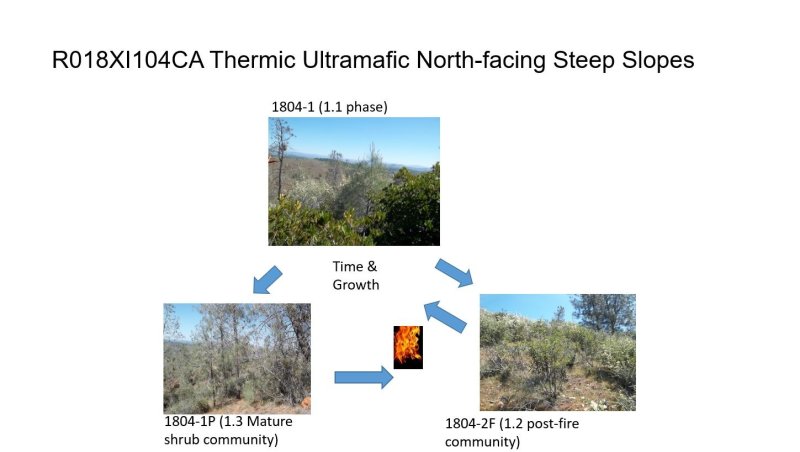
Figure 10. State 1 Community Phases with Photos
More interactive model formats are also available.
View Interactive Models
More interactive model formats are also available.
View Interactive Models
Click on state and transition labels to scroll to the respective text
Ecosystem states
State 1 submodel, plant communities
State 1
Reference State
State 1 represents the historic range of variability for this ecological site. This state no longer exists due to the ubiquitous naturalization of non-native species in the Sierra Nevada Foothills. Ultramafic soils often offer a refuge to many native endemic herbaceous species. Some of the endemics are still intact, but are growing scarce due to the onslaught of invasive annuals. Data for this State does not exist, but dynamics and composition would have been similar to State 2, except with only native species, especially forbs, present.
Community 1.1
Reference community

Figure 11. Time and Growth
Add narrative here
Figure 12. Annual production by plant type (representative values) or group (midpoint values)
Table 7. Annual production by plant type
| Plant type | Low (kg/hectare) |
Representative value (kg/hectare) |
High (kg/hectare) |
|---|---|---|---|
| Shrub/Vine | 76 | 187 | 302 |
| Grass/Grasslike | 7 | 103 | 221 |
| Forb | 19 | 113 | 175 |
| Tree | 6 | 22 | 45 |
| Total | 108 | 425 | 743 |
Table 8. Soil surface cover
| Tree basal cover | 0% |
|---|---|
| Shrub/vine/liana basal cover | 2-4% |
| Grass/grasslike basal cover | 0-1% |
| Forb basal cover | 0-1% |
| Non-vascular plants | 1-35% |
| Biological crusts | 0% |
| Litter | 42-60% |
| Surface fragments >0.25" and <=3" | 5-15% |
| Surface fragments >3" | 2-4% |
| Bedrock | 0-8% |
| Water | 0% |
| Bare ground | 4-9% |
Table 9. Woody ground cover
| Downed wood, fine-small (<0.40" diameter; 1-hour fuels) | 1-4% |
|---|---|
| Downed wood, fine-medium (0.40-0.99" diameter; 10-hour fuels) | 0-4% |
| Downed wood, fine-large (1.00-2.99" diameter; 100-hour fuels) | 1-3% |
| Downed wood, coarse-small (3.00-8.99" diameter; 1,000-hour fuels) | 1-3% |
| Downed wood, coarse-large (>9.00" diameter; 10,000-hour fuels) | 0-2% |
| Tree snags** (hard***) | – |
| Tree snags** (soft***) | – |
| Tree snag count** (hard***) | 0 per hectare |
| Tree snag count** (hard***) | 0 per hectare |
* Decomposition Classes: N - no or little integration with the soil surface; I - partial to nearly full integration with the soil surface.
** >10.16cm diameter at 1.3716m above ground and >1.8288m height--if less diameter OR height use applicable down wood type; for pinyon and juniper, use 0.3048m above ground.
*** Hard - tree is dead with most or all of bark intact; Soft - most of bark has sloughed off.
Table 10. Canopy structure (% cover)
| Height Above Ground (m) | Tree | Shrub/Vine | Grass/ Grasslike |
Forb |
|---|---|---|---|---|
| <0.15 | – | 0-1% | 0-2% | 1-20% |
| >0.15 <= 0.3 | 0-1% | 0-1% | 2-12% | 2-5% |
| >0.3 <= 0.6 | – | 1-5% | 1-4% | 2-8% |
| >0.6 <= 1.4 | – | 2-7% | 0-1% | – |
| >1.4 <= 4 | 0-1% | 6-45% | – | – |
| >4 <= 12 | 1-4% | – | – | – |
| >12 <= 24 | 0-20% | – | – | – |
| >24 <= 37 | – | – | – | – |
| >37 | – | – | – | – |
Figure 13. Plant community growth curve (percent production by month). CA1801, Buckbrush (Ceanothus cuneatus). Northern Sierra Nevada Foothills LRU.
| Jan | Feb | Mar | Apr | May | Jun | Jul | Aug | Sep | Oct | Nov | Dec |
|---|---|---|---|---|---|---|---|---|---|---|---|
| J | F | M | A | M | J | J | A | S | O | N | D |
| 0 | 5 | 25 | 35 | 20 | 10 | 5 | 0 | 0 | 0 | 0 | 0 |
Community 1.2
Post-fire plant community
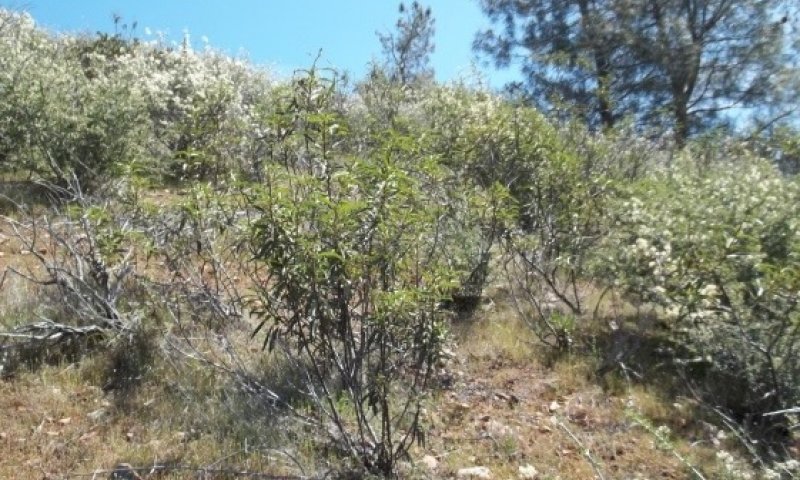
Figure 14. post-fire community
Add narrative here
Figure 15. Annual production by plant type (representative values) or group (midpoint values)
Table 11. Annual production by plant type
| Plant type | Low (kg/hectare) |
Representative value (kg/hectare) |
High (kg/hectare) |
|---|---|---|---|
| Shrub/Vine | 1 | 69 | 364 |
| Forb | – | 78 | 257 |
| Grass/Grasslike | – | 45 | 104 |
| Total | 1 | 192 | 725 |
Community 1.3
Mature shrub community
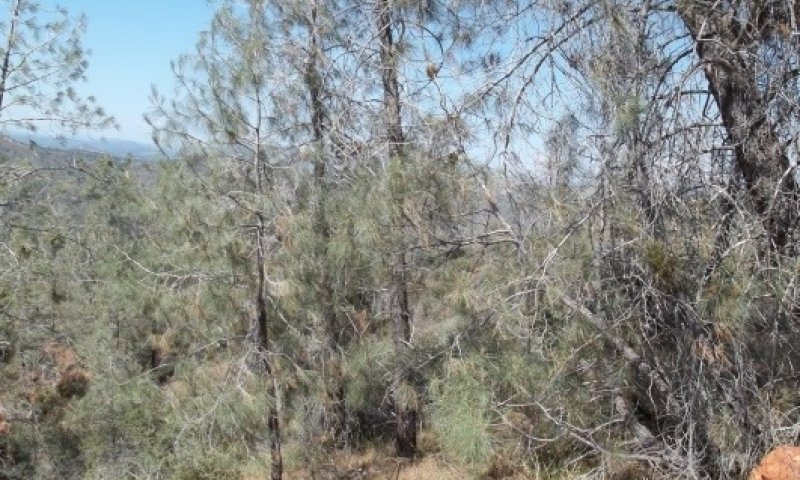
Figure 16. Mature shrub community
Add narrative here
Figure 17. Annual production by plant type (representative values) or group (midpoint values)
Table 12. Annual production by plant type
| Plant type | Low (kg/hectare) |
Representative value (kg/hectare) |
High (kg/hectare) |
|---|---|---|---|
| Tree | – | 84 | 185 |
| Grass/Grasslike | 2 | 95 | 160 |
| Shrub/Vine | 1 | 66 | 147 |
| Forb | – | 50 | 89 |
| Total | 3 | 295 | 581 |
Pathway 1.1a
Community 1.1 to 1.2


This community pathway occurs after a moderate to high severity burn.
Pathway 1.1b
Community 1.1 to 1.3


This community pathway occurs after a considerable amount of time without fire. Decadent shrub community with abundant fuel loading and higher density of foothill pine.
Pathway 1.2a
Community 1.2 to 1.1


This community pathway occurs over time with normal progression and without major disturbances.
Pathway 1.3a
Community 1.3 to 1.2


1.3a This community pathway occurs after a moderate to high severity burn.
Additional community tables
Table 13. Community 1.1 plant community composition
| Group | Common name | Symbol | Scientific name | Annual production (kg/hectare) | Foliar cover (%) | |
|---|---|---|---|---|---|---|
|
Tree
|
||||||
| 1 | Tree | 6–45 | ||||
| California foothill pine | PISA2 | Pinus sabiniana | 6–45 | 1–15 | ||
|
Shrub/Vine
|
||||||
| 2 | Shrubs | 69–187 | ||||
| buckbrush | CECU | Ceanothus cuneatus | 28–196 | 5–25 | ||
| toyon | HEAR5 | Heteromeles arbutifolia | 40–104 | 3–25 | ||
| whiteleaf manzanita | ARMA | Arctostaphylos manzanita | 28–67 | 1–7 | ||
| buckthorn | RHAMN | Rhamnus | 6–16 | 1–2 | ||
|
Grass/Grasslike
|
||||||
| 3 | Annual grasses | 3–112 | ||||
| purple false brome | BRDI2 | Brachypodium distachyon | 0–95 | 0–5 | ||
| soft brome | BRHO2 | Bromus hordeaceus | 1–11 | 1–13 | ||
| red brome | BRRU2 | Bromus rubens | 1–4 | 1–7 | ||
| 4 | Native grasses | 11–135 | ||||
| melicgrass | MELIC | Melica | 9–117 | 1–4 | ||
| Pacific fescue | VUMIP | Vulpia microstachys var. pauciflora | 1–67 | 1–4 | ||
| squirreltail | ELEL5 | Elymus elymoides | 3–22 | 1–4 | ||
|
Forb
|
||||||
| 5 | Forbs | 8–175 | ||||
| purple sanicle | SABI3 | Sanicula bipinnatifida | 24–67 | 1–3 | ||
| goldback fern | PETR7 | Pentagramma triangularis | 4–39 | 1–5 | ||
| bluedicks | DICA14 | Dichelostemma capitatum | 3–22 | 0–2 | ||
| red hills soap plant | CHGR3 | Chlorogalum grandiflorum | 0–18 | 0–2 | ||
| dotseed plantain | PLER3 | Plantago erecta | 4–10 | 1–5 | ||
| vinegarweed | TRLA4 | Trichostema lanceolatum | 0–9 | 0–2 | ||
| bedstraw | GALIU | Galium | 2–4 | 1–5 | ||
| California goldfields | LACA7 | Lasthenia californica | 1–4 | 2–5 | ||
Table 14. Community 1.2 plant community composition
| Group | Common name | Symbol | Scientific name | Annual production (kg/hectare) | Foliar cover (%) | |
|---|---|---|---|---|---|---|
|
Shrub/Vine
|
||||||
| 3 | Post-fire matrix shrub | 1–73 | ||||
| 4 | Cool-phase shrubs | 183–364 | ||||
| buckbrush | CECU | Ceanothus cuneatus | 84–185 | 20–40 | ||
| toyon | HEAR5 | Heteromeles arbutifolia | 99–174 | 2–10 | ||
| soft brome | BRHO2 | Bromus hordeaceus | 1–39 | 1–12 | ||
| red brome | BRRU2 | Bromus rubens | 1–17 | 1–7 | ||
| bluedicks | DICA14 | Dichelostemma capitatum | 3–17 | 0–2 | ||
| bedstraw | GALIU | Galium | 1–9 | 0–5 | ||
| California goldfields | LACA7 | Lasthenia californica | 1–6 | 0–2 | ||
| dotseed plantain | PLER3 | Plantago erecta | 1–6 | 1–2 | ||
| buckthorn | RHAMN | Rhamnus | 0–6 | 1–2 | ||
| goldback fern | PETR7 | Pentagramma triangularis | 0–4 | 0–1 | ||
| fescue | VULPI | Vulpia | 1–2 | 1–2 | ||
| purple sanicle | SABI3 | Sanicula bipinnatifida | 0–2 | 0–1 | ||
| annual agoseris | AGHE2 | Agoseris heterophylla | 0–1 | 0–1 | ||
| Indian paintbrush | CASTI2 | Castilleja | 0–1 | 0–1 | ||
| desertparsley | LOMAT | Lomatium | 0–1 | 0–1 | ||
|
Grass/Grasslike
|
||||||
| 3 | Post-fire matrix grasses | 0–104 | ||||
| 4 | Cool-phase grasses | 3–58 | ||||
|
Forb
|
||||||
| 3 | Post-fire matrix forb | 0–257 | ||||
| desertparsley | LOMAT | Lomatium | 0–112 | 0–10 | ||
| bluedicks | DICA14 | Dichelostemma capitatum | 0–84 | 10–13 | ||
| buckbrush | CECU | Ceanothus cuneatus | 1–73 | 8–35 | ||
| red brome | BRRU2 | Bromus rubens | 0–63 | 1–12 | ||
| vinegarweed | TRLA4 | Trichostema lanceolatum | 0–45 | 0–6 | ||
| soft brome | BRHO2 | Bromus hordeaceus | 1–37 | 0–20 | ||
| California goldfields | LACA7 | Lasthenia californica | 0–11 | 0–1 | ||
| fescue | VULPI | Vulpia | 0–2 | 1–15 | ||
| purple sanicle | SABI3 | Sanicula bipinnatifida | 0–2 | 2–8 | ||
| annual agoseris | AGHE2 | Agoseris heterophylla | 0–2 | 0–8 | ||
| squirreltail | ELEL5 | Elymus elymoides | 0–2 | 0–2 | ||
| 4 | Cool-phase forbs | 7–47 | ||||
Table 15. Community 1.3 plant community composition
| Group | Common name | Symbol | Scientific name | Annual production (kg/hectare) | Foliar cover (%) | |
|---|---|---|---|---|---|---|
|
Tree
|
||||||
| 5 | Decadent phase trees | 0–185 | ||||
|
Shrub/Vine
|
||||||
| 5 | Decadent phase shrubs | 1–147 | ||||
|
Forb
|
||||||
| 5 | Decadent phase forbs | 0–89 | ||||
Interpretations
Supporting information
Inventory data references
Inventory data to be collected using future projects based on priorities.
References
-
Natural Resources Conservation Service. . National Ecological Site Handbook.
Other references
Abrahamson, I. 2014. Arctostaphylos manzanita. In: Fire Effects Information System, [Online]. U.S. Department of Agriculture, Forest Service, Rocky Mountain Research Station, Fire Sciences Laboratory (Producer). Available: http://www.fs.fed.us/database/feis/
[2014, August 20].
Alexander, E. B. and J. Dushey. 2011. Topographic and soil differences from peridotite to serpentinite. Geomorphology 135:271-276.
Biswell, H. H. 1963. Research in wildland fire ecology in California. In: Proceedings, 2nd annual Tall Timbers fire ecology conference; 1963 March 14-15; Tallahassee, FL. No. 2. Tallahassee, FL: Tall Timbers Research Station: 63-97.
Brooks, R. 1987. Serpentine and its vegetation. Discorides Press: Portland, OR.
Cleland, D.T., Avers, P.E., McNab, W.H., Jensen, M.E., Bailey, R.G., and W.E. Russell. 1997. National hierarchical framework of ecological units. In: M.S. Boyce and A. Hanley, eds. Ecosystem Management: Applications for Sustainable Forest and Wildlife Resources. New Haven, CT. Yale University Press. Pp 181-200.
Delwiche, C. C., P. J. Zinke, and C. M. Johnson. 1965. Nitrogen fixation by ceanothus. Plant Pathology 40:1045-1047.
Eastwood, A. 1934. A revision of Arctostaphylos with key and descriptions. Leaflets of Western Botany 1(11):105-127.
Evans, R. A., H. H. Biswell, and D. E. Palmquist. 1987. Seed dispersal in Ceanothus cuneatus and C. leucodermis in a Sierran oak-woodland savanna. Madroño 34 (4): 282-293.
Gram, W., E. Borer, K. Cottingham, E. Seabloom, V. Bloucher, L. Goldwasser, F. Micheli, B. Kendall, and R. Burton. 2004. Distribution of plants in a California serpentine grassland: are rocky hummocks spatial refuges for native species? Plant Ecology 172:159-171.
Harrison, S., B. Inouye, and H. Safford. 2003. Ecological heterogeneity in the effects of grazing and fire on grassland diverstity. Conservation Biology 17:837-845.
Howard, J. L. 1992. Pinus sabiniana. In: Fire Effects Information System, [Online].
U.S. Department of Agriculture, Forest Service,
Rocky Mountain Research Station, Fire Sciences Laboratory (Producer).
Available: http://www.fs.fed.us/database/feis/ [2013, March 15].
Howard, J. L. 1998. Bromus hordeaceus. In: Fire Effects Information System, [Online].
U.S. Department of Agriculture, Forest Service,
Rocky Mountain Research Station, Fire Sciences Laboratory (Producer).
Available: http://www.fs.fed.us/database/feis/ [2013, April 9].
Huenneke, L., S. Hamburg, R. Koide, H. Mooney, and P. Vitousek. 1990. Effects of soil resources on plant invasion and community structure in Californian serpentine grassland ecology. Ecology 71:478-491.
Hufford, K. M., S. J. Mazer, and M. D. Camara. 2008. Local adaptation and effects of grazing among seedlings of two native California bunchgrass species: Implications for restoration. Restoration Ecology 16:56-69.
Hutchings, S. S. and G. Stewart. 1953. Increasing forage yields and sheep production on Intermountain winter ranges. Circular No. 925. Washington, DC: U.S. Department of Agriculture. 63 p.
Jackson, L. 1985. Ecological origins of California’s Mediterranean grasses. Journal of Biogeography 12:349-361.
Keeley, J. E. 1987. Role of fire in seed germination of woody taxa in California chaparral. Ecology 68(2): 434-443.
Keeley, J. E. 1990. The California valley grassland In: Schoenherr, A. Allan (ed.). Endangered plant communities of southern California: Proceedings of the 15th annual symposium; 1989 October 28, Fullerton, CA, Special Publication No. 3: Claremont, CA: Southern California Botanists 2-23.
Kruckeberg, A. R. 1984. California serpentines: flora, vegetation, geology, soils, and management problems. University of California Press: Berkeley and Los Angeles, CA.
Lawrence, G. E. 1966. Ecology of vertebrate animals in relation to chaparral fire in the Sierra Nevada foothills. Ecology 47(2): 278-291.
Lazarus, B. E., J. H. Richards, V. P. Claassen, R. E. O’Dell, and M. A. Ferrell. 2011. Species and specific plant-soil interactions influence plant distribution on serpentine soils. Plant and Soil 342:327-344.
League, K. R. 2005. Ceanothus cuneatus. In: Fire Effects Information System, [Online]. U.S. Department of Agriculture, Forest Service, Rocky Mountain Research Station, Fire Sciences Laboratory (Producer). Available: http://www.fs.fed.us/database/feis/ [2013, March 15].
McClaran, M.P. 1986. Age structure of Quercus douglasii in relation to livestock grazing and fire. Ph.D. Dissertation. Univ. of Calif., Berkeley. 119 pp.
McDonald, P. M. 1981. Adaptations of woody shrubs. In: Hobbs, S. D., Helgerson, O.T., eds. Reforestation of skeletal soils: Proceedings of a workshop. 1981 November 17-19. Medford & Corvallis, OR: Oregon State University, Forest Research Laboratory: 21-29.
McGahan, D. G., R. J. Southard, and V. P. Claassen. 2009. Plant-Available calcium varies widely in soils on serpentinite landscapes. Soil Science Society of America Journal 73:2087-2095.
McMurray, Nancy E. 1990. Heteromeles arbutifolia. In: Fire Effects Information System, [Online]. U.S. Department of Agriculture, Forest Service,
Rocky Mountain Research Station, Fire Sciences Laboratory (Producer).
Available: http://www.fs.fed.us/database/feis/ [2014, August 20].
McNab, W.H., Cleland, D.T., Freeouf, J.A., Keys, Jr., Nowacki, G.J., and C. A. Carpenter. 2007. Descriptions of ecological subregions: sections of the coterminous United States. GTR-WO-76B. [CD-ROM] Washington, DC. US. Dept. Agric., For. Serv. 80 pg.
NatureServe. 2015. NatureServe Explorer: An online encyclopedia of life [web application]. Version 7.1. NatureServe, Arlington, Virginia. Available http://explorer.natureserve.org. (Accessed: February 23, 2015).
Omernick, J. M., and G.E. Griffith. 2007. Ecoregions of the Coterminous United States: Evolution of a Hierarchical Spatial Framework.
Contributors
K. Moseley
Dallas Glass
Dave Evans
Nathan Roe
John Proctor
Approval
Kendra Moseley, 4/24/2024
Rangeland health reference sheet
Interpreting Indicators of Rangeland Health is a qualitative assessment protocol used to determine ecosystem condition based on benchmark characteristics described in the Reference Sheet. A suite of 17 (or more) indicators are typically considered in an assessment. The ecological site(s) representative of an assessment location must be known prior to applying the protocol and must be verified based on soils and climate. Current plant community cannot be used to identify the ecological site.
| Author(s)/participant(s) | |
|---|---|
| Contact for lead author | |
| Date | 11/22/2024 |
| Approved by | Kendra Moseley |
| Approval date | |
| Composition (Indicators 10 and 12) based on | Annual Production |
Indicators
-
Number and extent of rills:
-
Presence of water flow patterns:
-
Number and height of erosional pedestals or terracettes:
-
Bare ground from Ecological Site Description or other studies (rock, litter, lichen, moss, plant canopy are not bare ground):
-
Number of gullies and erosion associated with gullies:
-
Extent of wind scoured, blowouts and/or depositional areas:
-
Amount of litter movement (describe size and distance expected to travel):
-
Soil surface (top few mm) resistance to erosion (stability values are averages - most sites will show a range of values):
-
Soil surface structure and SOM content (include type of structure and A-horizon color and thickness):
-
Effect of community phase composition (relative proportion of different functional groups) and spatial distribution on infiltration and runoff:
-
Presence and thickness of compaction layer (usually none; describe soil profile features which may be mistaken for compaction on this site):
-
Functional/Structural Groups (list in order of descending dominance by above-ground annual-production or live foliar cover using symbols: >>, >, = to indicate much greater than, greater than, and equal to):
Dominant:
Sub-dominant:
Other:
Additional:
-
Amount of plant mortality and decadence (include which functional groups are expected to show mortality or decadence):
-
Average percent litter cover (%) and depth ( in):
-
Expected annual annual-production (this is TOTAL above-ground annual-production, not just forage annual-production):
-
Potential invasive (including noxious) species (native and non-native). List species which BOTH characterize degraded states and have the potential to become a dominant or co-dominant species on the ecological site if their future establishment and growth is not actively controlled by management interventions. Species that become dominant for only one to several years (e.g., short-term response to drought or wildfire) are not invasive plants. Note that unlike other indicators, we are describing what is NOT expected in the reference state for the ecological site:
-
Perennial plant reproductive capability:
Print Options
Sections
Font
Other
The Ecosystem Dynamics Interpretive Tool is an information system framework developed by the USDA-ARS Jornada Experimental Range, USDA Natural Resources Conservation Service, and New Mexico State University.
Click on box and path labels to scroll to the respective text.