Natural Resources
Conservation Service
Ecological site R030XC317AZ
Sandy Bottom 10-13" p.z.
Last updated: 10/21/2024
Accessed: 04/03/2026
General information
Provisional. A provisional ecological site description has undergone quality control and quality assurance review. It contains a working state and transition model and enough information to identify the ecological site.
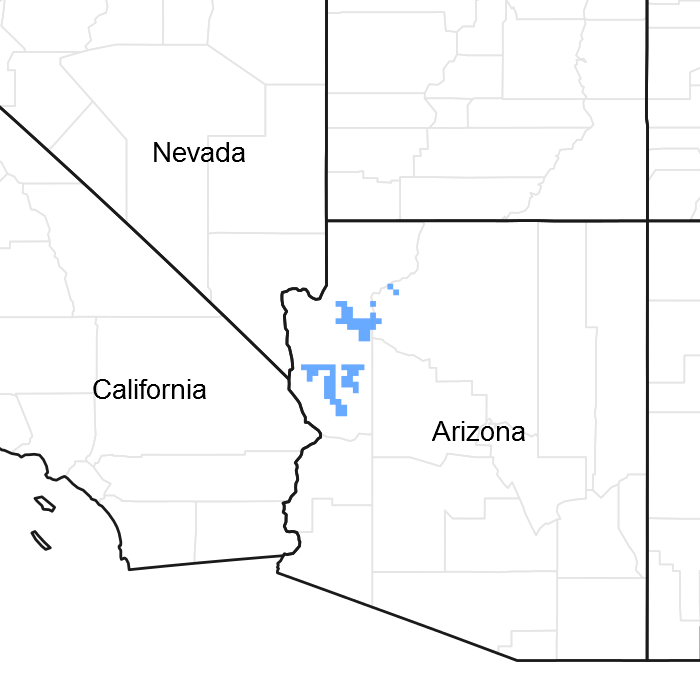
Figure 1. Mapped extent
Areas shown in blue indicate the maximum mapped extent of this ecological site. Other ecological sites likely occur within the highlighted areas. It is also possible for this ecological site to occur outside of highlighted areas if detailed soil survey has not been completed or recently updated.
MLRA notes
Major Land Resource Area (MLRA): 030X–Mojave Basin and Range
This unit occurs within the Basin and Range Province and is characterized by broad basins, valleys, and old lakebeds. Widely spaced mountains trending north to south occur throughout the area. Isolated, short mountain ranges are separated by an aggraded desert plain. The mountains are fault blocks that have been tilted up. Long alluvial fans coalesce with dry lakebeds between some of the ranges.
LRU notes
AZ LRU 30-3 – Upper Mohave Desert
Elevations range from 2800 to 4500 feet and precipitation averages 9 to 12 inches per year. Vegetation includes Joshua tree, blackbrush, creosotebush, ratany, bush muhly, big galleta, black grama, desert needlegrass, and Indian ricegrass. The soil temperature regime is thermic and the soil moisture regime is typic aridic.
Ecological site concept
This ecological site occurs in bottoms on narrow stream channels. Soils are deep sand, sandy loam to loamy sands throughout.
Similar sites
| R030XC322AZ |
Sandy Wash 10-13" p.z. |
|---|
Table 1. Dominant plant species
| Tree |
Not specified |
|---|---|
| Shrub |
(1) Acacia greggii |
| Herbaceous |
(1) Muhlenbergia porteri |
Physiographic features
This ecological site is found in a bottom position on narrow stream channels and low stream terraces of floodplains. It receives additional run-in moisture from surrounding ecological sites.
Table 2. Representative physiographic features
| Landforms |
(1)
Channel
(2) Stream terrace |
|---|---|
| Flooding frequency | Rare to occasional |
| Ponding frequency | Rare to occasional |
| Elevation | 2,200 – 4,600 ft |
| Slope | 1 – 3% |
| Aspect | Aspect is not a significant factor |
Climatic features
The climate is arid and warm. Annual precipitation ranges from 10 to 13 inches. About 65 percent of the rainfall comes from October through May as gentle rain from Pacific storms which may last for a couple of days. The rest of the rainfall comes during the summer monsoon season from July through September as spotty, brief, intense thunderstorms. Snow rarely falls, and only remains on the ground a few hours at most. Annual air temperature ranges from 46 to 76 degrees F. The average frost-free period ranges from 121 to 231 days.
Table 3. Representative climatic features
| Frost-free period (average) | 231 days |
|---|---|
| Freeze-free period (average) | 269 days |
| Precipitation total (average) | 13 in |
Figure 2. Monthly precipitation range
Figure 3. Monthly average minimum and maximum temperature
Influencing water features
Soil features
Soils are deep to very deep. Surface textures are very gravelly sand, sandy loam, and gravelly sandy loam. Subsoil textures are gravelly loamy coarse sand, very cobbly coarse sand, very gravelly coarse sand, extremely gravelly sand, very gravelly sand, gravelly sandy loam, loamy sand and sand.
Available water capacity is very low to low.
Erosion hazard by water is slight to severe; by wind is slight to moderate. Soils are non-saline, non-sodic with pH range of 7.4-8.4. Soil temperature regime is thermic; moisture regime is typic aridic.
Landform and position is narrow stream channels and low stream terraces of floodplains.
Soil mapping units include Hualapai SSA (Arizo), Central Mohave SSA (Arizo), and So. Mohave SSA (Arizo, Ireteba, and Franconia).
Table 4. Representative soil features
| Surface texture |
(1) Gravelly sand (2) Very cobbly sandy loam (3) Extremely gravelly |
|---|---|
| Family particle size |
(1) Sandy |
| Drainage class | Somewhat excessively drained to excessively drained |
| Permeability class | Moderately rapid to very rapid |
| Soil depth | 60 in |
| Surface fragment cover <=3" | 50 – 55% |
| Surface fragment cover >3" | 15% |
| Available water capacity (0-40in) |
2 – 2.5 in |
| Calcium carbonate equivalent (0-40in) |
5 – 10% |
| Electrical conductivity (0-40in) |
2 mmhos/cm |
| Soil reaction (1:1 water) (0-40in) |
7.4 – 8.4 |
| Subsurface fragment volume <=3" (Depth not specified) |
45 – 65% |
| Subsurface fragment volume >3" (Depth not specified) |
45% |
Ecological dynamics
Sandy Bottom, 10"-13" p.z., is a shrub dominated ecological site with occasional tree sized shrubs. Plant community recieves additional moisture from run-on events. A lush understory of perennial grasses, sub-shrubs and forbs is present. Annual forbs and grasses flourish following rainfall. Other than flash flooding, natural disturbances are rare. After introduction of non-native annuals (forbs and/or grasses), the shift in total productivity is shift increased seasonal herbaceous production following periods of rain. Dominant shrubs are creosote and white bursage. Assorted half-shrubs are widely scattered.
State and transition model
More interactive model formats are also available.
View Interactive Models
Click on state and transition labels to scroll to the respective text
State 1 submodel, plant communities
State 2 submodel, plant communities
State 1
Historic Climax Plant Community
Community 1.1
Historic Climax Plant Community
The dominant aspect of the site is a grassland-shrub mix. Dropseeds, big galleta and bush muhly are the major grasses. Shrubs include catclaw acacia, white burrobush, fourwing saltbush and Mexican bladdersage. This site floods often, which may result in a good annual grass and forb growth.
Figure 4. Annual production by plant type (representative values) or group (midpoint values)
Table 5. Annual production by plant type
| Plant type | Low (lb/acre) |
Representative value (lb/acre) |
High (lb/acre) |
|---|---|---|---|
| Grass/Grasslike | 141 | 275 | 545 |
| Shrub/Vine | 141 | 275 | 545 |
| Forb | 18 | 50 | 110 |
| Total | 300 | 600 | 1200 |
Table 6. Ground cover
| Tree foliar cover | 0% |
|---|---|
| Shrub/vine/liana foliar cover | 1-3% |
| Grass/grasslike foliar cover | 0-2% |
| Forb foliar cover | 0% |
| Non-vascular plants | 0% |
| Biological crusts | 0% |
| Litter | 0% |
| Surface fragments >0.25" and <=3" | 0% |
| Surface fragments >3" | 0% |
| Bedrock | 0% |
| Water | 0% |
| Bare ground | 0% |
Table 7. Canopy structure (% cover)
| Height Above Ground (ft) | Tree | Shrub/Vine | Grass/ Grasslike |
Forb |
|---|---|---|---|---|
| <0.5 | – | – | – | 0-2% |
| >0.5 <= 1 | – | – | 8-12% | – |
| >1 <= 2 | – | – | – | – |
| >2 <= 4.5 | – | 18-22% | – | – |
| >4.5 <= 13 | – | – | – | – |
| >13 <= 40 | – | – | – | – |
| >40 <= 80 | – | – | – | – |
| >80 <= 120 | – | – | – | – |
| >120 | – | – | – | – |
Figure 5. Plant community growth curve (percent production by month). AZ3024, 30.3 10-13" p.z. upland sites. Growth begins in the spring and continues through the summer..
| Jan | Feb | Mar | Apr | May | Jun | Jul | Aug | Sep | Oct | Nov | Dec |
|---|---|---|---|---|---|---|---|---|---|---|---|
| J | F | M | A | M | J | J | A | S | O | N | D |
| 0 | 1 | 8 | 18 | 18 | 11 | 14 | 20 | 8 | 2 | 0 | 0 |
State 2
Historic Native Plant Community plus Introduced Annuals
Community 2.1
Non-native Annuals
This plant community resembles the historic native plant community, but exotic annuals have been introduced. Non-native species include Asian mustard (Brassica tournefortii), red brome, Mediterranean grass (Schismus spp.), and filaree. The flourish of non-native annuals that occurs following rainfalls may preclude native annuals.
Transition T1A
State 1 to 2
Introduction of non-native annual forb and grass seed.
Additional community tables
Table 8. Community 1.1 plant community composition
| Group | Common name | Symbol | Scientific name | Annual production (lb/acre) | Foliar cover (%) | |
|---|---|---|---|---|---|---|
|
Grass/Grasslike
|
||||||
| 1 | 60–90 | |||||
| bush muhly | MUPO2 | Muhlenbergia porteri | 60–90 | – | ||
| 2 | 6–30 | |||||
| big galleta | PLRI3 | Pleuraphis rigida | 6–30 | – | ||
| 3 | 6–30 | |||||
| spike dropseed | SPCO4 | Sporobolus contractus | 6–30 | – | ||
| 4 | 6–30 | |||||
| sand dropseed | SPCR | Sporobolus cryptandrus | 6–30 | – | ||
| 5 | 6–30 | |||||
| mesa dropseed | SPFL2 | Sporobolus flexuosus | 6–30 | – | ||
| 6 | 6–30 | |||||
| black grama | BOER4 | Bouteloua eriopoda | 6–30 | – | ||
| 7 | 6–30 | |||||
| Indian ricegrass | ACHY | Achnatherum hymenoides | 6–30 | – | ||
| 8 | 0–12 | |||||
| low woollygrass | DAPU7 | Dasyochloa pulchella | 0–12 | – | ||
| 9 | 0–12 | |||||
| slim tridens | TRMU | Tridens muticus | 0–12 | – | ||
| 10 | 6–30 | |||||
| Grass, perennial | 2GP | Grass, perennial | 6–30 | – | ||
| 11 | 0–12 | |||||
| Grass, annual | 2GA | Grass, annual | 0–12 | – | ||
|
Forb
|
||||||
| 12 | 6–12 | |||||
| beardtongue | PENST | Penstemon | 6–12 | – | ||
| 13 | 6–12 | |||||
| desert trumpet | ERIN4 | Eriogonum inflatum | 6–12 | – | ||
| 14 | 6–30 | |||||
| Forb, perennial | 2FP | Forb, perennial | 6–30 | – | ||
| 15 | 0–12 | |||||
| Forb, annual | 2FA | Forb, annual | 0–12 | – | ||
|
Shrub/Vine
|
||||||
| 16 | 30–60 | |||||
| catclaw acacia | ACGR | Acacia greggii | 30–60 | – | ||
| 17 | 6–30 | |||||
| woolly fruit bur ragweed | AMER | Ambrosia eriocentra | 6–30 | – | ||
| 18 | 30–60 | |||||
| burrobrush | HYSA | Hymenoclea salsola | 30–60 | – | ||
| 19 | 6–30 | |||||
| fourwing saltbush | ATCA2 | Atriplex canescens | 6–30 | – | ||
| 20 | 6–30 | |||||
| Mexican bladdersage | SAME | Salazaria mexicana | 6–30 | – | ||
| 21 | 12–30 | |||||
| Nevada jointfir | EPNE | Ephedra nevadensis | 12–30 | – | ||
| 22 | 0–18 | |||||
| Mojave rabbitbrush | ERPA29 | Ericameria paniculata | 0–18 | – | ||
| 23 | 6–18 | |||||
| broom snakeweed | GUSA2 | Gutierrezia sarothrae | 6–18 | – | ||
| 24 | 6–18 | |||||
| banana yucca | YUBA | Yucca baccata | 6–18 | – | ||
| 25 | 6–12 | |||||
| tulip pricklypear | OPPH | Opuntia phaeacantha | 6–12 | – | ||
| 26 | 0–6 | |||||
| Whipple cholla | CYWH | Cylindropuntia whipplei | 0–6 | – | ||
| 27 | 6–12 | |||||
| buckhorn cholla | CYACM | Cylindropuntia acanthocarpa var. major | 6–12 | – | ||
| 28 | 0–12 | |||||
| creosote bush | LATR2 | Larrea tridentata | 0–12 | – | ||
| 29 | 0–12 | |||||
| water jacket | LYAN | Lycium andersonii | 0–12 | – | ||
| 30 | 0–12 | |||||
| desert willow | CHLI2 | Chilopsis linearis | 0–12 | – | ||
Interpretations
Supporting information
Contributors
Harmon Hodgkinson
Harmon S. Hodgkinson
Larry D. Ellicott
Stephen Cassady
Approval
Kendra Moseley, 10/21/2024
Rangeland health reference sheet
Interpreting Indicators of Rangeland Health is a qualitative assessment protocol used to determine ecosystem condition based on benchmark characteristics described in the Reference Sheet. A suite of 17 (or more) indicators are typically considered in an assessment. The ecological site(s) representative of an assessment location must be known prior to applying the protocol and must be verified based on soils and climate. Current plant community cannot be used to identify the ecological site.
| Author(s)/participant(s) | |
|---|---|
| Contact for lead author | |
| Date | 10/22/2024 |
| Approved by | Kendra Moseley |
| Approval date | |
| Composition (Indicators 10 and 12) based on | Annual Production |
Indicators
-
Number and extent of rills:
-
Presence of water flow patterns:
-
Number and height of erosional pedestals or terracettes:
-
Bare ground from Ecological Site Description or other studies (rock, litter, lichen, moss, plant canopy are not bare ground):
-
Number of gullies and erosion associated with gullies:
-
Extent of wind scoured, blowouts and/or depositional areas:
-
Amount of litter movement (describe size and distance expected to travel):
-
Soil surface (top few mm) resistance to erosion (stability values are averages - most sites will show a range of values):
-
Soil surface structure and SOM content (include type of structure and A-horizon color and thickness):
-
Effect of community phase composition (relative proportion of different functional groups) and spatial distribution on infiltration and runoff:
-
Presence and thickness of compaction layer (usually none; describe soil profile features which may be mistaken for compaction on this site):
-
Functional/Structural Groups (list in order of descending dominance by above-ground annual-production or live foliar cover using symbols: >>, >, = to indicate much greater than, greater than, and equal to):
Dominant:
Sub-dominant:
Other:
Additional:
-
Amount of plant mortality and decadence (include which functional groups are expected to show mortality or decadence):
-
Average percent litter cover (%) and depth ( in):
-
Expected annual annual-production (this is TOTAL above-ground annual-production, not just forage annual-production):
-
Potential invasive (including noxious) species (native and non-native). List species which BOTH characterize degraded states and have the potential to become a dominant or co-dominant species on the ecological site if their future establishment and growth is not actively controlled by management interventions. Species that become dominant for only one to several years (e.g., short-term response to drought or wildfire) are not invasive plants. Note that unlike other indicators, we are describing what is NOT expected in the reference state for the ecological site:
-
Perennial plant reproductive capability:
Print Options
Sections
Font
Other
The Ecosystem Dynamics Interpretive Tool is an information system framework developed by the USDA-ARS Jornada Experimental Range, USDA Natural Resources Conservation Service, and New Mexico State University.
Click on box and path labels to scroll to the respective text.