
Natural Resources
Conservation Service
Ecological site R042BB007NM
Gyp Outcrop, Desert Shrub
Accessed: 02/07/2026
General information
Provisional. A provisional ecological site description has undergone quality control and quality assurance review. It contains a working state and transition model and enough information to identify the ecological site.
Figure 1. Mapped extent
Areas shown in blue indicate the maximum mapped extent of this ecological site. Other ecological sites likely occur within the highlighted areas. It is also possible for this ecological site to occur outside of highlighted areas if detailed soil survey has not been completed or recently updated.
Associated sites
| R042BB006NM |
Gyp Upland, Desert Shrub Gyp outcrop occurs a low mounds/outcrops of gypsum scattered within gyp uplands |
|---|---|
| R042BB012NM |
Sandy, Desert Shrub Gyp Outcrop can occur interspersed withthin the interdunes of Sandy ecological sites. |
Table 1. Dominant plant species
| Tree |
Not specified |
|---|---|
| Shrub |
Not specified |
| Herbaceous |
Not specified |
Physiographic features
This site occurs as low mounds on relict lakebeds. As long linear relict stabilized dunes adjacent to old lakebeds, or as low mounds outcropping on basin floors and fan skirts. The soils formed from gypsiferous sandy wind blown material. Slopes range from 0-20 percent. Elevation ranges from 3800 to 4500 feet above sea level.
Table 2. Representative physiographic features
| Landforms |
(1)
Basin floor
(2) Lakebed (3) Terrace |
|---|---|
| Flooding frequency | None |
| Ponding frequency | None |
| Elevation | 3,800 – 4,500 ft |
| Slope | 5 – 20% |
| Aspect | Aspect is not a significant factor |
Climatic features
Annual average precipitation ranges from 7 to 12 inches. Wide fluctuations from year to year are common. At least one-half of the annual precipitation comes in the form of rainfall during July, August, and September. Precipitation in the form of snow or sleet averages less than 4 inches annually. The average annual air temperature is about 60 degree F. Summer maximums can exceed 100 degrees F. and winter minimums can go below zero. The average frost-free season exceeds 200 days and extends from April 1 to November 1. Both the temperature regime and rainfall distribution favor warm-season perennial plants on this site. Spring moisture conditions are only occasionally adequate to cause significant growth during this period of year. High winds from the west and southwest are common from March to June, which further tends to create poor soil moisture conditions in the springtime
Climate data was obtained from
http://www.wrcc.dri.edu/summary/climsmnm.html
Table 3. Representative climatic features
| Frost-free period (average) | 205 days |
|---|---|
| Freeze-free period (average) | 227 days |
| Precipitation total (average) | 12 in |
Figure 2. Monthly precipitation range
Figure 3. Monthly average minimum and maximum temperature
Influencing water features
This site is not influenced by water from wetlands or streams.
Soil features
The soils of this site typically occur as low mounds or linear stabilized dunes. Gypsum is present in high amounts (60-90 %) throughout the soil profile. The soils on these sites are overlain by high cover of dark colored biological crusts. Surface soils are typically white gypsiferous sand. Underlying layers are gypsiferous sand or sandy loam.
Characteristic soils include:
Peligro
Hermes
Corvus
Table 4. Representative soil features
| Surface texture |
(1) Gypsiferous sand (2) Gypsiferous loamy sand (3) Gypsiferous sandy loam |
|---|---|
| Family particle size |
(1) Sandy |
| Drainage class | Well drained |
| Permeability class | Moderate to moderately rapid |
| Soil depth | 10 – 60 in |
| Available water capacity (0-40in) |
2 – 5 in |
| Calcium carbonate equivalent (0-40in) |
5 – 8% |
| Electrical conductivity (0-40in) |
3 – 10 mmhos/cm |
| Sodium adsorption ratio (0-40in) |
4 |
| Soil reaction (1:1 water) (0-40in) |
7.5 – 8.3 |
Ecological dynamics
Overview:
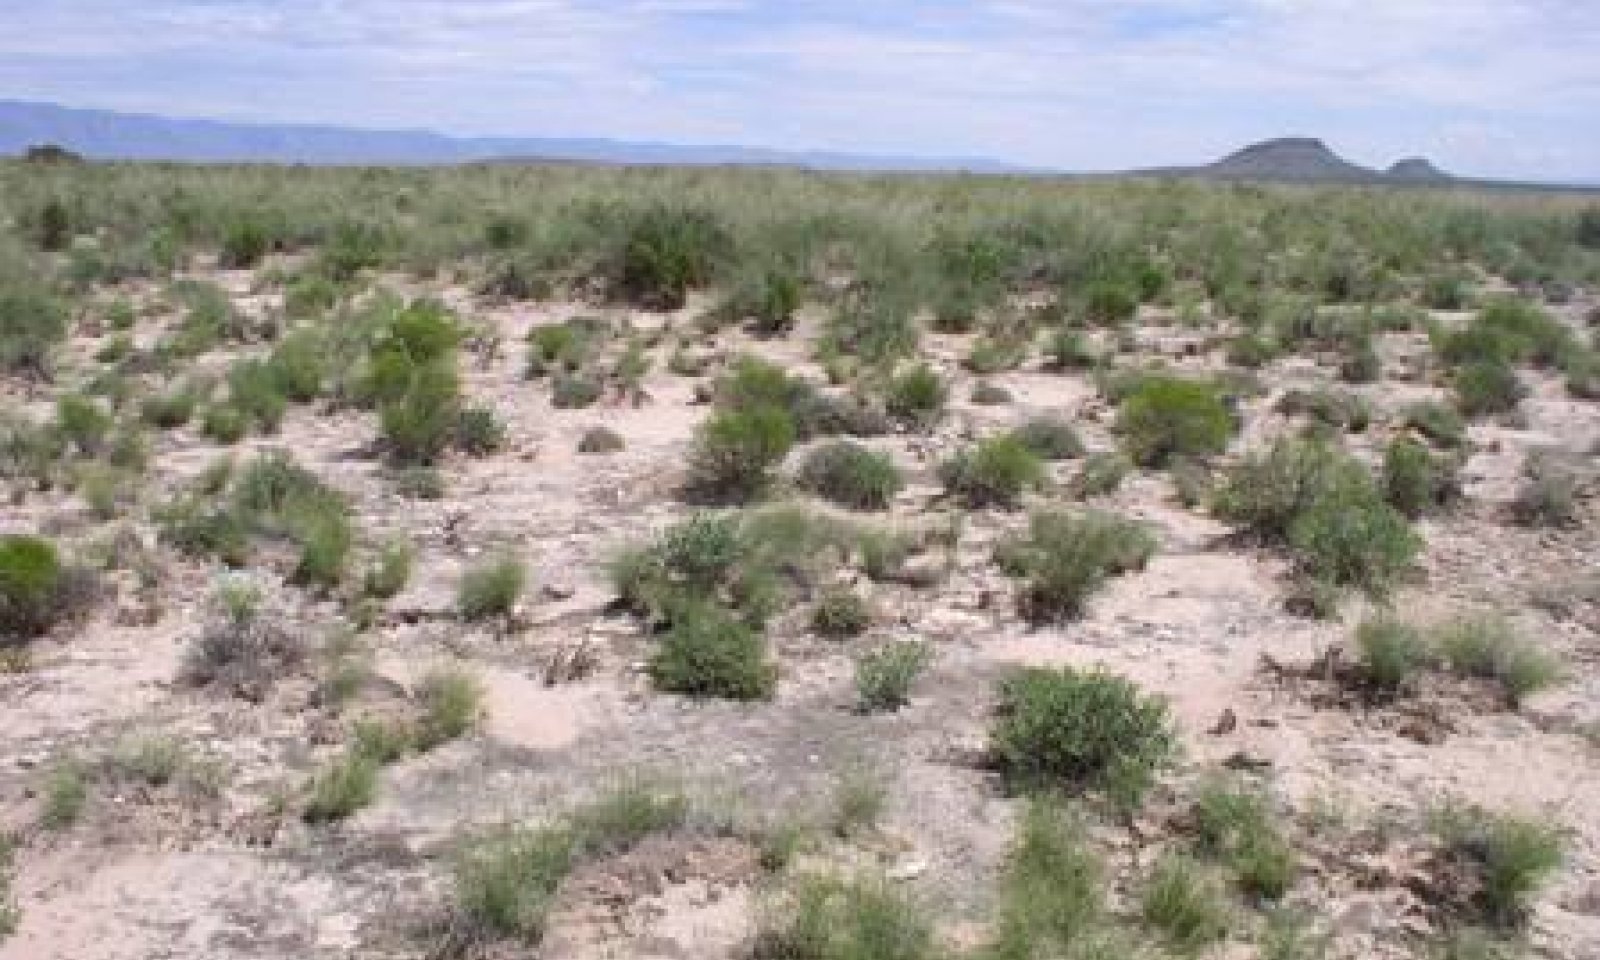
Gyp Outcrop occurs as low mounds or relict stabilized dunes with significant amounts of biological and physical crusting present on the surface. The physical crusts and the convex shape of the site limit infiltration and increase runoff contributing to low production and patchy vegetation. Gyp dropseed and hairy crinklemat are the dominant plants of the historic community. These sites are susceptible to erosion when plant cover is reduced due to overgrazing and drought. Over time,the loss of grass cover can shift the community to one dominated by shrubs. Accelerated erosion may eventually cause a state devoid of vegetation.
Gyp Outcrop is typically found interspersed within Gyp Upland sites. It can also occur in association with Loamy, Sandy, or Deep Sand sites.
State and transition model
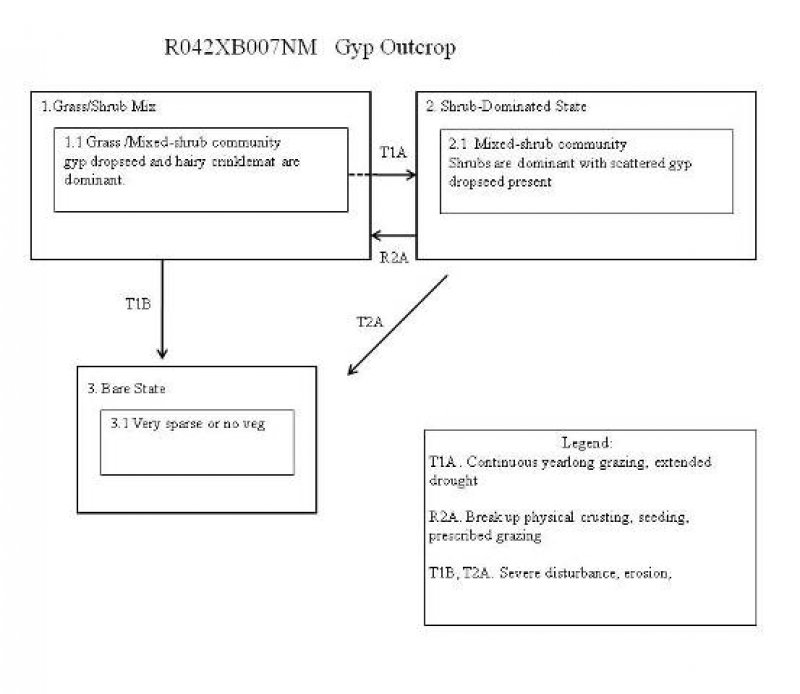
Figure 4. Gyp Outcrop model
More interactive model formats are also available.
View Interactive Models
More interactive model formats are also available.
View Interactive Models
Click on state and transition labels to scroll to the respective text
Ecosystem states
State 1 submodel, plant communities
State 2 submodel, plant communities
State 3 submodel, plant communities
State 1
Grass-Shrub Mix
This state is characterized by a patchy mosaic of grasses, sub-shrubs, and shrubs. Production is relatively low, and cover of biological and physical crusts is high.
Community 1.1
Grass/Mixed-shrub community

Figure 5. Grass/Mixed shrub
The Grass/Mixed shrub community is believed to be the historic plant community for this site. It is naturally a patchy mixture of grasses and shrubs dominated by gyp dropseed and hairy crinklemat. Torrey’s ephedra, fourwing saltbush, alkali sacaton, and gyp monopod are also commonly found on this site.
Figure 6. Annual production by plant type (representative values) or group (midpoint values)
Table 5. Annual production by plant type
| Plant type | Low (lb/acre) |
Representative value (lb/acre) |
High (lb/acre) |
|---|---|---|---|
| Shrub/Vine | 50 | 115 | 175 |
| Grass/Grasslike | 60 | 100 | 150 |
| Forb | 10 | 30 | 55 |
| Total | 120 | 245 | 380 |
Table 6. Ground cover
| Tree foliar cover | 0% |
|---|---|
| Shrub/vine/liana foliar cover | 5-10% |
| Grass/grasslike foliar cover | 5-25% |
| Forb foliar cover | 3-15% |
| Non-vascular plants | 0% |
| Biological crusts | 25-80% |
| Litter | 7-24% |
| Surface fragments >0.25" and <=3" | 0% |
| Surface fragments >3" | 0% |
| Bedrock | 0% |
| Water | 0% |
| Bare ground | 20-40% |
State 2
Shrub Dominated
This State is characterized by a decrease in grass cover resulting in dominance of the shrub component.
Community 2.1
Mixed Shrub community
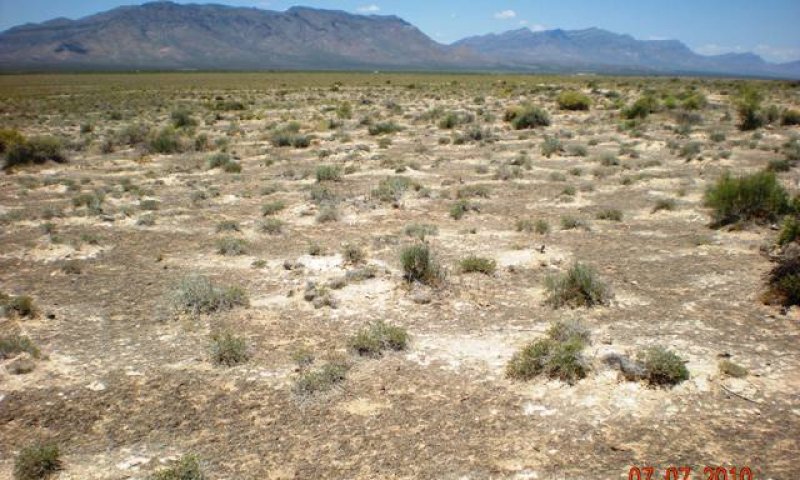
Figure 7. Mixed-Shrub community
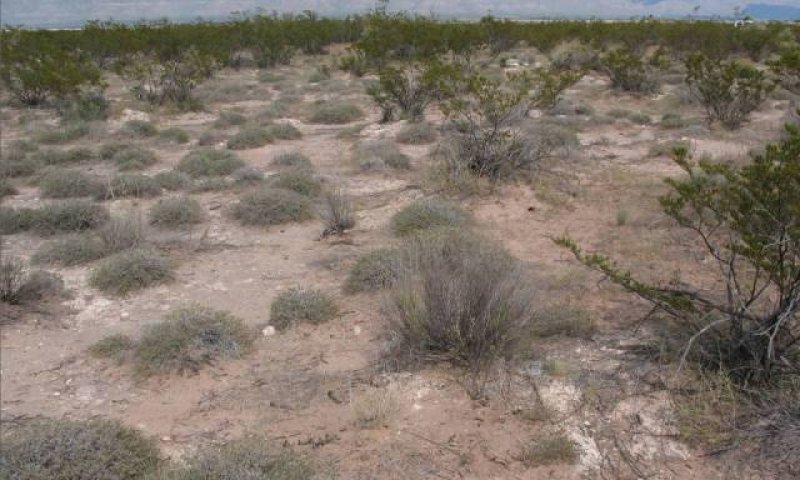
Figure 8. Mixed-Shrub w/creosotebush
This State is Characterized by a decrease in grass cover resulting in dominance of the shrub component. Hairy crinklemat is dominant with fourwing saltbush or Torrey’s ephedra typically occurring as sub-dominant. Occasionally creosotebush is present. This typically occurs where the soils of the site or adjacent sites contain calcium carbonate. Other important species include, gyp moon pod, stinging cevallia, and pitchfork, Grass cover is sparse usually consisting of scattered gyp dropseed. High cover of biological crusts helps to limit erosion and retain soil moisture. It is not known if they enhance or limit seedling establishment on these sites.
Figure 9. Annual production by plant type (representative values) or group (midpoint values)
Table 7. Annual production by plant type
| Plant type | Low (lb/acre) |
Representative value (lb/acre) |
High (lb/acre) |
|---|---|---|---|
| Shrub/Vine | 55 | 105 | 160 |
| Grass/Grasslike | 10 | 30 | 60 |
| Forb | 10 | 30 | 55 |
| Total | 75 | 165 | 275 |
State 3
Bare State
This State is characterized by a general lack of vegetation. Occasional small shrubs or grasses may be present. Biological crusts are highly reduced. This state is thought to occur as the result of accelerated erosion
Community 3.1
Barren
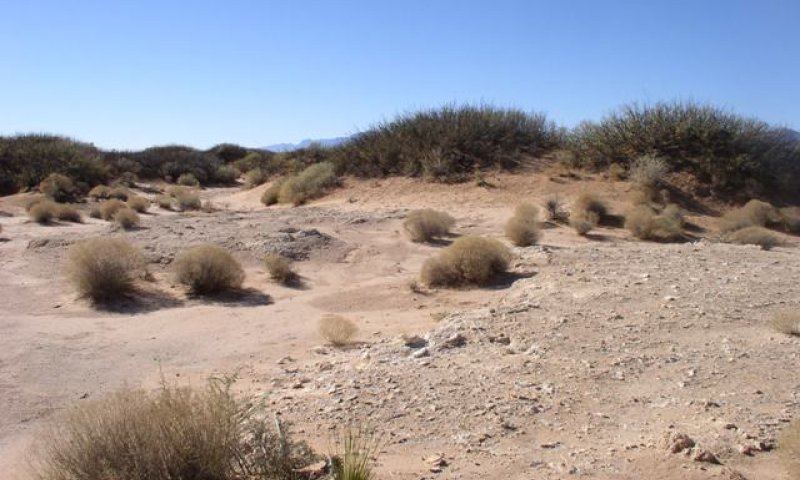
Figure 10. Barren
Transition T1A
State 1 to 2
Grass/Shrub Mix =>Shrub Dominated Transitions to a Shrub Dominated state may result from continuous heavy grazing pressure or periods of extended drought. These sites are naturally fragile and care should be taken not to overgraze.
Transition T1B
State 1 to 3
Grass/Shrub Mix=>Bare State. Transitions to a bare state are thought to happen in response to a severe disturbance and resulting accelerated erosion. The Bare State tends to occur most commonly on areas where the Gyp Outcrop is interspersed within degraded Sandy ecological sites.
Restoration pathway R2A
State 2 to 1
Shrub Dominated=>Grass/Shrub Restoring a good mix of grasses and shrubs on this site is difficult at best. Techniques that may assist include breaking up physical crusts on the soil surface, seeding, and a prescribed grazing plan that allows adequate rest following seeding. Success of seeding is limited by low average rainfall, high evaporation rate, physical crusting of surface soils, runoff on convex mounds, and continuous use by wildlife.
Transition T2A
State 2 to 3
Shrub-Dominated=>Bare State Transitions to a bare state are thought to happen in response to a severe disturbance and resulting accelerated erosion. The Bare State tends to occur most commonly on areas where the Gyp Outcrop is interspersed within degraded Sandy ecological sites.
Additional community tables
Table 8. Community 1.1 plant community composition
| Group | Common name | Symbol | Scientific name | Annual production (lb/acre) | Foliar cover (%) | |
|---|---|---|---|---|---|---|
|
Grass/Grasslike
|
||||||
| 1 | 50–100 | |||||
| gyp dropseed | SPNE | Sporobolus nealleyi | 50–100 | – | ||
| 2 | 5–25 | |||||
| alkali sacaton | SPAI | Sporobolus airoides | 5–25 | – | ||
| 3 | 2–10 | |||||
| nineawn pappusgrass | ENDE | Enneapogon desvauxii | 2–10 | – | ||
| 4 | Annual grasses | 3–15 | ||||
|
Shrub/Vine
|
||||||
| 5 | Sub shrub | 25–50 | ||||
| hairy crinklemat | TIHI | Tiquilia hispidissima | 25–50 | – | ||
| broom snakeweed | GUSA2 | Gutierrezia sarothrae | 0–3 | – | ||
| 6 | 15–50 | |||||
| Torrey's jointfir | EPTO | Ephedra torreyana | 15–50 | – | ||
| 7 | 15–50 | |||||
| fourwing saltbush | ATCA2 | Atriplex canescens | 15–50 | – | ||
| 8 | 0–15 | |||||
| crown of thorns | KOSP | Koeberlinia spinosa | 0–15 | – | ||
| 9 | 0–15 | |||||
| creosote bush | LATR2 | Larrea tridentata | 0–15 | – | ||
| 10 | Cacti | 0–3 | ||||
|
Forb
|
||||||
| 11 | Perennial | 5–25 | ||||
| lanceleaf moonpod | SELA3 | Selinocarpus lanceolatus | 3–25 | – | ||
| copper globemallow | SPAN3 | Sphaeralcea angustifolia | 0–18 | – | ||
| stinging serpent | CESI | Cevallia sinuata | 2–12 | – | ||
| pepperweed | LEPID | Lepidium | 0–10 | – | ||
| White Sands fanmustard | NELI | Nerisyrenia linearifolia | 0–3 | – | ||
| 12 | Annual | 5–30 | ||||
| pitchfork | DIPA3 | Dicranocarpus parviflorus | 5–20 | – | ||
| whitestem blazingstar | MEAL6 | Mentzelia albicaulis | 0–15 | – | ||
| gypsum phacelia | PHIN | Phacelia integrifolia | 3–15 | – | ||
| woolly tidestromia | TILA2 | Tidestromia lanuginosa | 0–10 | – | ||
| trailing windmills | ALIN | Allionia incarnata | 0–7 | – | ||
Table 9. Community 2.1 plant community composition
| Group | Common name | Symbol | Scientific name | Annual production (lb/acre) | Foliar cover (%) | |
|---|---|---|---|---|---|---|
|
Grass/Grasslike
|
||||||
| 1 | 5–35 | |||||
| gyp dropseed | SPNE | Sporobolus nealleyi | 5–35 | – | ||
| 2 | 3–15 | |||||
| nineawn pappusgrass | ENDE | Enneapogon desvauxii | 3–15 | – | ||
| 3 | Annual grasses | 2–10 | ||||
|
Shrub/Vine
|
||||||
| 4 | Sub shrub | 25–50 | ||||
| hairy crinklemat | TIHI | Tiquilia hispidissima | 25–50 | – | ||
| 5 | 15–50 | |||||
| Torrey's jointfir | EPTO | Ephedra torreyana | 15–50 | – | ||
| 6 | 15–50 | |||||
| fourwing saltbush | ATCA2 | Atriplex canescens | 15–50 | – | ||
| 7 | 0–10 | |||||
| crown of thorns | KOSP | Koeberlinia spinosa | 0–10 | – | ||
| 8 | 0–25 | |||||
| creosote bush | LATR2 | Larrea tridentata | 0–25 | – | ||
|
Forb
|
||||||
| 9 | Perennial | 6–25 | ||||
| lanceleaf moonpod | SELA3 | Selinocarpus lanceolatus | 3–12 | – | ||
| stinging serpent | CESI | Cevallia sinuata | 3–10 | – | ||
| pepperweed | LEPID | Lepidium | 0–10 | – | ||
| White Sands fanmustard | NELI | Nerisyrenia linearifolia | 0–5 | – | ||
| 10 | Annual | 5–30 | ||||
| pitchfork | DIPA3 | Dicranocarpus parviflorus | 5–20 | – | ||
| whitestem blazingstar | MEAL6 | Mentzelia albicaulis | 0–15 | – | ||
| gypsum phacelia | PHIN | Phacelia integrifolia | 3–15 | – | ||
| woolly tidestromia | TILA2 | Tidestromia lanuginosa | 0–15 | – | ||
| trailing windmills | ALIN | Allionia incarnata | 0–7 | – | ||
Interpretations
Animal community
This site provides habitat which support a resident animal community that is characterized by coyote, hooded skunk, desert cottontail, whitethroated woodrat, sparrow hawk, cactus wren, scaled quail, logggerhead shrike, mourning dove, Texas horned lizard, lesser earless lizard, and western diamondback rattlesnake. Fourwing saltbush, Torrey's ephedra, and wolfberry provide protective cover for scaled quail. Seed, green herbage and fruit from a variety of grasses, forbs and shrubs provide food for a number of birds and mammals, including scaled and Gambel’s quail, mourning dove and prairie dogs. The fruit of tesajo cactus is relished by quail.
Hydrological functions
The runoff curve numbers are determined by field investigations using hydraulic cover conditions and hydrologic soil groups.
Hydrologic Interpretations
Soil Series-------Hydrologic Group
Hermes---------
Peligro--------
Corvus---------
Recreational uses
This site by itself offers little value for recreation. It occurs as small mounds or outcrops of gypsum scattered throughout gyp uplands deep sand, or sandy sites. Collectively these mounds or outcrops can account for sizeable acreage, but individually they are usually small areas occupying less than 1/2 acre.
Wood products
This site has no significant value for wood products.
Other products
Gypsum
Supporting information
Contributors
David Trujillo
Rangeland health reference sheet
Interpreting Indicators of Rangeland Health is a qualitative assessment protocol used to determine ecosystem condition based on benchmark characteristics described in the Reference Sheet. A suite of 17 (or more) indicators are typically considered in an assessment. The ecological site(s) representative of an assessment location must be known prior to applying the protocol and must be verified based on soils and climate. Current plant community cannot be used to identify the ecological site.
| Author(s)/participant(s) | |
|---|---|
| Contact for lead author | |
| Date | |
| Approved by | |
| Approval date | |
| Composition (Indicators 10 and 12) based on | Annual Production |
Indicators
-
Number and extent of rills:
-
Presence of water flow patterns:
-
Number and height of erosional pedestals or terracettes:
-
Bare ground from Ecological Site Description or other studies (rock, litter, lichen, moss, plant canopy are not bare ground):
-
Number of gullies and erosion associated with gullies:
-
Extent of wind scoured, blowouts and/or depositional areas:
-
Amount of litter movement (describe size and distance expected to travel):
-
Soil surface (top few mm) resistance to erosion (stability values are averages - most sites will show a range of values):
-
Soil surface structure and SOM content (include type of structure and A-horizon color and thickness):
-
Effect of community phase composition (relative proportion of different functional groups) and spatial distribution on infiltration and runoff:
-
Presence and thickness of compaction layer (usually none; describe soil profile features which may be mistaken for compaction on this site):
-
Functional/Structural Groups (list in order of descending dominance by above-ground annual-production or live foliar cover using symbols: >>, >, = to indicate much greater than, greater than, and equal to):
Dominant:
Sub-dominant:
Other:
Additional:
-
Amount of plant mortality and decadence (include which functional groups are expected to show mortality or decadence):
-
Average percent litter cover (%) and depth ( in):
-
Expected annual annual-production (this is TOTAL above-ground annual-production, not just forage annual-production):
-
Potential invasive (including noxious) species (native and non-native). List species which BOTH characterize degraded states and have the potential to become a dominant or co-dominant species on the ecological site if their future establishment and growth is not actively controlled by management interventions. Species that become dominant for only one to several years (e.g., short-term response to drought or wildfire) are not invasive plants. Note that unlike other indicators, we are describing what is NOT expected in the reference state for the ecological site:
-
Perennial plant reproductive capability:
Print Options
Sections
Font
Other
The Ecosystem Dynamics Interpretive Tool is an information system framework developed by the USDA-ARS Jornada Experimental Range, USDA Natural Resources Conservation Service, and New Mexico State University.
Click on box and path labels to scroll to the respective text.