Provisional. A provisional ecological site description has undergone quality control and quality assurance review. It contains a working state and transition model and enough information to identify the ecological site.
MLRA notes
Major Land Resource Area (MLRA): 043B–Central Rocky Mountains
43B – Central Rocky Mountains – The Central Rocky Mountains extends from northern Montana to southern extent of Wyoming and from Idaho to central Wyoming. The southern extent of 43B is comprised of a combination of metamorphic, igneous, and sedimentary mountains and foothills. Climatic changes across this extent are broad and create several unique breaks in the landscape.
Further information regarding MLRAs, refer to: United States Department of Agriculture, Natural Resources Conservation Service. 2006. Land Resource Regions and Major Land Resource Areas of the United States, the Caribbean, and the Pacific Basin. U.S. Department of Agriculture Handbook 296.
Available electronically at: http://www.nrcs.usda.gov/wps/portal/nrcs/detail/soils/ref/?cid=nrcs142p2_053624#handbook.
LRU notes
Land Resource Unit (LRU) 43B23A: Absaroka Lower Foothills
Based on the shifts in geology, precipitation patterns and other climatic factors, as well as elevations and vegetation, the Absaroka Range was divided into LRU 23. Further division of this LRU is necessary due to the gradient moving from the foothills to the summit, as well as aspect shifts (north/east face versus south/west face). Subset A is set for the lower elevations within the foothills with 10 to 14 inches of precipitation. To verify or identify the LRU A (the referenced LRU for this ecological site), refer to the Wyoming LRU matrix key contained within the Ecological Site Key. This particular LRU occurs along the eastern lower foothills of the Absaroka Range. This LRU starts north of Clark, WY and runs to the Thermopolis, WY area. Once the foothills cross into the Northern Beartooth Range, the climatic patterns and elevational changes shifts the plant community and allows for a break in LRU's near the Montana state line. As the LRU follows to the south and tracks east with the intersection of the Absaroka and Owl Creek Ranges, the face changes aspect and geology creating a shift in plant dynamics and a break in the LRU. The extent of soils currently correlated to this ecological site does not fit within the digitized boundary. Many of the noted soils are provisional and will be reviewed and corrected in mapping update projects. Other map units are correlated as small inclusions within other MLRA’s/LRU’s based on elevation, landform, and biological references.
Moisture Regime: Aridic Ustic or Ustic Aridic – Progressive Initial mapping has shown that soil correlations completed prior to 2014 were identified as ustic aridic, after further evaluation of climatic and soil taxonomy information the proper moisture regime is aridic ustic. Both are recorded here until an update project is completed to correct the previous correlations.
Temperature Regime: Frigid
Dominant Cover: Rangeland – Sagebrush Steppe (major species is Wyoming Big Sagebrush)
Representative Value (RV) Effective Precipitation: 10-14 inches (254 – 355 mm)
RV Frost-Free Days: 80-110 days
Classification relationships
Relationship to Other Established Classification Systems:
National Vegetation Classification System (NVC):
3 Xeromorphic Woodland, Scrub & Herb Vegetation Class
3.B Cool Semi-Desert Scrub & Grassland Subclass
3.B.1 Cool Semi-Desert Scrub & Grassland formation
3.B.1.NE Western North American Cool Semi-Desert Scrub & Grassland Division
M169 Great Basin & Intermountain Tall Sagebrush Shrubland & Steppe Macrogroup
G302 Artemisia Tridentata - Artemisia tripartita - Purshia tridentata Big Sagebrush Steppe Group
Ecoregions (EPA):
Level I: 10 North American Deserts Level II: 10.1 Cold Deserts
Level III: 10.1.18 Wyoming Basin
Level IV: 10.1.18.b Big Horn Basin and
10.1.18.d Foothills and Low Mountains
Ecological site concept
• Site receives no additional water.
• Slope is <30%
• Soils are:
o Moderately deep to very deep (<20-80+ in. (50-200+ cm)
o Not skeletal (<35% rock fragments) within 20” (50 cm) of mineral soil surface
o None to Slightly effervescent throughout top 20” (50 cm) of mineral soil surface
o Non-saline, sodic, or saline-sodic
o Textures range from sandy clay loam to clay in top 4” (10 cm) of mineral soil surface
o Clay content is < 35% in top 4” (10 cm) of mineral soil surface
o All subsurface horizons in the particle size control section have a weighted average of ≥ 40% clay. (The particle size control section is the segment of the profile from either the start of an argillic horizon for 50 cm’s or from 25-100 cm’s).
The Dense Clay ecological site is based on heavy clay soils that develop large cracks at the surface when dry. Site has a thin cap of coarser soils on the surface. This community is dominated by birdfoot sagebrush and generally lacks Wyoming big sagebrush.
Clayey ecological site does not have the abrupt clay increase and cracking to inhibit plant growth. It generally occurs on around isolated patches of Dense Clay communities.
Saline Lowland Drained ecological sites will occur in close proximity and interspersed with Dense Clay along the toe-slopes of benches and on stream terraces.
The Dense Clay ecological site will usually occur in lower landscape position, on flat to moderately sloping land. It is found on all exposures. Slopes are mostly 5 to 30 percent.
Table 2. Representative physiographic features
Landforms
(1) Foothills > Fan apron (2) Foothills > Fan remnant (3) Foothills > Colluvial apron
Runoff class
Medium to very high
Ponding duration
Brief (2 to 7 days)
Ponding frequency
None to occasional
Elevation
4,500–6,600 ft
Slope
30%
Aspect
Aspect is not a significant factor
Climatic features
Annual precipitation and modeled relative effective annual precipitation ranges from 10 to 14 inches (254 – 355 mm). The normal precipitation pattern shows peaks in May and June and a secondary peak in September. This amounts to about 50 percent of the mean annual precipitation. Much of the moisture that falls in the latter part of the summer is lost by evaporation and much of the moisture that falls during the winter is lost by sublimation. Average snowfall is about 20 inches annually. Wide fluctuations may occur in yearly precipitation and result in more dry years than those with more than normal precipitation.
Temperatures show a wide range between summer and winter and between daily maximums and minimums, due to the high elevation and dry air, which permits rapid incoming and outgoing radiation. Cold air outbreaks from Canada in winter move rapidly from northwest to southeast and account for extreme minimum temperatures. Chinook winds may occur in winter and bring rapid rises in temperature. Extreme storms may occur during the winter, but most severely affect ranch operations during late winter and spring. High winds are generally blocked from the basin by high mountains, but can occur in conjunction with an occasional thunderstorm. Growth of native cool-season plants begins about April 15 and continues until about July 1. Cool weather and moisture in September may produce some green up of cool season plants that will continue through late October.
Review of a 30 year trend of data for Average Temperature as well as Average Precipitation, there has been a warming trend, but as the last 12 years graphed, the temperatures have swayed high and low, but overall it has maintained a steady trajectory, neither increasing nor decreasing. Where on the moisture side, the trajectory in trend has been a slow decline. The swings of when spring warm up and first frost hit with the decline in average precipitation have produced a drought effect where the moisture is not being received when the plants and ground is able to utilize the moisture. And in some cases, the late precipitation has encouraged the warm season or mat forming species over the cool season bunchgrasses that are the drivers of the natural system. Early frosts, with dry open winters has created a more arid or desert effect on plants resulting in high rates of winter kill, loss of vigor or overall damage to the plant.
For detailed information visit the Natural Resources Conservation Service National Water and Climate Center at http://www.wcc.nrcs.usda.gov/. “Buffalo Bill Dam", "Cody 21SW", "Thermopolis", "Thermopolis 9NE", "Thermopolis 25WNW" and "Wapiti 1NE" are the representative weather stations within LRU D. The following graphs and charts are a collective sample representing the averaged normals and 30 year annual rainfall data for the selected weather stations from 1981 to 2010.
Table 3. Representative climatic features
Frost-free period (characteristic range)
64-106 days
Freeze-free period (characteristic range)
101-144 days
Precipitation total (characteristic range)
11-12 in
Frost-free period (actual range)
46-118 days
Freeze-free period (actual range)
88-147 days
Precipitation total (actual range)
10-13 in
Frost-free period (average)
80 days
Freeze-free period (average)
117 days
Precipitation total (average)
12 in
Characteristic range
Actual range
Bar
Line
Figure 1. Monthly precipitation range
Characteristic range
Actual range
Bar
Line
Figure 2. Monthly minimum temperature range
Characteristic range
Actual range
Bar
Line
Figure 3. Monthly maximum temperature range
Bar
Line
Figure 4. Monthly average minimum and maximum temperature
The characteristics of these upland soils have no influence from ground water (water table below 60 inches (150 cm)) and have minimal influence from surface water/overland flow. Periods of ponding during storm events may occur, but have little to no effect on the vegetation of the site. Water restriction and movement off site are the key drivers of the vegetation, creating a dry or droughty appearance.
Soil features
The soils of this site are very shallow (less than 10 inches) to very deep, well to poorly drained soils formed in alluvium or alluvium over residuum. Layers of the soil most influential to the plant community varies from 3 to 6 inches thick. These soils have slow to very slow permeability. The topsoil, except for thin ineffectual layers, will be heavy clays and/or soils that develop large cracks when dry and are very sticky when wet. These sites typically have moderate saline and /or alkaline soils, but high amounts of soluble salt can occur. The soil characteristics having the most influence on plants are the very slow infiltration rate, which reduces the available moisture, and the amount of soluble salts.
Table 4. Representative soil features
Parent material
(1) Slope alluvium–sedimentary rock (2) Residuum–sedimentary rock
Surface texture
(1) Clay
(2) Silty clay
(3) Sandy clay loam
(4) Clay loam
Drainage class
Poorly drained to well drained
Permeability class
Very slow to slow
Soil depth
1–60 in
Available water capacity (0-40in)
0.56–6.3 in
Calcium carbonate equivalent (0-40in)
15%
Electrical conductivity (0-40in)
18 mmhos/cm
Sodium adsorption ratio (0-40in)
30
Soil reaction (1:1 water) (0-40in)
7.9–11
Ecological dynamics
These plant communities narratives do not represent every possibility, but they capture the most prevalent and repeatable plant communities. As data is collected, plant communities may be revised, removed, or new communities may be added. None of these plant communities should necessarily be thought of as “Desired Plant Communities”. According to the USDA NRCS National Range and Pasture Handbook, Desired Plant Communities (DPC’s) will be determined by the decision-makers and will meet minimum quality criteria established by the NRCS. The main purpose for including any description of a plant community here is to capture the current knowledge and experience at the time of this revision.
Potential vegetation on the Dense Clay ecological site is dominated by drought resistant, mid-stature cool-season perennial grasses and shrubs. The expected potential composition for this site is 50% grasses, 10% forbs and 40% woody plants. The composition and production will vary naturally due to historical use and fluctuating precipitation.
As this site deteriorates, species such as Sandberg bluegrass and birdfoot sagebrush will increase. Plains pricklypear and weedy annuals will invade. Cool season grasses such as rhizomatous wheatgrass, bottlebrush squirreltail, and Indian ricegrass will decrease in frequency and production.
The reference Plant Community (description follows the plant community diagram) has been determined by study of rangeland relic areas, or areas protected from excessive disturbance. Trends in plant communities going from heavily grazed areas to lightly grazed areas, seasonal use pastures, and historical accounts have also been used.
The following is a State and Transition Model Diagram that illustrates the common plant communities (states) that can occur on the site and the transitions between these communities. The ecological processes will be discussed in more detail in the plant community narratives following the diagram.
State and transition model
More interactive model formats are also available.
View Interactive Models
Click on state and transition labels to scroll to the respective text
Frequent and severe use is the driver of this transtion.
T1B
-
Drought alone or with other surface disturbances, including grazing, with a seed source present will force this transition.
R2A
-
Long-term prescribed grazing will convert this community phase.
T2A
-
Repeated extensive use by recreational traffic, livestock or others with seed sources present leave this state at risk of transitioning to the Invaded State.
R3A
-
Seeding, soil amendments, weed control and prescribed grazing will aid in recovery of this site.
T4A
-
Drought alone or with other surface disturbances, including grazing, with a seed source present will force this transition.
State 1 Rhizomatous Wheatgrasses/Birdfoot Sagebrush
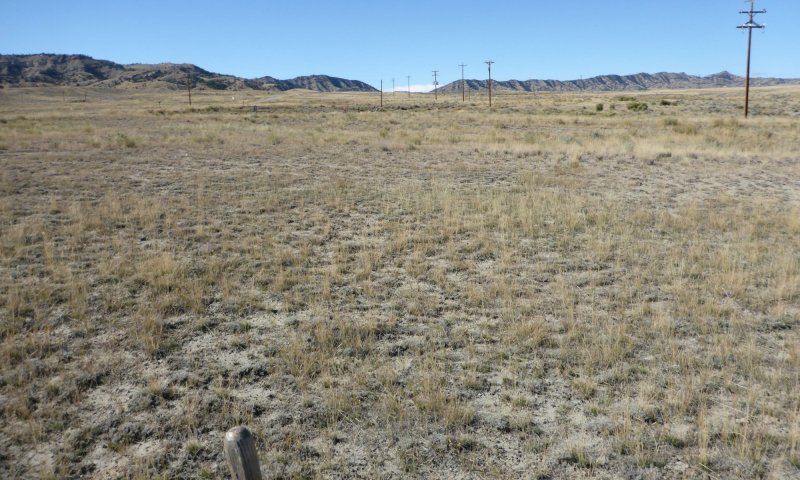
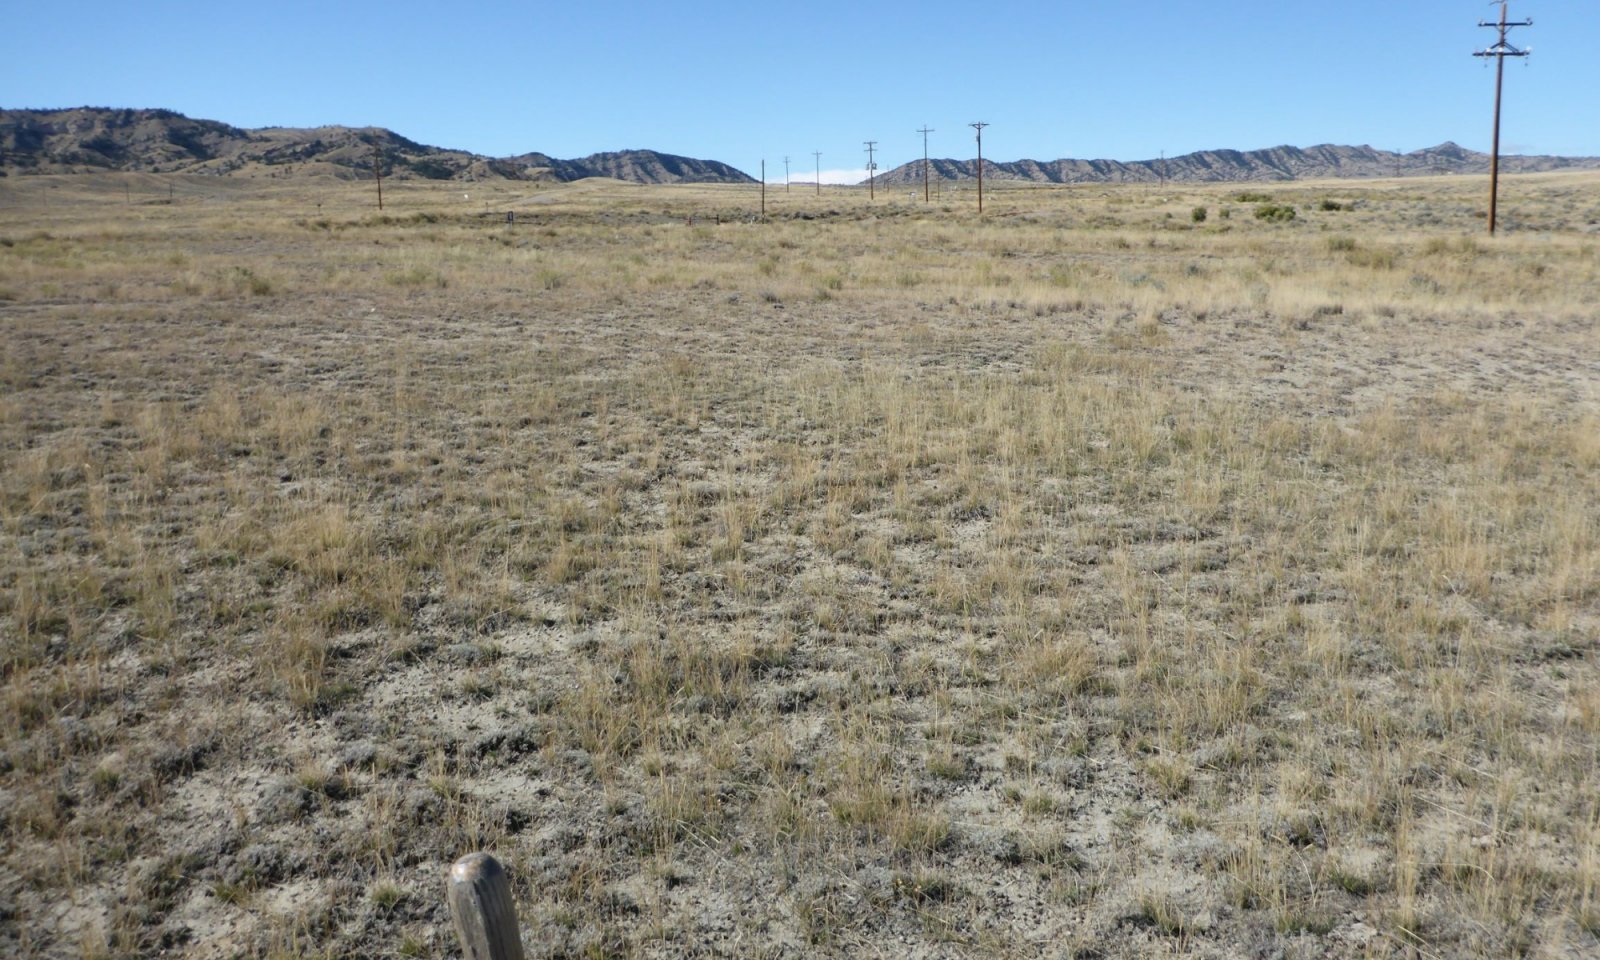
Figure 7. During a drought, the tolerant perennial grasses persist with birdfoot sagebrush.
The Dense Clay ecological site is generally small on the landscape, but is also very distinct with the low vegetative profile. This birdfoot sagebrush dominated site is prominently displayed in a patchwork with Wyoming big sagebrush of neighboring ecological sites. The herbaceous cover consists of a mixture of mid-stature and short-stature cool-season bunchgrasses and rhizomatous grasses.
Characteristics and indicators. A diverse mixture of key perennial grasses, forbs and the dominant birdfoot sagebrush is the key characteristic of this State.
Resilience management. The vegetation of this State are resilient to drought and use, and tend to be resistant to degradation. However, with long-term or repeated pressures, this community will shift.
Community 1.1 Rhizomatous Wheatgrasses/Birdfoot Sagebrush
The interpretive plant community for this site is the Reference State. This state evolved with grazing by large herbivores and very droughty soils due to the very slow infiltration rate. Potential vegetation is dominated by salt tolerant, drought resistant, mid cool-season perennial grasses and shrubs. The expected potential composition for this site is about 50 percent grasses, 10 percent forbs and 40 percent woody plants.
The major grasses include rhizomatous wheatgrasses, bottlebrush squirreltail, and Indian ricegrass. A variety of forbs and half-shrubs also occur, as shown in the preceding table. Birdfoot sagebrush and Gardner saltbush comprise almost half of the total annual production. Winterfat is a common component found on this site. A variety of forbs also occurs in this state and plant diversity is high (see Plant Composition Table).
The total annual production (air-dry weight) of this state is about 300 pounds per acre, but it can range from about 150 lbs/acre in unfavorable years to about 450 lbs./acre in above average years.
Resilience management. This state is extremely stable and well adapted to the climatic conditions within the foothills and basin. The diversity in plant species allows for high drought resistance. This is a sustainable plant community (site/soil stability, watershed function, and biologic integrity).
Terrestrial habitat for wildlife and invertebrates
Inadequate livestock shelter
Inadequate livestock water quantity, quality, and distribution
Figure 8. Annual production by plant type (representative values) or group (midpoint values)
Table 5. Annual production by plant type
Plant type
Low (lb/acre)
Representative value (lb/acre)
High (lb/acre)
Grass/Grasslike
95
175
250
Shrub/Vine
50
100
150
Forb
5
25
50
Total
150
300
450
Table 6. Soil surface cover
Tree basal cover
0%
Shrub/vine/liana basal cover
0-10%
Grass/grasslike basal cover
0-5%
Forb basal cover
0-5%
Non-vascular plants
0%
Biological crusts
0-5%
Litter
5-15%
Surface fragments >0.25" and <=3"
0-10%
Surface fragments >3"
0-5%
Bedrock
0%
Water
0%
Bare ground
30-60%
Table 7. Canopy structure (% cover)
Height Above Ground (ft)
Tree
Shrub/Vine
Grass/ Grasslike
Forb
<0.5
–
10-25%
5-15%
1-5%
>0.5 <= 1
–
0-15%
0-15%
0-5%
>1 <= 2
–
–
0-5%
–
>2 <= 4.5
–
–
–
–
>4.5 <= 13
–
–
–
–
>13 <= 40
–
–
–
–
>40 <= 80
–
–
–
–
>80 <= 120
–
–
–
–
>120
–
–
–
–
Figure 9. Plant community growth curve (percent production by month). WY0701, 10-14E upland sites.
Jan
Feb
Mar
Apr
May
Jun
Jul
Aug
Sep
Oct
Nov
Dec
J
F
M
A
M
J
J
A
S
O
N
D
5
25
40
10
5
10
5
Community 1.2 Mixed Perennial Grass/Birdfoot Sagebrush
This plant community is the result of moderate continuous season long grazing and is exacerbated by prolong drought conditions. Birdfoot sagebrush composes a significant percentage of the annual production of plant community. Cool-season grasses make up the majority of the understory with the balance made up of short warm season grasses, and miscellaneous forbs.
Dominant grasses include rhizomatous wheatgrasses, and bottlebrush squirreltail and Sandberg bluegrass. Forbs commonly found in this plant community include wild onion, scarlet globemallow, fringed sagewort, smooth woody aster, wild parsley, and phlox. Birdfoot Sagebrush can make up to 50% of the annual production. Plains pricklypear cactus can also occur.
When compared to the Reference Community Phase, birdfoot sagebrush has increased. Production of cool-season grasses, particularly Indian ricegrass, has been reduced, as have shrubs such as winterfat. This diverse plant community provides support for domestic livestock and wildlife such as antelope.
The total annual production (air-dry weight) of this state is about 200 pounds per acre, but it can range from about 75 lbs./acre in unfavorable years to about 300 lbs./acre in above average years.
Resilience management. This plant community is resistant to change. The herbaceous species present are well adapted to grazing; however, species composition can be altered through long-term overgrazing. The herbaceous component is mostly intact and plant vigor and replacement capabilities are sufficient. Water flow patterns and litter movement may be occurring but only on steeper slopes. Incidence of pedestalling is minimal. Soils are mostly stable and the surface shows minimum soil loss. The watershed is functioning and the biotic community is intact.
Terrestrial habitat for wildlife and invertebrates
Feed and forage imbalance
Inadequate livestock shelter
Inadequate livestock water quantity, quality, and distribution
Pathway 1.1A Community 1.1 to 1.2
This plant community is the result of moderate continuous season long grazing and is exacerbated by prolong drought conditions. Time and timing of grazing may also have an effect on this transition or may help reduce the risk of this transition.
Pathway 1.2A Community 1.2 to 1.1
Long-term Prescribed Grazing – With extended grazing management, allowing rest and rotation, these sites may be prevented from further degradation, and will see a return to a reference state composition over very extended periods.
Conservation practices
Critical Area Planting
Prescribed Grazing
State 2 Birdfoot Sagebrush/Bare Ground
The harsh environment presented by the soils of the Dense Clay ecological site limit the persistence of most perennial grasses. Although, the species that are key to this site are resilient species, after long term pressure, the community will shift to a birdfoot sagebrush only community.
Characteristics and indicators. The lack of herbaceous vegetation within the birdfoot sagebrush canopy is the key indication of being in this community. A few annual forbs may occur and a few perennial forbs, but most grasses are not present.
Resilience management. Once this community has established recruitment of key grasses is difficult making this community resilient and resistant to change.
Community 2.1 Birdfoot Sagebrush/Bare Ground
This plant community is the result of frequent and severe grazing and is exacerbated by prolonged periods of drought. Birdfoot sagebrush dominates this plant community, as the annual production is in excess of 50 percent. The preferred cool season grasses have been eliminated or greatly reduced.
The dominant grass is Sandberg bluegrass, or mutton bluegrass at a slightly higher elevation. Weedy annual species such as cheatgrass, halogeton, and Russian thistle will occupy the site if a seed source is available. Cactus has increased. Plant diversity is poor. The interspaces between plants have expanded significantly leaving mostly bare ground. When compared to the historic climax plant community the perennial cool-season grasses are absent and birdfoot sage and annuals dominate.
The total annual production (air-dry weight) of this state is about 125 pounds per acre, but it can range from about 50 lbs/acre in unfavorable years to about 200 lbs./acre in above average years.
Resilience management. This plant community is resistant to change as the stand becomes more decadent. Continued frequent and severe grazing or the removal of grazing does not seem to affect the plant composition or structure of the plant community. Plant diversity is greatly altered and the herbaceous component is not intact. Recruitment of perennial grasses is not occurring and the replacement potential is absent. The biotic integrity is missing.
Soil erosion is accelerated because of increased bare ground. Water flow patterns and pedestalling are obvious. Infiltration is reduced and runoff is increased. Rill channels are noticeable in the interspaces and gullies are being establishing where rills have concentrated down slope. The watershed may or may not be functional.
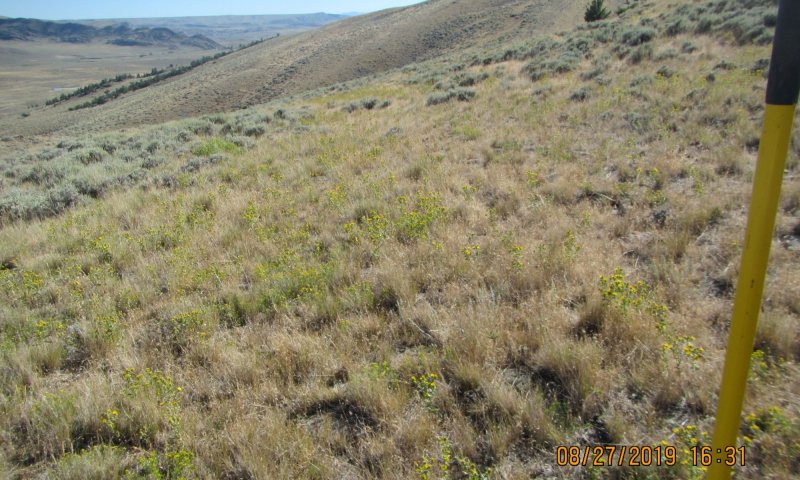
Figure 10. A healed dozer trail carries a prominent cover of curlycup gumweed and an unexpected cover of fringed sagewort suggesting alteration of the soil characteristics for this site.
This state, the Invaded State, is less consipicuous than neighboring ecological sites. Cheatgrass and other invasive species will establish in this community, but do not tend to become extensive.
Characteristics and indicators. The significant presence of an invader species, of at least 5 percent by cover, qualifies a State as being invaded.
Resilience management. As annuals or other invasive species increase the native grasses are weakened and eventually removed from the community. The resulting invader/saltbush dominated community is resistant and resilient against change. Cheatgrass may be a common threat, but unlike big sagebrush communities, birdsfoot sagebrush is able to maintain and prevent the dense monoculture stands of Cheatgrass. The corresponding fire risk of cheatgrass continues to be muted by the reduced fine fuels.
Community 3.1 Invaded
The major invasive species that are moving into the Big Horn Basin and lower foothill regions are: cheatgrass, Russian Knapweed, whitetop, and a variety of thistles. Cheatgrass is the major threat to the foothills. The potential risk of becoming a monoculture of cheatgrass has been minimal on the Dense Clay ecological site due to the low herbaceous potential pre-disturbance. Many of these areas are used frequently by recreationalists for 4-wheeling, shooting, etc due to the open barren nature. With the increased “traffic” and corresponding increase in soil disturbance provides for a more prevalent and abundant seed source as well as improved seedling establishment created by the loosening of the soil surface.
Resilience management. This plant community is resistant to change as the stand becomes more decadent. Continued frequent and severe grazing, or the removal of grazing, does not seem to affect the plant composition or structure of this plant community. Plant diversity is greatly altered and the herbaceous component is not intact. Recruitment of perennial grasses is not occurring and the replacement potential is minimal. The biotic integrity is missing.
State 4 Altered
This state is a dynamic state to capture those communities that have been disturbed or altered due to alternative uses including recreation, farming, energy development and other general land uses with soil surface disturbances.
Characteristics and indicators. The visual signs of disturbance or manipulation of the soil or the presence of seeded species are the key indications of an altered landscape.
Resilience management. Climatic conditions and soil limitations restrict the feasibility of manipulating the native vegetation or degraded sites with much success. Additional inputs to help improve soil quality as well as artificial watering systems to assist in seedling establishment have been costly, and troublesome. Irrigating/watering these sites has created issues with surface crusting, inhibiting seedling emergence. Intensity and timing of natural precipitation has proved risky and nearly impossible to achieve a high level of success. However, areas have had acceptable establishment with introduced or improved plant varieties. Large landscapes of this ecological concept have been identified surrounding or intermixed with active bentonite mines, oil/gas developments, or have been used for recreational vehicles. The level and extent of disturbance varies greatly between uses. These are all factors considered in the following Community description.
Community 4.1 Disturbed
This ecological site is generally small in size on the landscape, and is intermixed with other productive sites. So many times, these areas are used for parking vehicles or are incidental in many other land alteration practices, and are not a focus for management. Increased vehicle or motorized traffic, reacreational uses, and lounging areas for livestock and wildlife can significantly impact these areas. The barren tendancy/nature of this ecological site provides an easy location for a salt lick or mineral tub. As this increased pressure impacts the vegetation shifts to an annual driven community, until time or rest is provided to allow natural succession to occur or reclamation of the site occurs. Natural succession is slow, and limited by the droughty nature of the soils. Seeding is also difficult, but has proven more successful with higher precipitation.
Resilience management. Climatic conditions and soil limitations restrict the feasibility of manipulating the native vegetation or degraded sites with much success. Additional inputs to help improve soil quality as well as artificial watering systems to assist in seedling establishment have been costly, and troublesome. Irrigating/watering these sites has created issues with surface crusting, inhibiting seedling emergence. Intensity and timing of natural precipitation is limiting, but has had greater success than at lower elevations. Areas have had acceptable establishment with introduced or improved plant varieties.
Dominant resource concerns
Sheet and rill erosion
Classic gully erosion
Compaction
Sediment transported to surface water
Plant productivity and health
Plant structure and composition
Plant pest pressure
Terrestrial habitat for wildlife and invertebrates
Feed and forage imbalance
Inadequate livestock shelter
Inadequate livestock water quantity, quality, and distribution
Transition T1A State 1 to 2
Frequent and severe grazing, will convert the plant community to the Birdfoot Sagebrush/Bare Ground Community Phase. The probability of this occurring is high on areas where birdfoot sagebrush is not adversely impacted by heavy browsing and prolong drought has occurred.
Constraints to recovery. The ability for native grasses to establish in this tough soil.
Transition T1B State 1 to 3
Rhizomatous Wheatgrasses/Birdfoot Sagebrush
Invaded
Drought, Disturbance or Over-use with Seed Source present - When drought or a disturbance such as over-use by grazers occurs the vulnerability of the state is opened and when there is a seed source present, invasive species can gain a foot hold quickly due to the open canopy and low plant density.
Constraints to recovery. Recovery is limited to the ability to control or eradicate the species of invasion.
Restoration pathway R2A State 2 to 1
Prescribed grazing or possibly long-term prescribed grazing, will convert this plant community to the Reference State. The probability of this occurring is high especially if rotational grazing along with short deferred grazing is implemented as part of prescribed method of use. Brush management is not usually necessary at the time these grazing systems are implemented.
Context dependence. The seed bank or nursery stock is needed to aid the recovery process in the system.
Conservation practices
Critical Area Planting
Prescribed Grazing
Transition T2A State 2 to 3
Continued Disturbance or Lack of Use/Management with Seed Source present - Repeated extensive use by recreational traffic is common on the raw or "disturbed" appearance of reclaimed or manipulated areas. These at-risk locations are vulnerable to weed encroachment, especially by aggressive invasive species that are persistent within the Big Horn Basin and lower foothills. Cheatgrass has seed sources readily available and easily transported on tires, undercarriages, animals, and humans. With continued presence of activity or movement through disturbed or establishing communities, the risk of transitioning to an invaded state increases.
Constraints to recovery. The ability to control the invasive species is the major constraint to recovery for this community.
Restoration pathway R3A State 3 to 4
Grazing management after the use of seedings following soil amendments or other techniques to aid establishment of native or improved varieties and an intense weed management plan will aid the recovery of this community.
Conservation practices
Critical Area Planting
Prescribed Grazing
Grazing Land Mechanical Treatment
Heavy Use Area Protection
Recreation Area Improvement
Integrated Pest Management (IPM)
Transition T4A State 4 to 3
Drought, Disturbance or Over-use with Seed Source present - When drought or a disturbance such as over-use by grazers occurs the vulnerability of the state is opened and when there is a seed source present, invasive species can gain a foot hold quickly due to the open canopy and low plant density.
Constraints to recovery. Recovery is limited to the ability to control or eradicate the species of invasion.
Additional community tables
Table 8. Community 1.1 plant community composition
Reference: Rhizomatous Wheatgrasses/Birdfoot sagebrush: The composition of grasses and shrubs in this plant community favors feeders, such as antelope. Because of the low growing shrub component this is not suitable for thermal and escape cover for deer, but may be preferred by antelope or other wildlife. When found adjacent to sagebrush dominated states, this plant community may provide brood rearing/foraging areas for sage grouse, as well as lek sites. Other birds that would frequent this plant community include western meadowlarks, horned larks, and golden eagles. Prairie dogs and other small mammals prefer these areas as tall, dense stands of vegetation impede recognition and escape from predators.
Mixed Perennial Grass/Birdfoot Sagebrush: This plant community exhibits a low level of plant species diversity but is an important winter range for antelope. When found adjacent to sagebrush dominated states, this plant community may provide brood rearing/foraging areas for sage grouse, as well as lek sites. Other birds that would frequent this plant community include western meadowlarks, horned larks, and golden eagles. Prairie dogs and other small mammals prefer these areas as tall, dense stands of vegetation impede recognition and escape from predators.
Birdfoot Sagebrush/Bare Ground: This plant community has a low level of diversity. Due to the dominance of annual weeds and grasses, feed for large mammals is limited. Areas of bare ground may provide leks for birds such as sage grouse or habitat for Prairie dogs and other small mammals.
Animal Community – Grazing Interpretations
The following table lists suggested stocking rates for cattle under continuous season-long grazing under normal growing conditions. These are conservative estimates that should be used only as guidelines in the initial stages of the conservation planning process. Often, the current plant composition does not entirely match any particular plant community (as described in this ecological site description). Because of this, a field visit is recommended, in all cases, to document plant composition and production. More precise carrying capacity estimates should eventually be calculated using this information along with animal preference data, particularly when grazers other than cattle are involved. Under more intensive grazing management, improved harvest efficiencies can result in an increased carrying capacity. If distribution problems occur, stocking rates must be reduced to maintain plant health and vigor.
Plant Community Production Carrying Capacity*
(lb./ac) (AUM/ac) (Ac/AUM)
Reference Plant Community 150-450 .08 12.17
Mixed Perennial Grass/Birdfoot Sagebrush 75-300 .06 18.25
Birdfoot Sagebrush/Bare Ground 50-200 .03 29.2
* - Continuous, season-long grazing by cattle under average growing conditions.
Grazing by domestic livestock is one of the major income-producing industries in the area. Rangeland in this area may provide yearlong forage for cattle, sheep, or horses. During the dormant period, the forage for livestock use needs to be supplemented with protein because the quality does not meet minimum livestock requirements.
Distance to water, shrub density, and slope can affect grazing capacity within a management unit. Adjustments should be made for the area that is considered necessary for reduction of animal numbers. For example, 30% of a management unit may have 25% slopes and distances of greater than 1 mile from water; therefore the adjustment is only calculated for 30% of the unit (i.e. 50% reduction on 30% of the management unit). Fencing, slope length, management, access, terrain, kind and class of livestock, and breeds are all factors that can increase or decrease the percent of graze-able acres within a management unit. Adjustments should be made that incorporate these factors when calculating stocking rates.
Hydrological functions
Water is the principal factor limiting forage production on this site. This site is dominated by soils in hydrologic group C and D. Infiltration ranges from slow to very slow. Runoff potential for this site varies from high to very high depending on soil hydrologic group and ground cover. In many cases, areas with greater than 75% ground cover have the greatest potential for high infiltration and lower runoff. An example of an exception would be where short-grasses form a strong sod and dominate the site. Areas where ground cover is less than 50% have the greatest potential to have reduced infiltration and higher runoff (refer to Part 630, NRCS National Engineering Handbook for detailed hydrology information).
Rills and gullies should not typically be present. Water flow patterns should be barely distinguishable if at all present. Pedestals are only slightly present in association with bunchgrasses. Litter typically falls in place, and signs of movement are not common. Chemical and physical crusts are rare to non-existent. Cryptogamic crusts are present, but only cover 1-2% of the soil surface.
Recreational uses
This site provides hunting opportunities for upland game species. The wide variety of plants which bloom from spring until fall have an aesthetic value that appeals to visitors.
Wood products
No appreciable wood products are present on the site.
Other products
None noted.
Supporting information
Inventory data references
Information presented in the original site description was derived from NRCS inventory data. Field observations from range trained personnel were also used. Those involved in developing the original site include: Chris Krassin, Range Management Specialist, NRCS and Everet Bainter, Range Management Specialist. Other sources used as references include USDA NRCS Water and Climate Center, USDA NRCS National Range and Pasture Handbook, USDI and USDA Interpreting Indicators of Rangeland Health Version 3, and USDA NRCS Soil Surveys from various counties.
Information presented here has been derived from NRCS inventory data, Field observations from range trained personnel, and the existing range site descriptions. Those involved in developing the Loamy range site include: Chris Krassin, Range Management Specialist, NRCS and Everet Bainter, Range Management Specialist.
Those involved in the development of the concept for the Ecological site include: Ray Gullion, Retired Area Range Management Specialist, NRCS; Jim Wolf, Resource Manager, USDI-BLM; Jack Mononi, Range Management Specialist, USDI-BLM; Daniel Wood, MLRA Soil Survey Leader, NRCS; Jane Karinen, Soil Data Quality Specialist, NRCS; and Marji Patz, Ecological Site Specialist, NRCS.
Inventory Data References:
Ocular field estimations observed by trained personnel were completed at each site. Then sites were selected where a 100 foot tape was stretched and the following sample procedures were completed by inventory staff. For full sampling protocol and guidelines with forms please refer to the Wyoming ESI Operating Procedures, compiled in 2012 for the Powell and Rock Springs Soil Survey Office, USDA-NRCS.
• Double Sampling Production Data (9.6 hoop used to estimate 10 points, clipped a minimum of 3 of these estimated points, with two 21 foot X 21 foot square extended shrub plots).
• Line Point Intercept (over story and understory captured with soil cover). Height of herbaceous and woody cover is collected every three feet along established transect.)
• Continuous Line Intercept (Woody Canopy Cover, with minimum gap of 0.2 of a foot for all woody species and succulents. Intercept height collected at each measurement.),
• Gap Intercept (Basal Gap measured with a minimum gap requirement of 0.7 foot.),
• Sample Point (10 – 1 meter square point photographs taken at set distances on transect. Red using the sample point computer program established by the High Plains Agricultural Research Center, WY).
• Soil Stability (Slake Test – surface and subsurface samples collected and processed according to the soil stability guidelines provided by the Jornada Research Center, NM.)
Other references
Baker, William L. 2006. Fire and Restoration of Sagebrush Ecosystems. Wildlife Society Bulletin 34(1): 177-185.
Bestelmeyer, B., and J. R. Brown. 2005. State-and-transition models 101: a fresh look at vegetation change. The Quivira Coalition Newsletter, Vol. 7, No. 3.
Bestelmeyer, B., J. R. Brown, K. M. Havstad, B. Alexander, G. Chavez, J. E. Herrick. 2003. Development and use of state and transition models for rangelands. Journal of Range Management 56(2):114-126.
Bestelmeyer, B., J. E. Herrick, J. R. Brown, D. A. Trujillo, and K. M. Havstad. 2004. Land management in the American Southwest: a state-and-transition approach to ecosystem complexity. Environmental Management 34(1):38-51.
Herrick, J. E., J. W. Van Zee, K. M. Havstad, L. M. Burkett, and W. G. Whitford. 2005. Monitoring manual for grassland, shrubland and savanna Ecosystems. Volume I Quick Start. USDA - ARS Jornada Experimental Range, Las Cruces, New Mexico.
Herrick, J. E., J. W. Van Zee, K. M. Havstad, L. M. Burkett, and W. G. Whitford. 2005. Monitoring manual for grassland, shrubland and savanna Ecosystems. Volume II: Design, supplementary methods and interpretation. USDA - ARS Jornada Experimental Range, Las Cruces, New Mexico.
NRCS. 2014. (electronic) Field Office Technical Guide. Available online at http://efotg.nrcs.usda.gov/efotg_locator.aspx?map=WY NRCS. 2009. Plant Guide: Cheatgrass. Prepared by Skinner et al., National Plant Data Center.
Pellant, M., P. Shaver, D. A. Pyke, and J. E. Herrick. 2005. Interpreting indicators of rangeland health. Version 4. Technical Reference 1734-6. USDI-BLM. Ricketts, M. J., R. S. Noggles, and B. Landgraf-Gibbons. 2004. Pryor Mountain Wild Horse Range Survey and Assessment. USDA-Natural Resources Conservation Service.
Schoeneberger, P. J., D. A. Wysocki, E. C. Benham, and Soil Survey Staff. 2012. Field book for describing and sampling soils, Version 3.0. Natural Resources Conservation Service, National Soil Survey Center, Lincoln, NE. (http://soils.usda.gov/technical/fieldbook/)
Stringham, T. K. and W. C. Krueger. 2001. States, transitions, and thresholds: Further refinement for rangeland applications. Agricultural Experiment Station, Oregon State University. Special Report 1024.
Stringham, T. K., W. C. Kreuger, and P. L Shaver. 2003. State and transition modeling: an ecological process approach. Journal of Range Management 56(2):106-113.
United States Department of Agriculture. Soil Survey Division Staff. 1993. Soil Survey Manual, United States Department of Agriculture Handbook No. 18, Chapter 3: Examination and Description of Soils. Pg.192-196.
Trlica, M. J. 1999. Grass growth and response to grazing. Colorado State University. Cooperative Extension. Range. Natural Resource Series. No. 6.108.
U.S. Department of Agriculture, Natural Resources Conservation Service (USDA/NRCS). 2007. The PLANTS Database (http://plants.usda.gov). National Plant Data Center, Baton Rouge, LA 70874-4490 USA.
U.S. Department of Agriculture, Natural Resources Conservation Service (USDA/NRCS), Soil Survey Staff. 2010. Keys to Soil Taxonomy, Eleventh Edition, 2010.
USDA/NRCS Soil survey manuals for appropriate counties within MLRA 32X.
Western Regional Climate Center. (2014) (electronic) Station Metadata. Available online at: http://www.wrcc.dri.edu/summary/climsmwy.html.
Contributors
Dan Mattke, Resource Soil Scientist - Rocky Mountain Area Office Blaise Allen, Multi-County Rangeland Management Specialist, Worland, WY
Approval
Kirt Walstad, 3/05/2025
Rangeland health reference sheet
Interpreting Indicators of Rangeland Health is a qualitative assessment protocol used to
determine ecosystem condition based on benchmark characteristics described in the Reference Sheet. A suite of 17 (or
more) indicators are typically considered in an assessment. The ecological site(s) representative of an assessment
location must be known prior to applying the protocol and must be verified based on soils and climate. Current plant
community cannot be used to identify the ecological site.
Author(s)/participant(s)
Blaise Allen
Contact for lead author
blaise.allen@usda.gov
Date
02/18/2020
Approved by
Kirt Walstad
Approval date
Composition (Indicators 10 and 12) based on
Annual Production
Indicators
Number and extent of rills:
Due to the wide slope range associated with this site, the number and extent of rills will vary from none on slope < 9% to common on slopes > 25%. If present, will be at the upper end of the slope range for this site (>15%) and will be short (<3 ft) and widely spaced relative to slope distance (8-10 feet). Minor rill development may be observed following major thunderstorm or spring runoff events, but they should heal during the next growing season.
Presence of water flow patterns:
Due to the wide slope range associated with this site, water flow patterns vary from barely observable on slopes of < 9% and from broken and irregular in appearance to continuous on slopes > 25%
Number and height of erosional pedestals or terracettes:
Not evident on slopes < 9%. Erosional pedestals will be present with terracettes present at debris dams on slopes >9%. Perennial vegetation shows little evidence of erosional pedestalling (2 to 3% of individual plants). Plant roots are covered and litter remains in place around plant crowns. Terracettes should be absent or, if present, stable.
Bare ground from Ecological Site Description or other studies (rock, litter, lichen, moss, plant canopy are
not bare ground):
Bare ground is 30-60%, occurring in small openings (2-3 ft) throughout the site. Animal activity (i.e. burrows) may occasionally result in isolated bare patches up to 5' in diameter.
Number of gullies and erosion associated with gullies:
Active gullies restricted to concentrated water flow patterns. A few gullies may be present in landscape settings where they transport runoff from areas of greater water flow such as exposed bedrock. These gullies will be limited to slopes exceeding 20% slope and adjacent to sites where this runoff accumulation occurs. Any gullies present should show little sign of accelerated erosion and should be stabilized with perennial vegetation.
Extent of wind scoured, blowouts and/or depositional areas:
None. No evidence of wind generated soil movement is expected.
Amount of litter movement (describe size and distance expected to travel):
Little to no plant litter movement occurs on slopes < 9%. Fine litter in the interspaces may move up to 3 ft following a significant run-off event. Coarse litter generally does not move.
Soil surface (top few mm) resistance to erosion (stability values are averages - most sites will show a range
of values):
Plant cover and litter is at 30% or greater of soil surface and maintains soil surface integrity. Soil Stability Index ratings range from 3 (interspaces) to 6 (under plant canopy), but average values should be 4 or greater.
Soil surface structure and SOM content (include type of structure and A-horizon color and thickness):
Use Soil Series description for depth and color of A-horizon. Soil Organic Matter of less than 1% is expected. Field indicators of departure from the reference condition include exposure of subsoil as evidenced by excessive pedastalling and/or surface disturbance.
Effect of community phase composition (relative proportion of different functional groups) and spatial
distribution on infiltration and runoff:
Relative composition for this site is 50% grasses, 10% forbs and 40% woody plants. Sparse plant canopy, slow infiltration rates, and the high amount of bare ground contribute to very slow to slow infiltration rates, the amount of bare ground and steepness of slopes results in a naturally high runoff rate on slopes > 25%, even in HCPC.
Presence and thickness of compaction layer (usually none; describe soil profile features which may be
mistaken for compaction on this site):
No compaction layer should be present, but soil crusting in dry conditions is typical.
Functional/Structural Groups (list in order of descending dominance by above-ground annual-production or live foliar
cover using symbols: >>, >, = to indicate much greater than, greater than, and equal to):
Dominant:
Shrubs (1 Species)
Sub-dominant:
Short Stature, Cool Season Grasses (1 Species)
Mid Stature, Cool Season Grasses (1 Species)
Rhizomatous Cool Season Grasses (1 species)
Other:
Forbs
Additional:
12a. Community 1.1 Perennial Shrubs > Mid Stature Grasses > Rhizomatous Cool Season Grasses = Short Stature Grasses
12b. Functional/Structural groups not expected- annual grasses
12c. Number of Functional/Structural groups: 4 Groups
12d. Species number in Dominate and sub-dominate F/S groups: 4 species
Amount of plant mortality and decadence (include which functional groups are expected to show mortality or
decadence):
Some plant mortality and decadence is expected, typically associated with shrub component.
Average percent litter cover (%) and depth ( in):
Litter ranges from 5-25% of total canopy measurement with total litter (including beneath the plant canopy) from 10-40% expected. Herbaceous litter depth is typically very shallow, ranging from 1-5mm. Woody litter can be up to a couple inches (4-6 cm).
Expected annual annual-production (this is TOTAL above-ground annual-production, not just forage annual-production):
English: 150-450 lb/ac (300 lb/ac average); Metric: 68-204 kg (136 kg average).
Potential invasive (including noxious) species (native and non-native). List species which BOTH characterize
degraded states and have the potential to become a dominant or co-dominant species on the ecological site if
their future establishment and growth is not actively controlled by management interventions. Species that become
dominant for only one to several years (e.g., short-term response to drought or wildfire) are not invasive
plants. Note that unlike other indicators, we are describing what is NOT expected in the reference state for the
ecological site:
Bare ground greater than 70% is the most common indicator of a threshold being crossed. Birdfoot sagebrush, Sandberg bluegrass, Woody aster, Annuals, Exotics, and Species found on Noxious Weed List
Perennial plant reproductive capability:
May be Limited due to effective moisture and seed to soil contact. Western Wheatgrass will commonly reproduce by underground rhizomes and not by seed production, especially in drought years.
The Ecosystem Dynamics Interpretive Tool is an information system framework developed by the USDA-ARS Jornada Experimental Range, USDA Natural Resources Conservation Service, and New Mexico State University.
Click on box and path labels to scroll to the respective text.
Frequent and severe use is the driver of this transtion.
T1B
-
Drought alone or with other surface disturbances, including grazing, with a seed source present will force this transition.
R2A
-
Long-term prescribed grazing will convert this community phase.
T2A
-
Repeated extensive use by recreational traffic, livestock or others with seed sources present leave this state at risk of transitioning to the Invaded State.
R3A
-
Seeding, soil amendments, weed control and prescribed grazing will aid in recovery of this site.
T4A
-
Drought alone or with other surface disturbances, including grazing, with a seed source present will force this transition.