Natural Resources
Conservation Service
Ecological site R065XY041NE
Shallow To Gravel
Accessed: 11/13/2024
General information
Provisional. A provisional ecological site description has undergone quality control and quality assurance review. It contains a working state and transition model and enough information to identify the ecological site.
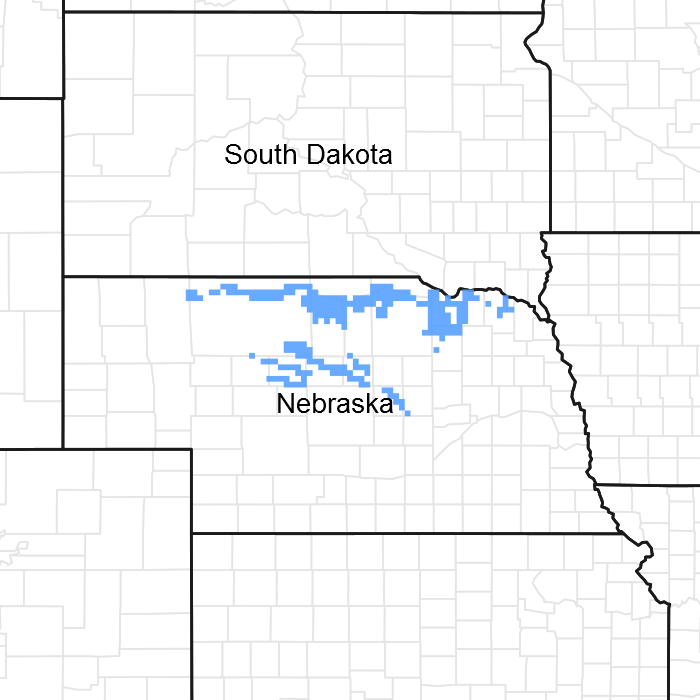
Figure 1. Mapped extent
Areas shown in blue indicate the maximum mapped extent of this ecological site. Other ecological sites likely occur within the highlighted areas. It is also possible for this ecological site to occur outside of highlighted areas if detailed soil survey has not been completed or recently updated.
MLRA notes
Major Land Resource Area (MLRA): 065X–Nebraska Sand Hills
This PROVISIONAL ECOLOGICAL SITE has been developed to meet the standards established in the National Ecological Site Handbook. The information associated with this ecological site does not meet the Approved Ecological Site Description Standard, but it has been through a Quality Control and Quality Assurance processes to assure consistency and completeness. Further investigations, reviews and correlations are necessary before it becomes an Approved Ecological Site Description.
Classification relationships
Major Land Resource Area (MLRA): Major Land Resource Area (MLRA) and Land Resource Unit (LRU) (USDA-Natural Resources Conservation Service, 2006)
Revision Notes:
A PROVISIONAL ECOLOGICAL SITE is a conceptual grouping of soil map unit components within a Major Land Resource Area (MLRA) based on the similarities in response to management. Although there may be wide variability in the productivity of the soils grouped into a Provisional Site, the soil vegetation interactions as expressed in the State and Transition Model are similar and the management actions required to achieve objectives, whether maintaining the existing ecological state or managing for an alternative state, are similar. Provisional Sites are likely to be refined into more precise group during the process of meeting the APPROVED ECOLOGICAL SITE DESCRIPTION criteria.
Ecological site concept
The Shallow to gravel site is associated with dunes or hills with slopes of greater than 3%. The soil is gravelly within 20 inches of the surface.
Associated sites
R065XY032NE |
Sandy Medium P.Z. 17-22 Sandy 17-22" P.Z. |
---|---|
R065XY033NE |
Sands Medium P.Z. 17-22 Sands 17-22" P.Z. |
R065XY054NE |
Sandy High P.Z. 22-25 Sandy 22-25" P.Z. |
R065XY055NE |
Sands High P.Z. 22-25 Sands 22-25" P.Z. |
Similar sites
R065XY032NE |
Sandy Medium P.Z. 17-22 Sandy 17-22" P.Z. (higher production; sand bluestem dominant; less blue grama) |
---|
Table 1. Dominant plant species
Tree |
Not specified |
---|---|
Shrub |
Not specified |
Herbaceous |
(1) Andropogon hallii |
Physiographic features
This site occurs on stream terraces and uplands where gravelly sediments are deposited. This site is generally limited to the transitional areas on the edge of MLRA 65, and is most frequent on upland sites along rivers and streams. Although rarely occurring when compared to other sites, it’s less resilient nature, droughty conditions and special management concerns require a separate site description.
Table 2. Representative physiographic features
Landforms |
(1)
Ridge
(2) Terrace (3) Alluvial fan |
---|---|
Elevation | 2,000 – 4,000 ft |
Slope | 30% |
Aspect | Aspect is not a significant factor |
Climatic features
The mean average annual precipitation varies from 17 - 25 inches, but has varied from 13 to 29 inches in the driest to wettest seasons. Approximately 65 percent of the annual precipitation occurs during the growing season of mid-April to late September. The average annual snowfall varies from about 30 inches to about 55 inches. The wind velocity is high throughout the year, averaging 10 to 12 miles per hour. Maximum wind velocities generally occur in the spring.
The average length of the growing season is 138 days, but the growing season has varied from 114 to 168 days. The average date of first frost in the fall is September 25, and the last frost in the spring is about May 10. July is the hottest month and January is the coldest. It is not uncommon for the temperature to reach 100 ºF during the summer. The winters are characterized with frequent northerly winds, producing severe cold with temperatures dropping to as low as -30 ºF.
Growth of native cool season plants begins mid to late March and continues to late June. Native warm season plants begin growth in early May and continue to late August. Green up of cool season plants may occur in September and October when adequate soil moisture is present.
Table 3. Representative climatic features
Frost-free period (average) | 138 days |
---|---|
Freeze-free period (average) | 157 days |
Precipitation total (average) | 21 in |
Figure 2. Monthly precipitation range
Figure 3. Monthly average minimum and maximum temperature
Figure 4. Annual precipitation pattern
Figure 5. Annual average temperature pattern
Influencing water features
None
Soil features
The features common to all soils in this site are the sand to sandy loam textured surface soils and slopes of 0 to 30 percent. The soils in this site are from somewhat excessively to excessively drained and formed in alluvium. The surface layer is 4 to 16 inches thick. The texture of the subsurface generally ranges from sand to gravelly coarse sand. Runoff as evidenced by patterns of rill, gully or other water flow is negligible to low, in spite of the steep slopes, due to the very high intake rate of these soils. Cryptobiotic crusts are present, but their function is not well understood. Some pedestalling of plants occurs, but it is not very evident on casual observation and occurs on less than 5% of the plants.
More information can be found in the various soil survey reports. Contact the local USDA Service Center for soil survey reports that include more detail specific to your location.
Major soil series correlated to this ecological site include: Meadin and Simeon.
Other soil series that have been correlated to this site include: None.
Table 4. Representative soil features
Surface texture |
(1) Sand (2) Loamy sand (3) Sandy loam |
---|---|
Family particle size |
(1) Sandy |
Drainage class | Excessively drained |
Permeability class | Rapid to very rapid |
Soil depth | 80 in |
Surface fragment cover <=3" | 40% |
Surface fragment cover >3" | 5% |
Available water capacity (0-40in) |
2 – 5 in |
Calcium carbonate equivalent (0-40in) |
Not specified |
Electrical conductivity (0-40in) |
Not specified |
Sodium adsorption ratio (0-40in) |
Not specified |
Soil reaction (1:1 water) (0-40in) |
5.1 – 7.8 |
Subsurface fragment volume <=3" (Depth not specified) |
55% |
Subsurface fragment volume >3" (Depth not specified) |
10% |
Ecological dynamics
As this site deteriorates, species such as hairy grama, blue grama, and club moss will increase. Grasses such as sand bluestem, little bluestem, needleandthread and sideoats grama will decrease in frequency and production. Perennial forbs increase under poor management, and if management persists, annual forbs and shrubs will also increase as grasses decrease.
This site is extremely responsive to high moisture years when additional moisture is received during the growing season. The associated coarse textured soils have low moisture holding capability, which generally limits plant growth. With additional moisture, the interpretive plant community can significantly increase its production when compared to the production of a normal year.
Interpretations are primarily based on the Sand Bluestem/Prairie Sandreed Plant Community. It has been determined by study of rangeland relic areas, areas protected from excessive disturbance, and areas under long-term rotational grazing regimes. Trends in plant community dynamics ranging from heavily grazed to lightly grazed areas, seasonal use pastures, and historical accounts also have been used. Subclimax plant communities, states, transitional pathways, and thresholds have been determined through similar studies and experience.
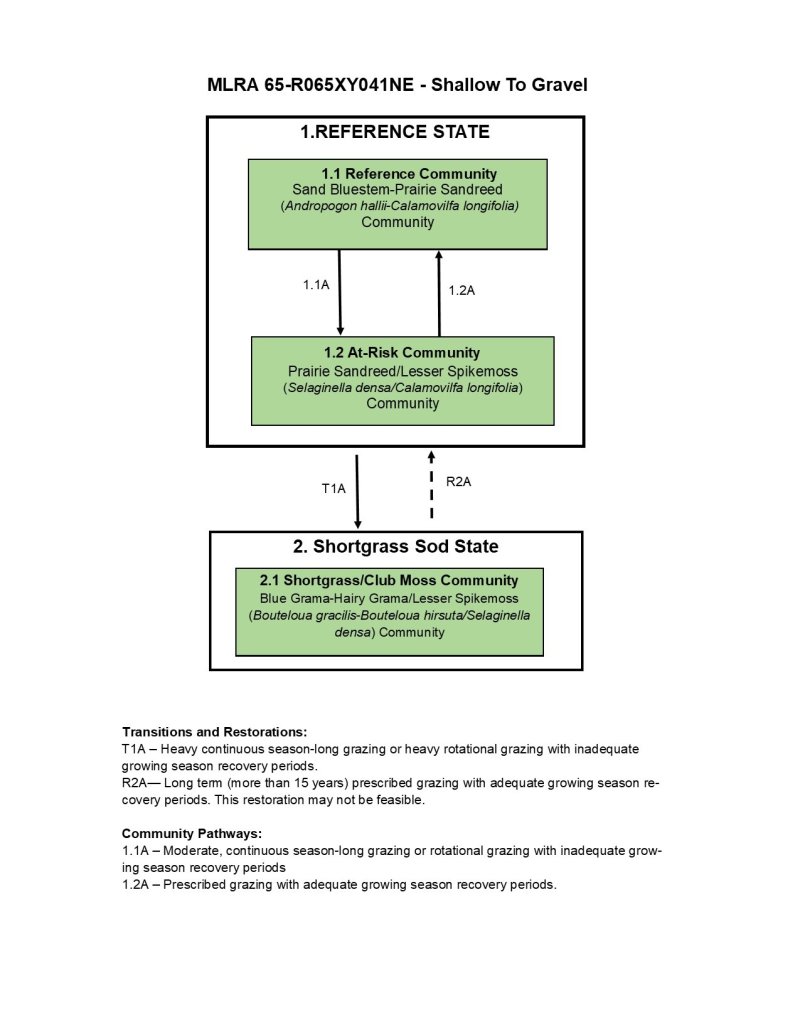
The following is a diagram that illustrates the common plant communities that can occur on the site and the transition pathways between communities. The ecological processes will be discussed in more detail in the plant community descriptions following the diagram.
State and transition model
More interactive model formats are also available.
View Interactive Models
More interactive model formats are also available.
View Interactive Models
Click on state and transition labels to scroll to the respective text
State 1 submodel, plant communities
State 2 submodel, plant communities
State 3 submodel, plant communities
State 1
Sand Bluestem/Prairie Sandreed Plant Community
Community 1.1
Sand Bluestem/Prairie Sandreed Plant Community
Interpretations are primarily based on the Sand Bluestem/Prairie Sandreed Plant Community (this is also considered climax). This plant community evolved with grazing by large herbivores and is moderately suited for grazing by domestic livestock. This plant community can be found on areas that are properly managed with grazing and/or prescribed burning, and sometimes on areas receiving occasional short periods of rest. The potential vegetation is about 80% grasses or grass-like plants, 5% forbs, and 15% woody plants. The major grasses include blue grama, sand bluestem, prairie sandreed, and needleandthread. Other grasses occurring on this plant community include sand dropseed, prairie junegrass, little bluestem and sideoats grama. This plant community is well adapted to the Northern Great Plains climatic conditions. The diversity in plant species allows for high drought tolerance. This is a healthy and sustainable plant community (site/soil stability, watershed function, and biologic integrity). The following growth curve shows the estimated monthly percentages of total annual growth of the dominant species expected during a normal year: Growth curve number: NE6534 Growth curve name: Nebraska/South Dakota Sandhills, Native Grasslands Growth curve description: Warm-season dominant, cool-season subdominant, mid & tall grasses. Transitional pathways and/or community pathways leading to other plant communities are as follows: Moderate, continuous season-long grazing will convert the plant community to the Club Moss/Prairie Sandreed Plant Community.
Figure 6. Annual production by plant type (representative values) or group (midpoint values)
Table 5. Annual production by plant type
Plant type | Low (lb/acre) |
Representative value (lb/acre) |
High (lb/acre) |
---|---|---|---|
Grass/Grasslike | 550 | 820 | 1185 |
Shrub/Vine | 45 | 100 | 155 |
Moss | 0 | 50 | 105 |
Forb | 5 | 30 | 55 |
Total | 600 | 1000 | 1500 |
Figure 7. Plant community growth curve (percent production by month). NE6534, NE/SD Sandhills, Native Grasslands. Warm-season dominant, cool-season subdominant, mid- and tallgrasses.
Jan | Feb | Mar | Apr | May | Jun | Jul | Aug | Sep | Oct | Nov | Dec |
---|---|---|---|---|---|---|---|---|---|---|---|
J | F | M | A | M | J | J | A | S | O | N | D |
5 | 5 | 15 | 25 | 30 | 10 | 7 | 3 |
State 2
Club Moss/Prairie Sandreed Plant Community
Community 2.1
Club Moss/Prairie Sandreed Plant Community
This plant community is found under summer long grazing with moderate grazing pressure, or as a transitional plant community in a rotational grazing system. While prairie sandreed is the dominant species, blue grama is a significant component of this plant community. Warm-season grasses make up the majority of the plants with the balance made up of perennial forbs, sedges and shrubs. The potential vegetation is about 70% grasses or grass-like plants, 5% forbs, 15% shrubs and 10% cryptogams. Dominant grasses include blue grama and prairie sandreed. Grasses of secondary importance include little bluestem, prairie junegrass, and sand dropseed. Forbs commonly found in this plant community include lacy tansyaster (cutleaf ironplant) and goldenrod. The significant shrubs include brittle prickly pear (fragile cactus), broom snakeweed, plains pricklypear and prairie (fringed) sagewort. When compared to the climax plant community, prairie sandreed and club moss has increased. Little bluestem and needleandthread has decreased, and production of other cool and warm-season grasses has also been reduced. Sedges have also increased as a result of summer grazing pressure. This plant community is moderately resistant to change. The herbaceous species present are well adapted to grazing; however, species composition can be altered through long-term overgrazing. If the herbaceous component is intact, it tends to be resilient if the disturbance is not long-term. The following growth curve shows the estimated monthly percentages of total annual growth of the dominant species expected during a normal year: Growth curve number: NE6534 Growth curve name: Nebraska/South Dakota Sandhills, Native Grasslands Growth curve description: Warm-season dominant, cool-season subdominant, mid & tall grasses. Transitional pathways and/or community pathways leading to other plant communities are as follows: Continuous season-long grazing combined with heavy stocking rates will convert the plant community to the Club Moss/Grama Plant Community. Prescribed grazing will convert this plant community to the Sand Bluestem/Prairie Sandreed Plant Community.
Figure 8. Annual production by plant type (representative values) or group (midpoint values)
Table 6. Annual production by plant type
Plant type | Low (lb/acre) |
Representative value (lb/acre) |
High (lb/acre) |
---|---|---|---|
Grass/Grasslike | 515 | 693 | 770 |
Moss | 40 | 90 | 140 |
Shrub/Vine | 40 | 90 | 140 |
Forb | 5 | 27 | 50 |
Total | 600 | 900 | 1100 |
Figure 9. Plant community growth curve (percent production by month). NE6534, NE/SD Sandhills, Native Grasslands. Warm-season dominant, cool-season subdominant, mid- and tallgrasses.
Jan | Feb | Mar | Apr | May | Jun | Jul | Aug | Sep | Oct | Nov | Dec |
---|---|---|---|---|---|---|---|---|---|---|---|
J | F | M | A | M | J | J | A | S | O | N | D |
5 | 5 | 15 | 25 | 30 | 10 | 7 | 3 |
State 3
Club Moss/Grama Plant Community
Community 3.1
Club Moss/Grama Plant Community
This plant community is found close to watering facilities under continuous, summer long grazing with moderate grazing pressure, or pasture wide under heavy grazing use. Blue grama, hairy grama and club moss are significant components of this plant community. Warm-season grasses make up the majority of the plants with the balance made up of perennial forbs, sedges and shrubs. The potential vegetation is about 55% grasses or grass-like plants, 10% forbs, 15% shrubs and 20% cryptogams. Dominant grasses include blue grama, hairy grama and prairie sandreed. Grasses of secondary importance include little bluestem, prairie junegrass, and sand dropseed. Forbs commonly found in this plant community include lacy tansyaster (cutleaf ironplant) and goldenrod. The significant shrubs include brittle prickly pear (fragile cactus), broom snakeweed, plains pricklypear and prairie (fringed) sagewort. When compared to the climax plant community, grama grasses and club moss has increased. Little bluestem and sand bluestem has decreased, and production of cool and warm-season grasses has also been reduced. The following growth curve shows the estimated monthly percentages of total annual growth of the dominant species expected during a normal year: Growth curve number: NE6535 Growth curve name: Nebraska/South Dakota Sandhills, Grama Growth curve description: Warm-season dominant, short grass. Transitional pathways and/or community pathways leading to other plant communities are as follows: Long term prescribed grazing with adequate rest will convert this plant community to the Club Moss/Prairie Sandreed Plant Community.
Figure 10. Annual production by plant type (representative values) or group (midpoint values)
Table 7. Annual production by plant type
Plant type | Low (lb/acre) |
Representative value (lb/acre) |
High (lb/acre) |
---|---|---|---|
Grass/Grasslike | 310 | 310 | 310 |
Moss | 70 | 113 | 155 |
Shrub/Vine | 20 | 50 | 80 |
Forb | 0 | 28 | 55 |
Total | 400 | 501 | 600 |
Figure 11. Plant community growth curve (percent production by month). NE6535, NE/SD Sandhills, Grama. Warm-season dominant, short grass.
Jan | Feb | Mar | Apr | May | Jun | Jul | Aug | Sep | Oct | Nov | Dec |
---|---|---|---|---|---|---|---|---|---|---|---|
J | F | M | A | M | J | J | A | S | O | N | D |
0 | 0 | 0 | 5 | 15 | 30 | 25 | 15 | 10 | 0 | 0 | 0 |
Additional community tables
Table 8. Community 1.1 plant community composition
Group | Common name | Symbol | Scientific name | Annual production (lb/acre) | Foliar cover (%) | |
---|---|---|---|---|---|---|
Grass/Grasslike
|
||||||
1 | Warm-Season Grasses | 250–500 | ||||
sand bluestem | ANHA | Andropogon hallii | 150–300 | – | ||
prairie sandreed | CALO | Calamovilfa longifolia | 50–200 | – | ||
little bluestem | SCSC | Schizachyrium scoparium | 50–100 | – | ||
2 | Grama | 50–200 | ||||
blue grama | BOGR2 | Bouteloua gracilis | 50–150 | – | ||
hairy grama | BOHI2 | Bouteloua hirsuta | 0–100 | – | ||
3 | Needlegrass | 50–150 | ||||
needle and thread | HECOC8 | Hesperostipa comata ssp. comata | 50–150 | – | ||
porcupinegrass | HESP11 | Hesperostipa spartea | 0–50 | – | ||
4 | Miscellaneous Native Grasses | 50–150 | ||||
sand dropseed | SPCR | Sporobolus cryptandrus | 0–100 | – | ||
sideoats grama | BOCU | Bouteloua curtipendula | 0–50 | – | ||
prairie Junegrass | KOMA | Koeleria macrantha | 0–50 | – | ||
Grass, perennial | 2GP | Grass, perennial | 0–20 | – | ||
5 | Perennial Grass-Likes | 0–50 | ||||
sedge | CAREX | Carex | 0–50 | – | ||
Forb
|
||||||
6 | Forbs | 10–50 | ||||
Forb, perennial | 2FP | Forb, perennial | 0–20 | – | ||
Cuman ragweed | AMPS | Ambrosia psilostachya | 0–20 | – | ||
goldenrod | SOLID | Solidago | 0–20 | – | ||
stiff sunflower | HEPA19 | Helianthus pauciflorus | 0–10 | – | ||
lacy tansyaster | MAPI | Machaeranthera pinnatifida | 0–10 | – | ||
tarragon | ARDR4 | Artemisia dracunculus | 0 | – | ||
Shrub/Vine
|
||||||
7 | Shrubs | 50–150 | ||||
prairie sagewort | ARFR4 | Artemisia frigida | 0–50 | – | ||
broom snakeweed | GUSA2 | Gutierrezia sarothrae | 0–50 | – | ||
brittle pricklypear | OPFR | Opuntia fragilis | 0–50 | – | ||
plains pricklypear | OPPO | Opuntia polyacantha | 0–50 | – | ||
Moss
|
||||||
8 | Cryptogams | 0–100 | ||||
lesser spikemoss | SEDE2 | Selaginella densa | 0–100 | – |
Table 9. Community 2.1 plant community composition
Group | Common name | Symbol | Scientific name | Annual production (lb/acre) | Foliar cover (%) | |
---|---|---|---|---|---|---|
Grass/Grasslike
|
||||||
1 | Warm-Season Grasses | 270–540 | ||||
prairie sandreed | CALO | Calamovilfa longifolia | 225–405 | – | ||
sand bluestem | ANHA | Andropogon hallii | 45–135 | – | ||
little bluestem | SCSC | Schizachyrium scoparium | 0–45 | – | ||
2 | Grama | 90–270 | ||||
blue grama | BOGR2 | Bouteloua gracilis | 90–225 | – | ||
hairy grama | BOHI2 | Bouteloua hirsuta | 45–135 | – | ||
3 | Needlegrass | 0–45 | ||||
needle and thread | HECOC8 | Hesperostipa comata ssp. comata | 0–45 | – | ||
porcupinegrass | HESP11 | Hesperostipa spartea | 0–45 | – | ||
4 | Miscellaneous Native Grasses | 45–180 | ||||
prairie Junegrass | KOMA | Koeleria macrantha | 45–90 | – | ||
sand dropseed | SPCR | Sporobolus cryptandrus | 0–90 | – | ||
sideoats grama | BOCU | Bouteloua curtipendula | 0–45 | – | ||
Grass, perennial | 2GP | Grass, perennial | 0–18 | – | ||
5 | Perennial Grass-Likes | 0–90 | ||||
sedge | CAREX | Carex | 0–90 | – | ||
Forb
|
||||||
6 | Forbs | 9–45 | ||||
Forb, perennial | 2FP | Forb, perennial | 0–18 | – | ||
lacy tansyaster | MAPI | Machaeranthera pinnatifida | 0–18 | – | ||
goldenrod | SOLID | Solidago | 0–18 | – | ||
Cuman ragweed | AMPS | Ambrosia psilostachya | 0–9 | – | ||
stiff sunflower | HEPA19 | Helianthus pauciflorus | 0–9 | – | ||
Shrub/Vine
|
||||||
7 | Shrubs | 45–135 | ||||
prairie sagewort | ARFR4 | Artemisia frigida | 0–45 | – | ||
broom snakeweed | GUSA2 | Gutierrezia sarothrae | 0–45 | – | ||
brittle pricklypear | OPFR | Opuntia fragilis | 0–45 | – | ||
plains pricklypear | OPPO | Opuntia polyacantha | 0–45 | – | ||
Moss
|
||||||
8 | Cryptogams | 45–135 | ||||
lesser spikemoss | SEDE2 | Selaginella densa | 45–135 | – |
Table 10. Community 3.1 plant community composition
Group | Common name | Symbol | Scientific name | Annual production (lb/acre) | Foliar cover (%) | |
---|---|---|---|---|---|---|
Grass/Grasslike
|
||||||
1 | Warm-Season Grasses | 25–75 | ||||
prairie sandreed | CALO | Calamovilfa longifolia | 25–50 | – | ||
sand bluestem | ANHA | Andropogon hallii | 0–25 | – | ||
2 | Grama | 175–250 | ||||
blue grama | BOGR2 | Bouteloua gracilis | 150–250 | – | ||
hairy grama | BOHI2 | Bouteloua hirsuta | 25–150 | – | ||
3 | Needlegrass | 0–25 | ||||
needle and thread | HECOC8 | Hesperostipa comata ssp. comata | 0–25 | – | ||
4 | Miscellaneous Native Grasses | 25–100 | ||||
sand dropseed | SPCR | Sporobolus cryptandrus | 0–50 | – | ||
Grass, perennial | 2GP | Grass, perennial | 0–25 | – | ||
sideoats grama | BOCU | Bouteloua curtipendula | 0–25 | – | ||
prairie Junegrass | KOMA | Koeleria macrantha | 0–25 | – | ||
5 | Perennial Grass-Likes | 0–25 | ||||
sedge | CAREX | Carex | 0–25 | – | ||
Forb
|
||||||
6 | Forbs | 5–50 | ||||
Cuman ragweed | AMPS | Ambrosia psilostachya | 0–25 | – | ||
tarragon | ARDR4 | Artemisia dracunculus | 0–10 | – | ||
lacy tansyaster | MAPI | Machaeranthera pinnatifida | 0–10 | – | ||
goldenrod | SOLID | Solidago | 0–10 | – | ||
Forb, perennial | 2FP | Forb, perennial | 0–10 | – | ||
Shrub/Vine
|
||||||
7 | Shrubs | 25–75 | ||||
broom snakeweed | GUSA2 | Gutierrezia sarothrae | 0–25 | – | ||
brittle pricklypear | OPFR | Opuntia fragilis | 0–25 | – | ||
plains pricklypear | OPPO | Opuntia polyacantha | 0–25 | – | ||
prairie sagewort | ARFR4 | Artemisia frigida | 0–10 | – | ||
Moss
|
||||||
8 | Cryptogams | 75–150 | ||||
lesser spikemoss | SEDE2 | Selaginella densa | 75–150 | – |
Interpretations
Animal community
Grazing by domestic livestock is one of the major income-producing industries in the area. Rangeland in this area may provide year-long forage. During the dormant period, the forage for livestock will likely be lacking protein to meet livestock requirements, and added protein will allow ruminants to better utilize the energy stored in grazed plant materials. A forage quality test (either directly or through fecal sampling) should be used to determine the level of supplementation needed.
Hydrological functions
Water is the principal factor limiting forage production on this site. Meadin and Simeon soils on this site are in Hydrologic Soil Group A. Water transmission through Group A soils is normally greater than 0.30 inches per hour. Runoff is expected to occur only during the most intense storms (refer to Section 4, NRCS National Engineering Handbook for runoff quantities and hydrologic curves).
The high infiltration rate of these sands results in few rills and gullies or water flow patterns even though steep slopes may be included. Pedestals are only slightly present in association with bunchgrasses such as needleandthread. Litter typically falls in place on flat slopes. Chemical and physical crusts are rare to non-existent. Cryptogamic crusts are present but only cover 1-2% of the soil surface. This crusting is not significant for hydrologic considerations. Overall this site has the appearance of being stable and productive.
Recreational uses
This site provides hunting opportunities for upland game species. The wide variety of plants which bloom from spring until fall have an esthetic value that appeals to visitors.
Wood products
No appreciable wood products are present on the site.
Other products
None noted.
Other information
Revision Notes: “This PROVISIONAL ecological site concept has been QC’d and QA’d to ensure that the site meets the NESH standards for a provisional ecological site that provides basic compiled information in one location. This site should not be considered an Approved ESD until further data entry and editing is completed.
Supporting information
Inventory data references
Information presented here has been derived from NRCS clipping data and other inventory data. Field observations from range trained personnel was also used. Those involved in developing this site include: Dave Cook, Rangeland Management Specialist, NRCS; Dwight Hale, Engineer, NRCS; Sheila Luoma, Resource Conservationist, NRCS; Marla Shelbourn, Rangeland Management Specialist, NRCS; Dave Steffen, Rangeland Management Specialist, NRCS.
There is three SCS-RANGE-417 records from Cherry county, Nebraska. The sample period is from 1980 to 1999.
Other references
Other sources used as reference include: USDA NRCS Water & Climate Center, USDA NRCS National Range and Pasture Handbook, USDA NRCS Soil Surveys from various counties, Atlas of the Sandhills.
Site Development and Testing Plan:
Future work is needed to validate the information in this Provisional Ecological Site Description. Additional data collection and evaluation may also be needed to develop this ESD to the Approved, then Correlated level. This could include field activities to collect low, medium and high intensity sampling, soil correlations, and analysis of that data. Field reviews of the project plan should be done by soil scientists and vegetation specialists. A final field review, peer review, quality control, and quality assurance reviews of the ESD will be needed to produce the final document.
The State and Transitional Model and corresponding pathways and associated vegetative communities will need to be reviewed and upgraded to adhere to the new guidelines.
Annual reviews of the Project Plan are to be conducted by the Ecological Site Technical Team. The project plan is: ES- R065XY041NE - MLRA 65 -
Contributors
Kim Stine
Rangeland health reference sheet
Interpreting Indicators of Rangeland Health is a qualitative assessment protocol used to determine ecosystem condition based on benchmark characteristics described in the Reference Sheet. A suite of 17 (or more) indicators are typically considered in an assessment. The ecological site(s) representative of an assessment location must be known prior to applying the protocol and must be verified based on soils and climate. Current plant community cannot be used to identify the ecological site.
Author(s)/participant(s) | Stan Boltz |
---|---|
Contact for lead author | Stan Boltz, stanley.boltz@sd.usda.gov, 605-352-1236 |
Date | 10/31/2001 |
Approved by | Stan Boltz |
Approval date | |
Composition (Indicators 10 and 12) based on | Annual Production |
Indicators
-
Number and extent of rills:
Slight to none, typically on steeper slopes and discontinuous. -
Presence of water flow patterns:
None, or barely visible and discontinuous with numerous debris dams when present. -
Number and height of erosional pedestals or terracettes:
Few pedastalled plants typically on steeper slopes. -
Bare ground from Ecological Site Description or other studies (rock, litter, lichen, moss, plant canopy are not bare ground):
0 to 15 percent is typical. -
Number of gullies and erosion associated with gullies:
None should be present. -
Extent of wind scoured, blowouts and/or depositional areas:
None. -
Amount of litter movement (describe size and distance expected to travel):
Small size litter classes will generally move short distances, some medium size class litter will move very short distances. Litter debris dams are occasionally present. -
Soil surface (top few mm) resistance to erosion (stability values are averages - most sites will show a range of values):
Soil aggregate stability ratings should typically be 5 to 6, normally 6. Surface organic matter adheres to the soil surface. Soil surface fragments will typically retain structure indefinitely when dipped in distilled water. -
Soil surface structure and SOM content (include type of structure and A-horizon color and thickness):
A-horizon should be 2 to 5 inches thick with light to dark brownish gray colors. Structure should typically be fine granular at least in the upper A-horizon. -
Effect of community phase composition (relative proportion of different functional groups) and spatial distribution on infiltration and runoff:
Combination of shallow and deep rooted species (mid & tall rhizomatous and tufted perennial cool- and warm-season grasses) with fine and coarse roots positively influences infiltration. -
Presence and thickness of compaction layer (usually none; describe soil profile features which may be mistaken for compaction on this site):
None. -
Functional/Structural Groups (list in order of descending dominance by above-ground annual-production or live foliar cover using symbols: >>, >, = to indicate much greater than, greater than, and equal to):
Dominant:
Tall, warm-season rhizomatous grasses >Sub-dominant:
Short, warm-season grasses > mid, cool-season bunchgrasses = mid, warm-season bunchgrasses = shrubs >Other:
Grass-like species = forbsAdditional:
Other grasses in other functional groups occur in minor amounts. -
Amount of plant mortality and decadence (include which functional groups are expected to show mortality or decadence):
Very little evidence of decadence or mortality. Bunch grasses have strong, healthy centers and shrubs are vigorous. -
Average percent litter cover (%) and depth ( in):
Litter cover typically 40 to 60 percent, with depth about 0.25 inches. -
Expected annual annual-production (this is TOTAL above-ground annual-production, not just forage annual-production):
Total annual production ranges from 600 to 1,500 pounds/acre, with the reference value being 1,000 pounds/acre (air-dry basis). -
Potential invasive (including noxious) species (native and non-native). List species which BOTH characterize degraded states and have the potential to become a dominant or co-dominant species on the ecological site if their future establishment and growth is not actively controlled by management interventions. Species that become dominant for only one to several years (e.g., short-term response to drought or wildfire) are not invasive plants. Note that unlike other indicators, we are describing what is NOT expected in the reference state for the ecological site:
State and local noxious weeds. -
Perennial plant reproductive capability:
All species exhibit high vigor relative to climatic conditions. Do not rate based solely on seed production. Perennial grasses should have vigorous rhizomes or tillers.
Print Options
Sections
Font
Other
The Ecosystem Dynamics Interpretive Tool is an information system framework developed by the USDA-ARS Jornada Experimental Range, USDA Natural Resources Conservation Service, and New Mexico State University.
Click on box and path labels to scroll to the respective text.