Ecological dynamics
It is impossible to determine in any quantitative detail the Reference State for this ecological site because of the lack of direct historical documentation preceding all human influence. In some areas, the earliest reports of dominant plants include the cadastral survey conducted by the General Land Office, which began in the late 19th century for this area (Galatowitsch 1990). However, up to the 1870s the Shoshone Indians, prevalent in northern Utah and neighboring states, grazed horses and set fires to alter the vegetation for their needs (Parson 1996). In the 1860s, Europeans brought cattle and horses to the area, grazing large numbers of them on unfenced parcels year-long (Parson 1996). Itinerant and local sheep flocks followed, largely replacing cattle as the browse component increased.
Below is a State and Transition Model diagram to illustrate the “phases” (common plant communities), and “states” (aggregations of those plant communities) that can occur on the site. Differences between phases and states depend primarily upon observations of a range of disturbance histories in areas where this ESD is represented. These situations include grazing gradients to water sources, fence-line contrasts, patches with differing dates of fire, herbicide treatment, tillage, etc. Reference State 1 illustrates the common plant communities that probably existed just prior to European settlement.
The major successional pathways within states, (“community pathways”) are indicated by arrows between phases. “Transitions” are indicated by arrows between states. The drivers of these changes are indicated in codes decipherable by referring to the legend at the bottom of the page and by reading the detailed narratives that follow the diagram. The transition between Reference State 1 and State 2 is considered irreversible because of the naturalization of exotic species of both flora and fauna, possible extinction of native species, and climate change. There may have also been accelerated soil erosion.
When available, monitoring data (of various types) were employed to validate more subjective inferences made in this diagram. See the complete files in the office of the State Range Conservationist for more details.
The plant communities shown in this State and Transition Model may not represent every possibility, but are probably the most prevalent and recurring plant communities. As more monitoring data are collected, some phases or states may be revised, removed, or new ones may be added. None of these plant communities should necessarily be thought of as “Desired Plant Communities.” According to the USDA NRCS National Range & Pasture Handbook (USDA-NRCS 2003), Desired Plant Communities (DPC’s) will be determined by the decision-makers and will meet minimum quality criteria established by the NRCS. The main purpose for including descriptions of a plant community is to capture the current knowledge at the time of this revision.
State 1
Reference State
The Reference State is a description of this ecological site just prior to Euro-American settlement but long after the arrival of Native Americans. The description of the Reference State was determined by NRCS Soil Survey Type Site Location information and familiarity with rangeland relict areas where they exist. The Reference State for this site would have been a shrub steppe characterized by early sagebrush (Artemisia arbuscula spp. longiloba) and associated native perennial forbs and grasses. A more complete list of species by lifeform for the Reference State is available in the accompanying tables in the “Plant Community Composition by Weight and Percentage” section of this document.
Community 1.1
Reference State
Community Phase 1.1: early sagebrush/ native perennial herbs
This plant community would have been a shrub steppe characterized by early sagebrush and associated native perennial herbs. The primary perennial grasses would have included western wheatgrass (Pascopyrum smithii), bluebunch wheatgrass (Pseudoroegneria spicata), squirreltail (Elymus elymoides), Indian ricegrass (Achnatherum hymenoides), and needle-and-thread (Hesperostipa comata). Common forbs would have included shortstem buckwheat (Eriogonum brevicaule), Tolmie’s owl’s-clover (Orthocarpus tolmiei), Cushion phlox (Phlox spp.), and longleaf phlox (Phlox longifolia).
Table 5. Annual production by plant type
| Plant type |
Low
(lb/acre) |
Representative value
(lb/acre) |
High
(lb/acre) |
| Grass/Grasslike |
350 |
425 |
550 |
| Shrub/Vine |
350 |
425 |
500 |
| Forb |
45 |
115 |
185 |
| Total |
745 |
965 |
1235 |
Table 6. Ground cover
| Tree foliar cover |
0%
|
| Shrub/vine/liana foliar cover |
35-40%
|
| Grass/grasslike foliar cover |
18-20%
|
| Forb foliar cover |
4-6%
|
| Non-vascular plants |
0%
|
| Biological crusts |
5-7%
|
| Litter |
8-10%
|
| Surface fragments >0.25" and <=3" |
0%
|
| Surface fragments >3" |
0%
|
| Bedrock |
0%
|
| Water |
0%
|
| Bare ground |
8-10%
|
Table 7. Canopy structure (% cover)
| Height Above Ground (ft) |
Tree |
Shrub/Vine |
Grass/
Grasslike |
Forb |
| <0.5 |
– |
– |
– |
– |
| >0.5 <= 1 |
– |
– |
– |
4-6% |
| >1 <= 2 |
– |
– |
24-26% |
– |
| >2 <= 4.5 |
– |
34-36% |
– |
– |
| >4.5 <= 13 |
– |
– |
– |
– |
| >13 <= 40 |
– |
– |
– |
– |
| >40 <= 80 |
– |
– |
– |
– |
| >80 <= 120 |
– |
– |
– |
– |
| >120 |
– |
– |
– |
– |
State 2
Early Sagebrush/ Introduced Herb State
State 2 is very similar to State 1 in form and function, with the exception of the presence of exotic plants and animals, possible extinctions of native species, and a different climate. State 2 is a description of the ecological site shortly following Euro-American settlement. This state can be regarded as the current potential. State 2 is dominated by early sagebrush and associated native perennial herbs with a small component of introduced species such as cheatgrass (Bromus tectorum) and Russian thistle (Salsola spp). The primary perennial grasses include western wheatgrass (Pascopyrum smithii), bluebunch wheatgrass (Pseudoroegneria spicata), squirreltail (Elymus elymoides), Indian ricegrass (Achnatherum hymenoides), needle and thread (Hesperostipa comata), smooth brome (Bromus inermis), and Sandberg’s bluegrass (Poa secunda). Common forbs include short-stem buckwheat (Eriogonum brevicaule), Tolmie’s owl’s-clover (Orthocarpus tolmiei), and longleaf phlox (Phlox longifolia). The resiliency of this State is maintained by a healthy, productive, and diverse plant community that can provide native seed sources and promotes soil stability, water infiltration, and soil moisture retention. The resiliency of this state will be negatively impacted by continued heavy growing season livestock grazing. Mechanical or chemical shrub control or prescribed burning is not recommended because high soil erosion potential and poor biological and economic responses, especially on steep slopes. This site should be reseeded with native perennial herbs quickly after fire or mechanical disturbances.
Community 2.1
Early Sagebrush/ Introduced Herb State
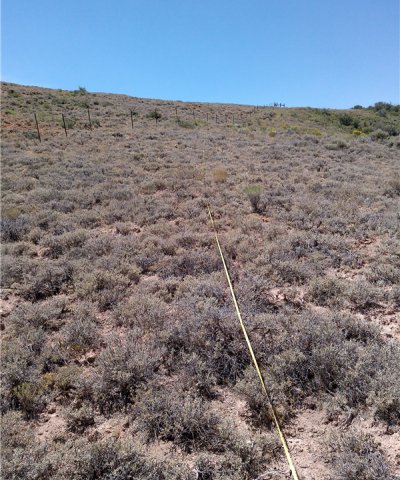
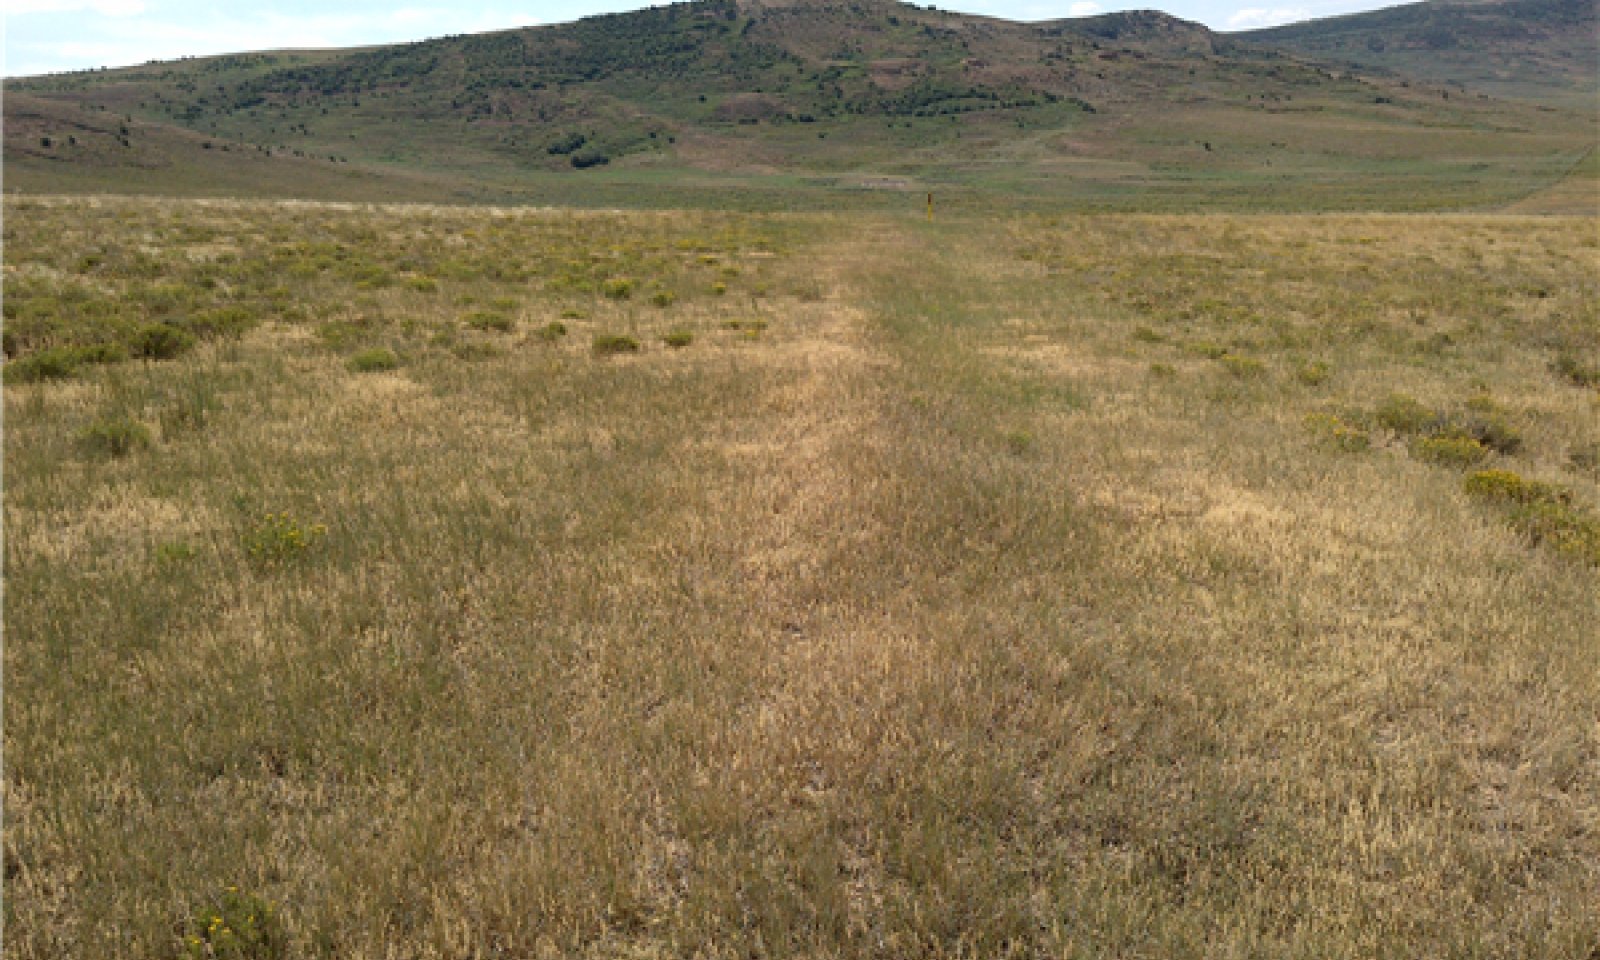
Figure 6. State 2
Community Phase 2.1: early sagebrush/ bunch and rhizomatous grasses co-dominant
This plant community is characterized by early sagebrush and native perennial herbs. Some non-native herbaceous species such as cheatgrass may be present. The phase is fully functioning as it relates to soil & site stability, hydrologic function and biotic integrity. This phase represents a relatively equal abundance of rhizomatous and bunch grasses.
Community 2.2
Early sagebrush with depleted understory/rhizomatous grasses greater than bunch grasses
Community Phase 2.2: Early sagebrush with depleted understory/rhizomatous grasses greater than bunch grasses
This plant community is characterized by increasing dominance of larger, older shrubs, and rhizomatous grasses becoming more dominant than the bunch grasses due to the bunch grasses being more susceptible to grazing. Soil erosion is accelerated because of increased bare ground, water flow patterns and pedestals become more abundant. Although the overall functionality of the site is still intact, it is at risk with further degradation.
Community 2.3
Shrub-dominated Community
Community Phase 2.3: This plant community is characterized by increasing dominance of larger, older shrubs, and bunch grasses becoming more dominant than rhizomatous grasses. With the plant interspaces becoming larger from the reduction of rhizomatous grasses, soil erosion may accelerate because of the increased bare ground. Water flow patterns and pedestals become more abundant. Although the overall functionality of the site is still intact, it is at risk with further degradation.
Community 2.4
Herbaceous-dominated
Community Phase 2.4: This Phase will have a significantly reduced sagebrush composition that has shifted to a native or introduced herbaceous species dominated site. Depending on the health/vigor of the understory herbaceous species, a rangeland seeding may be necessary.
Pathway CP2.1-2.2
Community 2.1 to 2.2
Community Pathway 2.1-2.2: This pathway is triggered when the site is exposed to heavy continued season-long grazing by livestock and big game (elk).
Pathway CP2.1-2.3
Community 2.1 to 2.3
Community Pathway 2.1-2.3: This pathway is triggered when the site is protected from grazing and/or fire.
Pathway CP2.1-2.4
Community 2.1 to 2.4
Community Pathway 2.1-2.4: This pathway is triggered when the site has brush management applied (chemical, mechanical, or fire).
Pathway CP2.2-2.1
Community 2.2 to 2.1
Community Pathway 2.2-2.1: This pathway is triggered when the site is restored due to the implementation of prescribed grazing.
Pathway CP2.3-2.1
Community 2.3 to 2.1
Community Pathway 2.3-2.1: This pathway is triggered when the site is restored due to the implementation of prescribed grazing and prescribed burns to manage brush.
Pathway CP2.4-2.1
Community 2.4 to 2.1
Community Pathway 2.4-2.1: This Phase (2.4) will be re-invaded by sagebrush at a rate dependent upon levels of grazing use and climatic conditions.
State 3
Disturbed State
State 3: Disturbed State
Due to extent of the disturbance, this site has become extremely susceptible to accelerated erosion due to the complete loss of the vegetative community.
Community 3.1
Reclaimed Phase

Figure 7. State 3
Community Phase 3.1: This Phase is dominated by native and/or introduced grasses and forbs that used in the reclamation process.
Community 3.2
Recovered Phase
Community Phase 3.2: This Phase occurs on sites that overtime have sagebrush moving back into them. The Phase is characterized by still being dominated by perennial herbaceous vegetation with a minor component of early sagebrush recolonizing the site.
Pathway CP3.1-3.2
Community 3.1 to 3.2
Community Pathway 3.1-3.2: This Pathway occurs in this State when over time through natural succession along with utilizing prescribed grazing or non-use.
Pathway CP3.2-3.1
Community 3.2 to 3.1
Community Pathway 3.2-3.1: By implementing brush management or through natural or prescribed fire, this Phase (3.2) will return to Phase 3.1.
Transition T1.1-2.1
State 1 to 2
T1.1-2.1: Transition from State 1 to State 2 (Reference State to Early Sagebrush/ Introduced Herb State)
The simultaneous introduction of exotic species, both plants and animals, and possible extinctions of native flora and fauna, along with climate change, has caused State 1 to transition to State 2. Reversal of such historic changes (i.e. a return pathway) back to State 1 is not practical.
Transition T2-3.1
State 2 to 3
T2-3.1: Transition from State 2 to State 3 (Early Sagebrush/Introduced Herbaceous Species/Disturbed State)
This transition occurs when the site experiences a disturbance such as the use of excavation equipment.