
Natural Resources
Conservation Service
Ecological site R051XY263CO
Salt Flats
Last updated: 12/11/2024
Accessed: 12/22/2024
General information
Provisional. A provisional ecological site description has undergone quality control and quality assurance review. It contains a working state and transition model and enough information to identify the ecological site.
MLRA notes
Major Land Resource Area (MLRA): 051X–High Intermountain Valleys
This MLRA encompasses the San Luis Valley in south central Colorado and the Taos Plateau and Taos alluvial fans of north central New Mexico. As part of the northern portion of the Rio Grande Rift, the MLRA consists of large, alluvium filled basins washed down from adjacent mountain ranges. The Rio Grande River flows through this MLRA, continuing its long function of carrying mountain sediment down into the basin. Cenozoic volcanism is an extensive characteristic of the MLRA where large basalt flows with volcanic hills and domes are abundant.
Classification relationships
NRCS:
Major Land Resource Area 51, High Intermountain Valleys (United States Department of Agriculture, Natural Resources Conservation Service, 2006).
USFS:
331J – Northern Rio Grande Basin M331Ic > 331Ja - San Luis Valley, 331Jb - San Luis Hills and 331C - Mogotes
EPA:
22 - Arizona/New Mexico Plateau > 22a - San Luis Shrublands and Hills ; 22b -San Luis Alluvial Flats and Wetlands ; 22c - Salt Flats; 22e - Sand Dunes and Sand Sheets and 22f -Taos Plateau (Griffith, 2006).
USGS:
Southern Rocky Mountain Province
Ecological site concept
This site occurs on the alluvial flat of the San Luis valley basin floor. Topography is nearly level over most of the site, gently sloping in places with only minor irregularities.Plant composition and frequency are influenced by a fluctuating water table which will limit effective rooting depth. Soils contain salts and alkali, with pH ranging from 7.9 to 9.6.
Associated sites
| R051XY314CO |
Alkali Overflow Salt Flats are found adjacent to and on slightly higher ground than Alkali Overflow sites which are mostly found north east of the city of Alamosa around the Blanca Wetlands and San Luis Lake. The alkali overflow occupies the playa on the basin floor. |
|---|---|
| R051XY315CO |
Wet Meadow 6-10 PZ The Wet Meadow site is a very common neighboring site across the basin. The salt flats are islands on elevated ground interspersed within many of these meadows. The Wet Meadow exists where a drainage cuts through the aluvial flat. |
| R051XY276CO |
Limy Bench The Salt Flats site grades into the Limy Bench site as elevation slightly increases on the north and northwest portion of the basin. The Limy Bench site is on the alluvial fans while the Salt Flats is on the basin floor. |
| R051XY267CO |
Salt Meadow Salt Meadows are located on ground slightly lower than Salt Flats and are influenced by a higher water table. |
| R051XY312CO |
Sand Hummocks Sand hummocks occupies the playa dune on the basin floor. Salt flats exist on the alluvial flat. |
| R051XY264CO |
Chico Land Chico land occurs in association with salt flats. It is higher in alkalinity, exhibiting more slick spot areas. |
| R051XY294CO |
Valley Sand The Valley Sand exists on the basin floor where soils are course-textured. |
Similar sites
| R051XY314CO |
Alkali Overflow Salt Flats are found adjacent to and on slightly higher ground than Alkali Overflow sites which are mostly found north east of the city of Alamosa around the Blanca Wetlands and San Luis Lake. The alkali overflow occupies the playa on the basin floor. |
|---|---|
| R051XY267CO |
Salt Meadow Salt Meadows are located on ground slightly lower than Salt Flats and are influenced by a higher water table. |
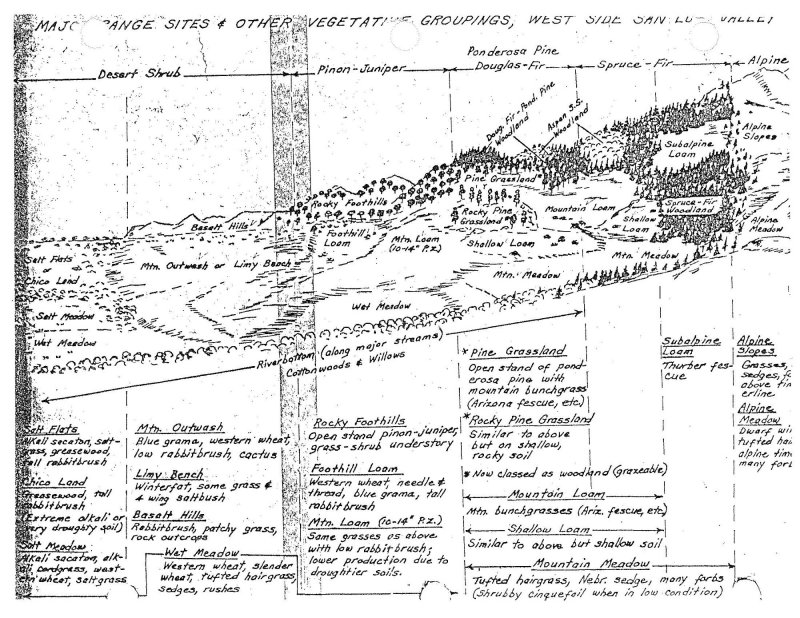
Figure 1.
Table 1. Dominant plant species
| Tree |
Not specified |
|---|---|
| Shrub |
(1) Sarcobatus vermiculatus |
| Herbaceous |
(1) Sporobolus airoides |
Physiographic features
This site is found in pockets throughout the San Luis Valley in what was once ancient lake Alamosa. It occurs on the alluvial flat of the basin floor. Topography is nearly level over most of the site, gently sloping in places with only minor irregularities. Slopes are mostly 0-1%, extending up to 3% in a few places.
Table 2. Representative physiographic features
| Landforms |
(1)
Alluvial fan
(2) Valley floor (3) Flood plain (4) Stream terrace (5) Fan |
|---|---|
| Runoff class | Low to medium |
| Flooding duration | Very brief (4 to 48 hours) |
| Flooding frequency | None to rare |
| Ponding frequency | None |
| Elevation | 2,286 – 2,469 m |
| Slope | 1 – 3% |
| Water table depth | 91 – 183 cm |
| Aspect | Aspect is not a significant factor |
Climatic features
The climate that typifies the High Intermountain Valley, ranges from arid to semi-arid, and is characterized by cold winters, moderate summers, and much sunshine. Average annual precipitation ranges from 6 to 8 inches along the valley floor and throughout most of the resource area. Approximately 55 percent of the annual precipitation falls between May 1 and September 1. May and June are normally dry. Precipitation comes mostly from short duration high intensity thundershowers in July and August. Wide seasonal and yearly variations are common. The San Juan mountain range to the west and the Sangre de Cristo Mountains to the east intercept much of the precipitation causing a two-way rain shadow effect. Most major plant species initiate growth between mid May and late July, but growth may extend into September. Some cool season plants begin growth earlier and complete growth by mid June. There may be late re-growth on some of the plants.
Cold air from the encompassing mountain ranges drain into the valley and settle. This phenomena results in long cold winters and moderate summer temperatures. Mean average annual temperature ranges between 42 to 44 degrees F. July is the hottest month and January is the coldest. Summer temperatures range from highs in the upper 70’s and low 80’s and occasionally reach to the mid 90 degrees F. Summer nights are cool. Temperatures of -20 degrees F to -30 degrees F can be expected each year and are common during some winters. Average frost-free period is 90-115 days, from late May or early June to September.
Wind that often reaches high velocities are common, especially in the spring. Relative humidity is usually low. Even so, evaporation rates average lower than those of many dry regions because of the cooler climate. Snow cover is often light and is sometimes lacking through much of the winter. There is usually some snow, though, during the coldest weather.
Table 3. Representative climatic features
| Frost-free period (characteristic range) | 69 days |
|---|---|
| Freeze-free period (characteristic range) | 93 days |
| Precipitation total (characteristic range) | 152-203 mm |
| Frost-free period (actual range) | 69 days |
| Freeze-free period (actual range) | 93 days |
| Precipitation total (actual range) | 152-203 mm |
| Frost-free period (average) | 69 days |
| Freeze-free period (average) | 93 days |
| Precipitation total (average) | 178 mm |
Figure 2. Monthly precipitation range
Figure 3. Monthly minimum temperature range
Figure 4. Monthly maximum temperature range
Figure 5. Monthly average minimum and maximum temperature
Figure 6. Annual precipitation pattern
Figure 7. Annual average temperature pattern
Climate stations used
-
(1) ALAMOSA SAN LUIS AP [USW00023061], Alamosa, CO
Influencing water features
This site is influenced by a fluctuating high water table, usually between 3 and 6 feet, which will limit effective rooting depth and has an effect on plant composition and frequency. Water table is generally present May, June, July, August and occasionally in April and September.
Soil features
Soils contain salts and alkali, with pH ranging from 7.9 to 9.6. There is also a fluctuating water table, usually within 3 to 6 feet of the surface, but sometimes dropping lower or rising slightly higher. Surface clay content usually ranges from 15 to 25% clay and subsurface clay content at 20 inches ranges from 20 to 30% clay. Some soils have gypsum present in them which will influence the some properties of the soil. Some atypical soils correlated to this site are sandy throughout the profile; some have a few inches of loamy sand or loam over heavy, very slowly permeable material. The restricted features occur in some soils is a strongly contrasting textural stratification (fine-loamy over sandy or sandy-skeletal particle control size) or a cemented horizon. The restrictive features start between 20 to 60 inches in depth. Hooper and San Luis are examples of soils with the contrasting textural stratification. Arena is an example of a soil correlated to this site with a cemented horizon.
Water available to plant roots is determined by combined effect of low precipitation, depth to water table, and permeability of the soil; as well as limitations due to salt and alkali. Thus, the natural plant community is similar in spite of wide variations in water-holding capacity.
These soils are subject to water erosion on a few sloping areas. Otherwise, erosion is not an issue under native cover, but many of the soils blow easily if cover is destroyed. Areas of slow permeability and dispersed soils, on which considerable puddling occurs, may be interspersed on these sites. Cover on such areas is sparse, consisting almost entirely of greasewood.
Typical Soils correlated to this site are:
Acacio, Arena, Crestvale, Hooper, Laney, Mogote, San Arcacio, San Luis, Villa Grove, and Zinzer
Table 4. Representative soil features
| Parent material |
(1)
Alluvium
–
basalt
(2) Alluvium – volcanic rock (3) Alluvium |
|---|---|
| Surface texture |
(1) Loam (2) Sandy loam (3) Loamy sand (4) Sandy clay loam |
| Family particle size |
(1) Fine-loamy (2) Fine-loamy over sandy or sandy-skeletal |
| Drainage class | Somewhat poorly drained to well drained |
| Permeability class | Very slow to moderate |
| Depth to restrictive layer | 51 – 152 cm |
| Soil depth | 152 – 254 cm |
| Surface fragment cover <=3" | 0 – 10% |
| Surface fragment cover >3" | 0 – 2% |
| Available water capacity (Depth not specified) |
7.62 – 17.78 cm |
| Calcium carbonate equivalent (Depth not specified) |
0 – 15% |
| Electrical conductivity (Depth not specified) |
2 – 16 mmhos/cm |
| Sodium adsorption ratio (Depth not specified) |
0 – 20 |
| Soil reaction (1:1 water) (Depth not specified) |
7.9 – 9.6 |
| Subsurface fragment volume <=3" (Depth not specified) |
5 – 35% |
| Subsurface fragment volume >3" (Depth not specified) |
0 – 3% |
Ecological dynamics
Excessive and repetitive defoliation of palatable species will cause alkali sacaton, alkali cordgrass, alkali wildrye, and western wheatgrass to decrease in frequency and production while inland saltgrass increases. In time, the plant community will become dominated by an understory of inland saltgrass with a rabbitbrush/greasewood overstory. Long-term livestock use that is repetitive and coupled with high utilization will ultimately result in a plant community dominated by greasewood with an understory of annual invaders and increased bareground or slick spots. Excessive litter, plant mortality and decadence can result from the lack of fire and/or non-use.
Tillage or any type of mechanical treatment is not recommended on this site since it will increase inland saltgrass and stimulate rabbitbrush growth. Applied irrigation water shifts the sacaton, greasewood, rabbitbrush community to a Baltic rush dominated plant community.
State and transition model
More interactive model formats are also available.
View Interactive Models
Click on state and transition labels to scroll to the respective text
State 2 submodel, plant communities
State 3 submodel, plant communities
State 4 submodel, plant communities
State 1
Reference
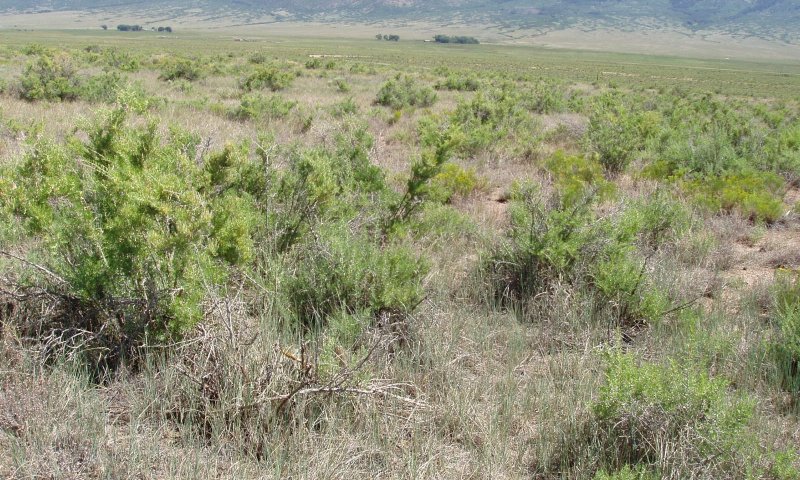
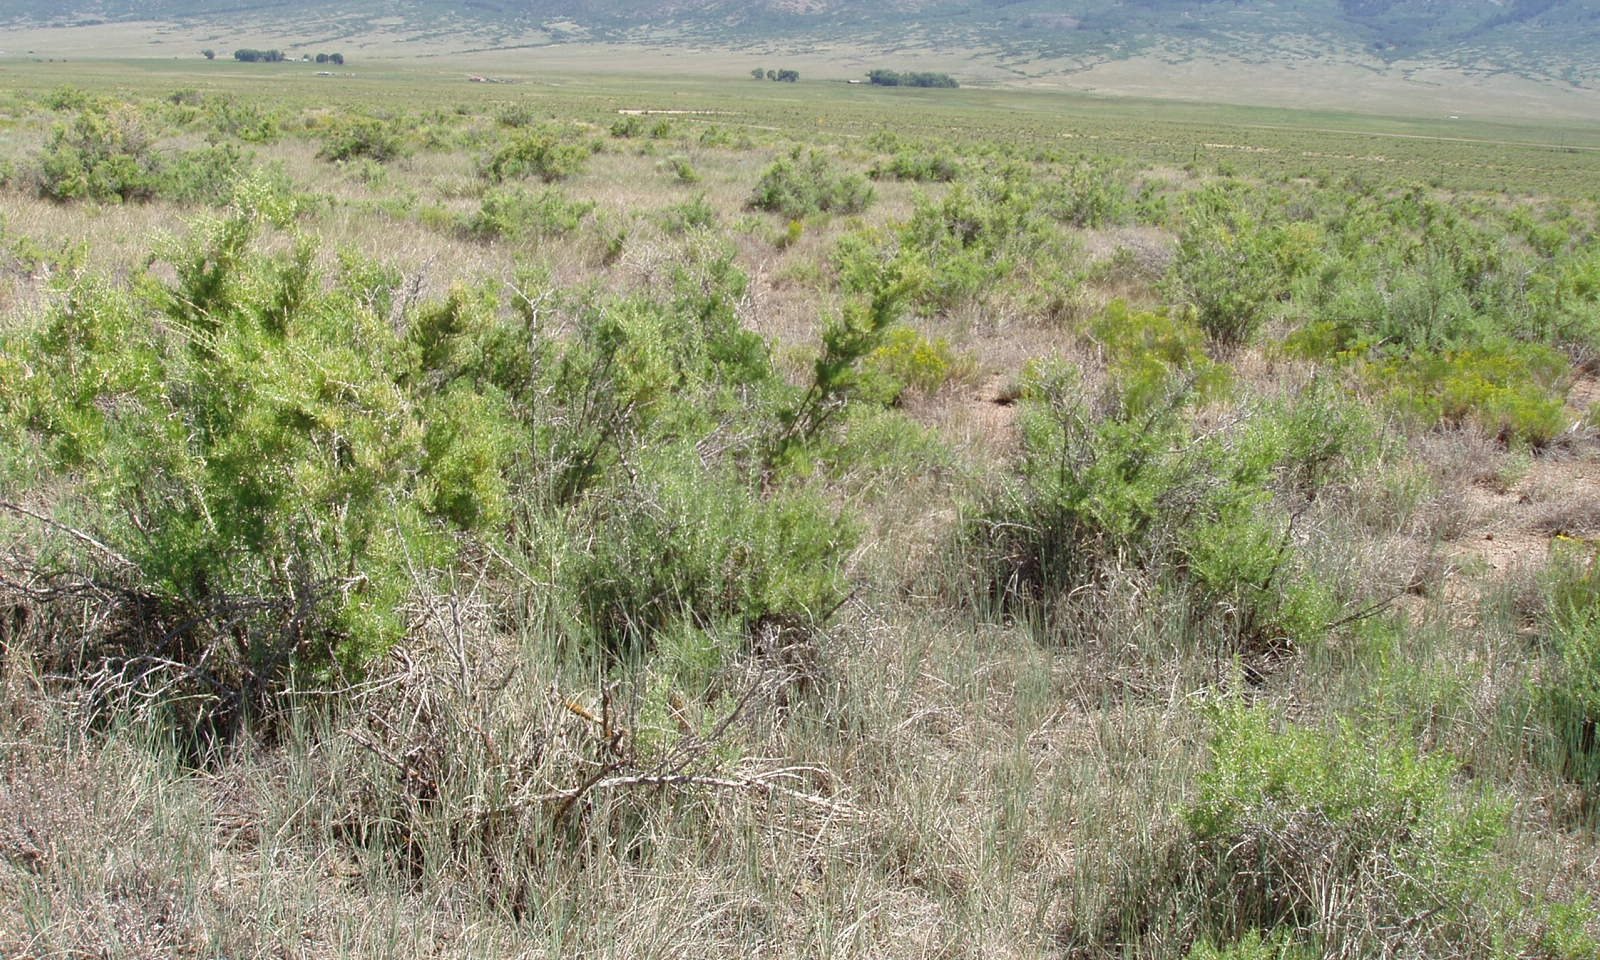
Figure 8. Reference State: Diverse warm season grasses and shrubs
The reference state has an abundance of tall warm season grasses with a mix of shrubs and forbs. Community phases capture the ebb and flow of shrubs and grasses due to disturbance and time.
Community 1.1
Warm Season Grasses and Shrub Mix

Figure 9. West of Villa Grove
This community phase evolved with grazing by herbivores such as bison and elk and is well suited for grazing by wildlife and livestock. It can be found on areas that are carefully managed to allow palatable species an opportunity to grow, colonize, and produce annual root stock. . Principle dominant plants include: alkali sacaton, alkali wildrye, and alkali cordgrass. Grasses of secondary importance include: western wheatgrass, inland saltgrass, and blue grama. Key forbs and shrubs include: American licorice, scarlet globemallow, black greasewood and rubber rabbitbrush. Secondary shrubs such as fourwing saltbush and Greene’s rabbitbrush are present but not significant. Forbs are sparse. The reference community phase structural/functional composition is about 70% grasses and grass-likes, 5% forbs, and 25% shrubs. This community phase is stable and productive. Litter is properly distributed with very little movement off-site and natural plant mortality is low. Slick spots (bare exposed areas, high in sodium) are an inherent characteristic occupying less than 3% of the community. This is a sustainable plant community in terms of soil stability, watershed function, and biological integrity.
Resilience management. This community phase shows the highest resilience to disturbance. A diversity of root systems, cover, and stable soil act as a hedge to drought and disease.
Dominant plant species
-
greasewood (Sarcobatus vermiculatus), shrub
-
rubber rabbitbrush (Ericameria nauseosa), shrub
-
alkali sacaton (Sporobolus airoides), grass
-
alkali wildrye (Leymus simplex), grass
-
alkali cordgrass (Spartina gracilis), grass
Figure 10. Annual production by plant type (representative values) or group (midpoint values)
Table 5. Annual production by plant type
| Plant type | Low (kg/hectare) |
Representative value (kg/hectare) |
High (kg/hectare) |
|---|---|---|---|
| Grass/Grasslike | 471 | 706 | 942 |
| Shrub/Vine | 168 | 252 | 336 |
| Forb | 34 | 54 | 67 |
| Total | 673 | 1012 | 1345 |
Figure 11. Plant community growth curve (percent production by month). CO5107, Warm season dominant, cool season sub-dominant; MLRA-51; valley floor-alkaline soils..
| Jan | Feb | Mar | Apr | May | Jun | Jul | Aug | Sep | Oct | Nov | Dec |
|---|---|---|---|---|---|---|---|---|---|---|---|
| J | F | M | A | M | J | J | A | S | O | N | D |
| 0 | 0 | 0 | 3 | 30 | 25 | 20 | 12 | 10 | 0 | 0 | 0 |
Community 1.2
Low Stature Warm Season Grass and Increased Rabbitbrush
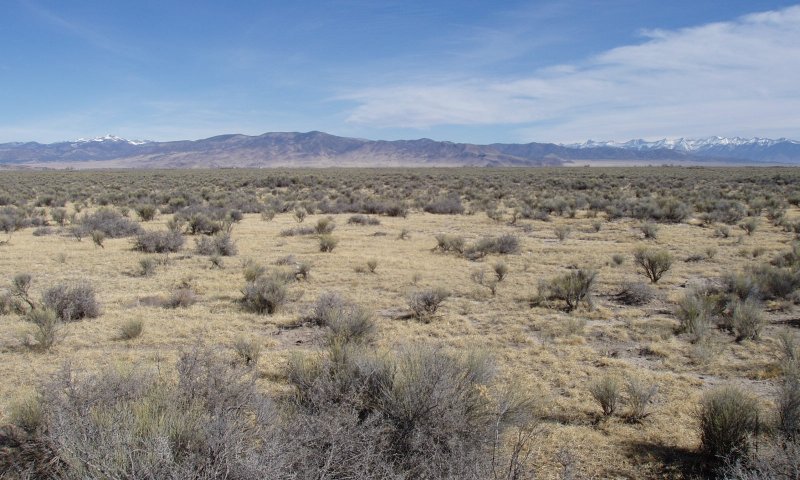
Figure 12. South of Saguache
This is an "at risk" community phase where palatable species such as alkali sacataon and alkali wildrye have decreased, and lesser palatable species such as inland saltgrass and rubber rabbitbrush have increased. Inland saltgrass has increased, and with its dense root system dominates the community. Rubber rabbitbrush is increasing in abundance. Alkali sacaton, alkali cordgrass, western wheatgrass, and alkali wildrye have been significantly reduced. Forbs are still present in reduced amounts. Greasewood is beginning to be hedged while fourwing saltbush decreases in abundance. This plant community is at risk of losing key warm and cool season grasses, palatable forbs, and shrubs. The plants within this community have decreased in frequency and production. Less litter can be expected, however the soil remains stable.
Resilience management. As inland saltgrass becomes more dominant, there is greater resistance of movement toward the reference community phase and the site is more prone to cross a threshold.
Dominant plant species
-
rubber rabbitbrush (Ericameria nauseosa), shrub
-
greasewood (Sarcobatus vermiculatus), shrub
-
saltgrass (Distichlis spicata), grass
Figure 13. Plant community growth curve (percent production by month). CO5107, Warm season dominant, cool season sub-dominant; MLRA-51; valley floor-alkaline soils..
| Jan | Feb | Mar | Apr | May | Jun | Jul | Aug | Sep | Oct | Nov | Dec |
|---|---|---|---|---|---|---|---|---|---|---|---|
| J | F | M | A | M | J | J | A | S | O | N | D |
| 0 | 0 | 0 | 3 | 30 | 25 | 20 | 12 | 10 | 0 | 0 | 0 |
Community 1.3
Excessive Plant Litter and Low Plant Density
Increased Plant Litter, Low Plant Density, High Vigor Greasewood Plant Community This plant community occurs when livestock is removed for long periods of time in the absence of fire. Plant composition is similar to reference, however individual species production and density will be lower. High vigor black greasewood is an obvious indicator of non-use. Much of the nutrients are tied up in excessive litter. The semiarid environment and the absence of animal traffic to break down litter slow nutrient cycling. Aboveground litter also limits sunlight from reaching plant crowns. Many plants, especially bunchgrasses die off under these condtions. A thick mat of litter along with absence of grazing animals (animal impact) or fire reduce seed germination and establishment. In advanced stages, plant mortality can increase and erosion may eventually occur if bare ground increases. Once this happens it will require increased energy input in terms of practice cost and management to move back toward reference. .
Dominant plant species
-
greasewood (Sarcobatus vermiculatus), shrub
Pathway 1.1A
Community 1.1 to 1.2


Repetitive defoliation with high utilization of palatable species throughout the growing season will eventually weaken vigor and density and lead toward a shift to species that have greater defenses or adaptability toward grazing.
Pathway 1.1B
Community 1.1 to 1.3
Non-use (rest) or absence of fire will alter this plant community to one where litter build-up decreases sunlight to the crown and slows annual bud initiation. These decreases basal density and ultimately decreases nutrient cycling for the site.
Pathway 1.2A
Community 1.2 to 1.1


A change in livestock management where palatable species have an opportunity to grow, set seed, and re-colonize. This coupled with an average to above average moisture season will help the site to recover.
Pathway 1.3A
Community 1.3 to 1.1
Resuming livestock management with careful monitoring of litter and species composition along with adaptive management will help the management process.
State 2
Disturbed
Community 2.1
Saltgrass, Rabbitbrush, and Hedged Greasewood
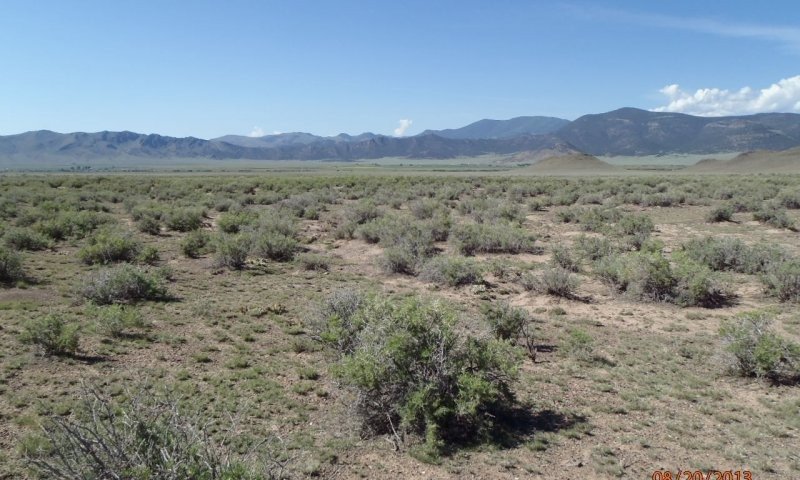
Figure 14. Disturbed: saltgrass-rabbitbrush-hedged greasewood community
This state is dominated by Inland Saltgrass, Rubber Rabbitbrush, and “Hedged” Greasewood with Increased Bare Ground and Slick Spots. Inland saltgrass and rubber rabbitbrush have increased while the greasewood has taken on a hedged appearance through heavy browsing. Bare ground has increased as well as slick spots (bare high sodium areas). Most, if not all, of the reference state grasses have been eliminated. Annuals such as kochia, lambsquarters, Russian thistle, tansy mustard, and pepperweed have invaded the community. Compared with production at reference conditions, perennial species diversity, and frequency has been significantly reduced. Litter amounts are low due to the loss of perennial production. Bare ground is obvious and erosion is a concern. Water and nutrient cycles are impaired. Reduction of mid cool and warm season bunch grasses, and dominance of warm season short rhizomatous grass has altered the biotic integrity of this community.
State 3
Degraded
Community 3.1
Decadent Greasewood with Sparce Understory
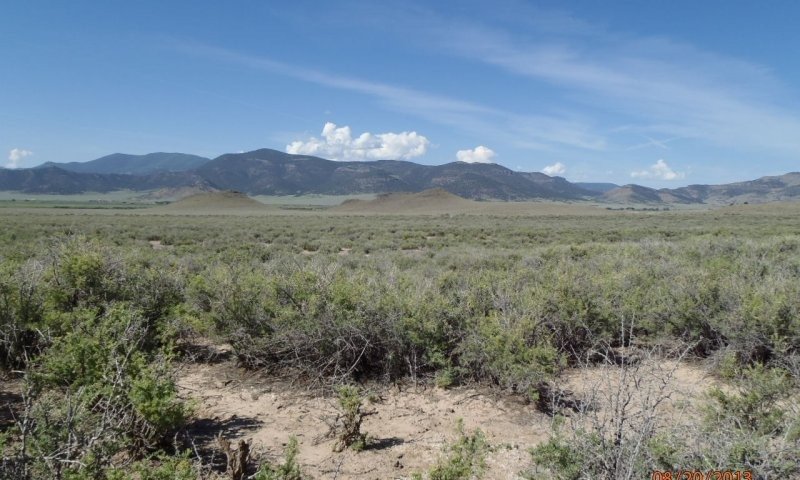
Figure 15. Degraded Decadent Greasewood, with little to no understory
The community is dominated by decadent greasewood with remnant inland saltgrass and rubber rabbitbrush. Slick spots and bare ground exist at previous levels or have increased slightly. Soil crusts are eminent and plant germination has all but ceased. This community is in a state of suspended animation. Decadence and mortality are evident. Hydrologic cycle and nutrient cycles have shut down. The semiarid environment, alkalinity, and the absence of animal traffic to break soil crusts and incorporate litter keep this community at a stand still. There is no practical means for restoring reference condition.
State 4
Irrigation Water Influenced
Community 4.1
Irrigation Water Influenced
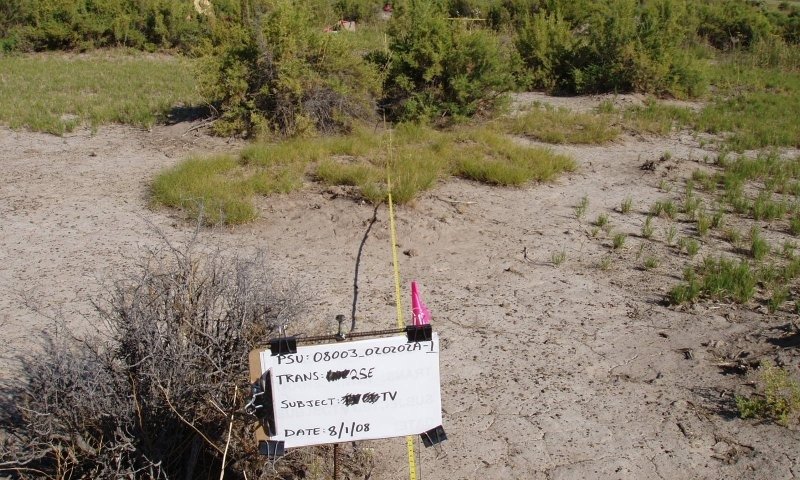
Baltic rush and inland saltgrass is common. Rubber rabbitbrush remains scattered. Foxtail barley, poverty weed, and alkali muhly will increase in abundance. Invasive perennials that could be present are Swainson pea, Russian knapweed, and whitetop. This state is patchy with alkali sacaton and shrubs still present on the high ground and minimal vegetation throughout the low ground.
Transition T1A
State 1 to 2
This threshold was crossed as long-term repetitive defoliation at high utilization of palatable species have led a loss of bunch grasses and greasewood has lost vigor. Inland saltgrass and rubber rabbitbrush have increased while greasewood has taken on a hedged appearance through heavy browsing. Bare ground has increased as well as slick spots (bare high sodium areas). Most, if not all, of the reference grasses have been eliminated.
Transition T1B
State 1 to 4
Introduction of irrigation water on this site, produces a plant community dominated by rushes and sedges. Greasewood and alkali sacaton will disappear from lower areas and reside on higher ground.
Restoration pathway R2A
State 2 to 1
If livestock grazing is re-instituted, very long-term, careful livestock management with adequate recovery opportunities for key species, especially alkali sacaton along with low to moderate utilization will slowly shift this plant community toward the Increased saltgrass and rubber rabbitbrush; community phase within the reference state. This is a slow process and may take upward of 80 years or more to achieve. Monitoring trend in species composition along with applying adaptive management is important.
Transition T2A
State 2 to 3
This site started as the hedged state, then livestock is removed due to little forage availability. There is not enough fuel to carry a fire and the greasewood becomes decadent. There is no practical means of reversing the transition. Excessive soil erosion has increased the area of high clay and salty slick spots making plant colonization extremely difficult.
Restoration pathway R4A
State 4 to 1
Non-irrigation and time for re-colonization of species. If livestock grazing is re-implemented then careful grazing management will eventually shift this community back to the reference state. The seed source is still present on higher ground and should begin to colonize the lower areas. Monitoring of key species is important for success.
Additional community tables
Table 6. Community 1.1 plant community composition
| Group | Common name | Symbol | Scientific name | Annual production (kg/hectare) | Foliar cover (%) | |
|---|---|---|---|---|---|---|
|
Grass/Grasslike
|
||||||
| 1 | Grasses & Grass-Likes | 656–807 | ||||
| alkali sacaton | SPAI | Sporobolus airoides | 303–504 | – | ||
| alkali wildrye | LESI5 | Leymus simplex | 101–202 | – | ||
| western wheatgrass | PASM | Pascopyrum smithii | 50–101 | – | ||
| alkali cordgrass | SPGR | Spartina gracilis | 50–101 | – | ||
| saltgrass | DISP | Distichlis spicata | 30–71 | – | ||
| blue grama | BOGR2 | Bouteloua gracilis | 0–50 | – | ||
| Grass, perennial | 2GP | Grass, perennial | 0–30 | – | ||
| scratchgrass | MUAS | Muhlenbergia asperifolia | 10–30 | – | ||
| prairie wedgescale | SPOB | Sphenopholis obtusata | 0–20 | – | ||
| squirreltail | ELELE | Elymus elymoides ssp. elymoides | 0–10 | – | ||
| sedge | CAREX | Carex | 0–10 | – | ||
|
Forb
|
||||||
| 2 | Forbs | 10–50 | ||||
| Forb, perennial | 2FP | Forb, perennial | 0–30 | – | ||
| American licorice | GLLE3 | Glycyrrhiza lepidota | 10–30 | – | ||
| scarlet globemallow | SPCO | Sphaeralcea coccinea | 10–20 | – | ||
| Pursh seepweed | SUCA2 | Suaeda calceoliformis | 10–20 | – | ||
| povertyweed | IVAX | Iva axillaris | 0–10 | – | ||
| Rocky Mountain beeplant | CLSE | Cleome serrulata | 0–10 | – | ||
|
Shrub/Vine
|
||||||
| 3 | Shrubs | 202–303 | ||||
| greasewood | SAVE4 | Sarcobatus vermiculatus | 101–202 | – | ||
| rubber rabbitbrush | ERNAC2 | Ericameria nauseosa ssp. consimilis | 101–151 | – | ||
| Shrub (>.5m) | 2SHRUB | Shrub (>.5m) | 10–30 | – | ||
| fourwing saltbush | ATCA2 | Atriplex canescens | 0–30 | – | ||
| Greene's rabbitbrush | CHGR6 | Chrysothamnus greenei | 0–10 | – | ||
| plains pricklypear | OPPO | Opuntia polyacantha | 0–10 | – | ||
Interpretations
Hydrological functions
This site occupies the broad central floor of the San Luis Valley on nearly level to gently sloping topography over most of the site. Soils range from sandy to loam over heavy very slowly permeable material. Water is the principal factor limiting herbage production on this site. The site is dominated by soils in hydrologic group D. Infiltration varies from moderate to slow and runoff potential varies from medium to high depending on soil hydrologic group and ground cover. In many cases, areas with greater than 75% ground cover have the greatest potential for high infiltration and lower runoff. An exception would be where short grasses form a dense sod and dominate the site. Areas where ground cover is less than 50% have the greatest potential to have reduced infiltration and higher runoff (refer to Section 4, NRCS National Engineering Handbook for runoff quantities and hydrologic curves).
Recreational uses
This site provides hunting opportunities for upland game species.
Wood products
No appreciable wood products are present on the site.
Other products
None.
Supporting information
Inventory data references
Information presented here has been derived from NRCS clipping data, numerous ocular estimates and other inventory data. Field observations from experienced range trained personnel were used extensively to develop this ecological site description. Specific data information is contained in individual landowner/user case files and other files located in county NRCS field offices.
Location of Typical Example of the Site:
Along Highway 160 between Alamosa and Monte Vista, about 3 miles southeast of the Alamosa-Rio Grande County Line.
Field Offices in Colorado where the site occurs:
Alamosa, Center, and San Luis
References
-
. 2021 (Date accessed). USDA PLANTS Database. http://plants.usda.gov.
Other references
Chapman, S.S., G.E. Griffith, J.M. Omernik, A.B. Price, J. Freeouf, and D.L. Schrupp. 2006. Ecoregions of Colorado. (2-sided color posterwith map, descriptive text, summary tables, and photographs). U.S. Geological Survey, Reston, VA. Scale 1:1,200,000.
Cleland, D.T.; Freeouf, J.A.; Keys, J.E.; Nowacki, G.J.; Carpenter, C.A.; and McNab, W.H. 2007. Ecological Subregions: Sections andSubsections for the conterminous United States. Gen. Tech. Report WO-76D [Map on CD-ROM] (A.M. Sloan, cartographer). Washington,DC: U.S. Department of Agriculture, Forest Service, presentation scale 1:3,500,000; colored.
Soil Conservation Service (SCS). August 1975. Range Site Description for Salt Flats #263. : USDA, Denver Colorado.
USDA, NRCS. National Range and Pasture Handbook, September 1997
USDA, NRCS. National Soil Information System, Information Technology Center, 2150 Centre Avenue, Building A, Fort Collins, CO 80526. (http://nasis.nrcs.usda.gov)
USDA, NRCS. 2004. The PLANTS Database, Version 3.5 (http://plants.usda.gov). National Plant Data Center, Baton Rouge, LA 70874-4490 USA.
United States Department of Agriculture, Natural Resources Conservation Service. 2006. Land Resource Regions and Major Land Resource Areas of the United States, the Caribbean, and the Pacific Basin. U.S. Department of Agriculture Handbook 296.
Western Regional Climate Center, 2215 Raggio Parkway, Reno, Nevada 89512 (http://www.wrcc.dri.edu/index.html)
Other sources used as references include: USDA NRCS Water and Climate Center, USDA NRCS National Range and Pasture Handbook, and USDA NRCS Soil Surveys from various counties.
Contributors
Kimberly A. Diller, Cynthia A. Villa, Richard T. Sparks
Approval
Kirt Walstad, 12/11/2024
Acknowledgments
Those involved in developing this site description include: Herman Garcia, Rangeland Management Specialist, NRCS, CO; Richard Sparks, Agronomist, NRCS, CO; Cynthia Villa, Rangeland Management Specialist, NRCS, CO; Kimberly Diller, Range Management Specialist, NRCS, CO; Scott Woodall, Rangeland Management Specialist, NM; Alan Steube, Soil Scientist, NRCS, CO; Terri Skadeland, Biologist, NRCS, CO; Ted Lucero, District Conservationist, NRCS, CO; Charles Hibner, Soil Scientist, NRCS, NM.
Rangeland health reference sheet
Interpreting Indicators of Rangeland Health is a qualitative assessment protocol used to determine ecosystem condition based on benchmark characteristics described in the Reference Sheet. A suite of 17 (or more) indicators are typically considered in an assessment. The ecological site(s) representative of an assessment location must be known prior to applying the protocol and must be verified based on soils and climate. Current plant community cannot be used to identify the ecological site.
| Author(s)/participant(s) | S. Woodall, C. Villa, K. Diller, L. McBride |
|---|---|
| Contact for lead author | |
| Date | 12/14/2004 |
| Approved by | Kirt Walstad |
| Approval date | |
| Composition (Indicators 10 and 12) based on | Annual Production |
Indicators
-
Number and extent of rills:
None -
Presence of water flow patterns:
None, where vegetation is continuous. Slick spots (high sodium areas) can pond water and concentrate overland flow. Flow paths should be short in length and disconnected. -
Number and height of erosional pedestals or terracettes:
None -
Bare ground from Ecological Site Description or other studies (rock, litter, lichen, moss, plant canopy are not bare ground):
5-10% bare ground, with bare patches generally less than 5-10 inches in diameter. Extended drought can cause bare ground to increase upwards to 15-20% with bare patches reaching upwards to 10-15 inches in diameter. -
Number of gullies and erosion associated with gullies:
None -
Extent of wind scoured, blowouts and/or depositional areas:
None -
Amount of litter movement (describe size and distance expected to travel):
Litter movement is minimal and short. -
Soil surface (top few mm) resistance to erosion (stability values are averages - most sites will show a range of values):
Stability class rating anticipated to be 1-2 in interspaces at soil surface. -
Soil surface structure and SOM content (include type of structure and A-horizon color and thickness):
Surface soils range from loam, sandy loam, sandy clay loam to loamy sand in texture. The A-horizon is light gray to brownish gray that can extend to 8 inches deep. The structure is typically weak ranging from fine granular to sub-angular blocky. -
Effect of community phase composition (relative proportion of different functional groups) and spatial distribution on infiltration and runoff:
Diverse grass, forb, shrub canopy and root structure reduces raindrop impact and concentrations of salt thereby providing increased time for infiltration to occur. Extended drought reduces grass and forb production and increases shrub component causing decreased infiltration and increased potential for ponding and evaporation. -
Presence and thickness of compaction layer (usually none; describe soil profile features which may be mistaken for compaction on this site):
None -
Functional/Structural Groups (list in order of descending dominance by above-ground annual-production or live foliar cover using symbols: >>, >, = to indicate much greater than, greater than, and equal to):
Dominant:
warm season bunchgrass >Sub-dominant:
shrubs > warm season rhizomatous > cool season rhizomatous >Other:
forbsAdditional:
-
Amount of plant mortality and decadence (include which functional groups are expected to show mortality or decadence):
Minimum. Expect some natural mortality and decadence on grasses and shrubs. -
Average percent litter cover (%) and depth ( in):
15-25% litter cover at 0.25 – .50 inch depth. Litter cover during and following extended drought ranges from 5-10%. -
Expected annual annual-production (this is TOTAL above-ground annual-production, not just forage annual-production):
600 lbs./ac. low precip years; 900 lbs./ac. average precip years; 1200 lbs./ac. above average precip years. After extended drought, production will be significantly reduced to 400 – 800 lbs./ac. or more. -
Potential invasive (including noxious) species (native and non-native). List species which BOTH characterize degraded states and have the potential to become a dominant or co-dominant species on the ecological site if their future establishment and growth is not actively controlled by management interventions. Species that become dominant for only one to several years (e.g., short-term response to drought or wildfire) are not invasive plants. Note that unlike other indicators, we are describing what is NOT expected in the reference state for the ecological site:
None -
Perennial plant reproductive capability:
The only limitations are weather-related, natural disease, inter-species competition, wildlife, and insects that may temporarily reduce reproductive capability.
Print Options
Sections
Font
Other
The Ecosystem Dynamics Interpretive Tool is an information system framework developed by the USDA-ARS Jornada Experimental Range, USDA Natural Resources Conservation Service, and New Mexico State University.
Click on box and path labels to scroll to the respective text.