
Natural Resources
Conservation Service
Ecological site R106XY075NE
Loamy Upland
Accessed: 04/02/2025
General information
Approved. An approved ecological site description has undergone quality control and quality assurance review. It contains a working state and transition model, enough information to identify the ecological site, and full documentation for all ecosystem states contained in the state and transition model.
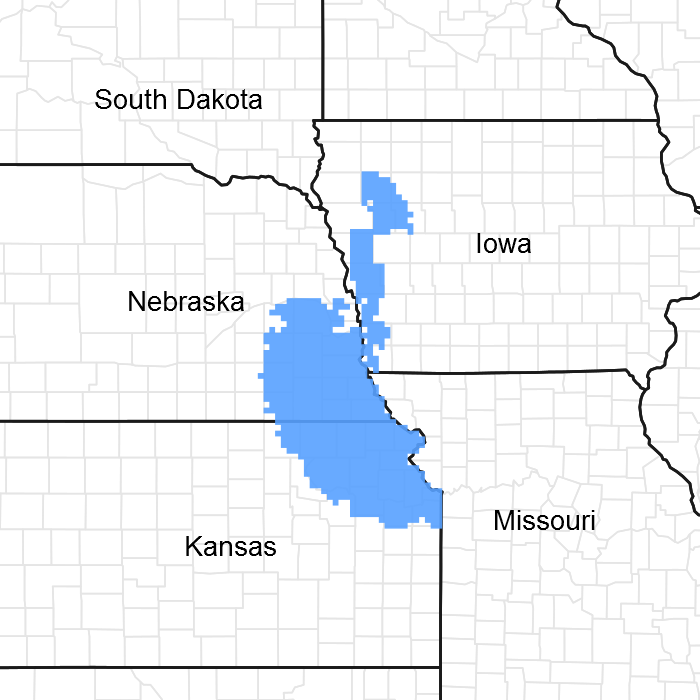
Figure 1. Mapped extent
Areas shown in blue indicate the maximum mapped extent of this ecological site. Other ecological sites likely occur within the highlighted areas. It is also possible for this ecological site to occur outside of highlighted areas if detailed soil survey has not been completed or recently updated.
MLRA notes
Major Land Resource Area (MLRA): 106X–Nebraska and Kansas Loess-Drift Hills
Loess covers the surface of almost all of the uplands in this MLRA. Glacial drift underlies the loess. Alluvial clay, silt, sand, and gravel are deposited in all of the stream and river valleys. The alluvial deposits can be extensive in the major river valleys. Paleozoic sandstone, shale, and limestone units are exposed in a few road cuts and in the walls of valleys along the major streams on the east side of the area, near the bluffs along the Missouri River. Limestone and shale (clay) quarries are in this MLRA.
Classification relationships
Major Land Resource Area(MLRA) 106: (USDA-Natural Resources Conservation Service, 2006)
"Silty" range site for NE NRCS Vegetation Zone 4
“Loamy Upland” range site for KS portion of MLRA 106
NE Natural Heritage Program/NE Game & Parks Commission: "Upland Tallgrass Prairie"
General information for MLRA 106:
*Fenneman (1916) Physiographic Regions* Division – Interior Plains
Province – Central Lowland
Section – Dissected Till Plains
*USFS (2007) Ecoregions*
Domain – Humid Temperate
Division – Prairie
Province – Prairie Parkland (Temperate)
Section – Central Dissected Till Plains (251C)
*EPA Ecoregions (Omernik 1997)*
I – Great Plains (9)
II – Temperate Prairies (9.2)
III – Western Corn Belt Plains (9.2.3)
IV – Loess and Glacial Drift Hills (47i)
*Associated Counties*
Nebraska: Butler, Cass, Gage, Jefferson, Johnson, Lancaster, Nemaha, Otoe, Pawnee, Richardson, Saline, Saunders, Seward
Kansas: Atchison, Brown, Doniphan, Douglas, Franklin, Jackson, Jefferson, Johnson, Leavenworth, Marshall, Nemaha, Osage, Pottawatomie, Shawnee, Wabaunsee, Washington, Wyandotte
Ecological site concept
This site occurs on higher, stable landscape positions that produce run-off from soils with less than 35 percent clay content in the surface horizons. Refer to 106 ecosite key for field verification.
Associated sites
| R106XY070NE |
Loamy Terrace Receiving positions on lower landscape positions, typically on terraces |
|---|---|
| R106XY074NE |
Clayey Upland Similar landscape positions and often intermixed; best distinguished by >35% clay content |
| R106XY077NE |
Shallow Limy Typically found on steeper areas and/or narrow summits |
Similar sites
| R106XY077NE |
Shallow Limy Higher mid-grass contribution, significantly lower production, limestone/shale within 20” |
|---|---|
| R106XY074NE |
Clayey Upland Similar composition, lower production, average clay content >35% in A horizons with lower AWC |
| R106XY070NE |
Loamy Terrace Similar plant composition but higher production |
Table 1. Dominant plant species
| Tree |
Not specified |
|---|---|
| Shrub |
Not specified |
| Herbaceous |
(1) Andropogon gerardii |
Physiographic features
The site occurs on nearly level to steep slopes, foot slopes, and uplands. See the Ecological Dynamics Section for the discussion on aspect influence on the site.
While the percent slope of the soil series associated with this site ranges freom 0 to 35 percent, the vast majority of Loamy uplands are situated on slopes of 15 percent or less.
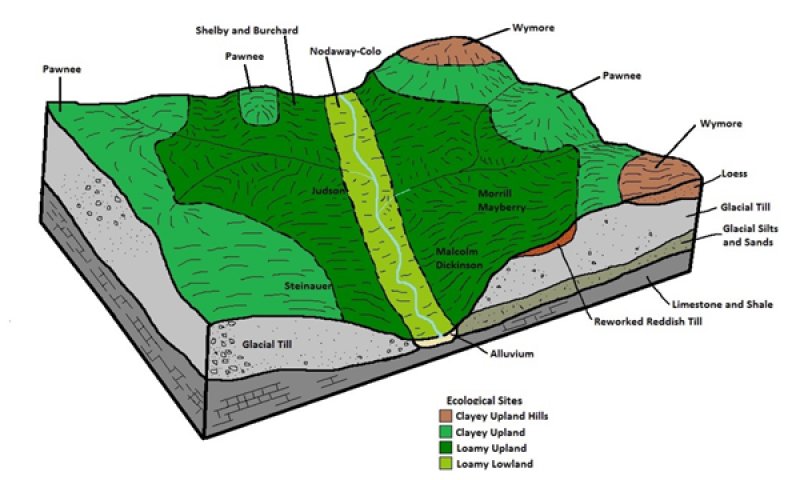
Figure 2. Loamy Upland Catena
Table 2. Representative physiographic features
| Landforms |
(1)
Loess hill
(2) Plain (3) Hill |
|---|---|
| Flooding frequency | None |
| Ponding frequency | None |
| Elevation | 228 – 516 m |
| Slope | 0 – 35% |
| Water table depth | 91 cm |
| Aspect | N, S |
Climatic features
The average annual precipitation gradient trends higher from northwest (28”) to southeast (40”,) and the average annual temperature gradient trends higher from north (50°F) to south (55°F.) Approximately 75 percent of the precipitation falls as high-intensity convective thunderstorms from the late spring months through the early autumn. The average snowfall varies from 20 to 30 inches. The following data summary includes weather stations representing the full geographic extent of the MLRA, and based on 70 percent probabilities. This means that actual observed climate conditions may fall outside these ranges 30 percent of the time. Furthermore, climatic events can manifest in many different ways. For example, abnormally dry periods could occur as 3 consecutive drought years out of 10, 3 individual years separated by “normal” years, or some combination. Tree-ring records indicate that portions of the Great Plains also have historically experienced droughts lasting several decades; therefore, plant community response will largely depend on the manner in which climatic variability is realized in interaction with past and current land management.
Table 3. Representative climatic features
| Frost-free period (average) | 195 days |
|---|---|
| Freeze-free period (average) | 171 days |
| Precipitation total (average) | 864 mm |
Figure 3. Monthly precipitation range
Figure 4. Monthly average minimum and maximum temperature
Figure 5. Annual precipitation pattern
Figure 6. Annual average temperature pattern
Influencing water features
No water features are associated with this site.
Soil features
Representative Soil Features
The soils on this site are moderately well or well drained and deep to very deep. The surface layer of the soils on this site is loamy. The surface layer ranges from a depth of 5 to 20 inches thick. The subsoil and underlying material have a similar range in texture as the surface layer. The subsoil contains less than 45 percent clay, and may include sandy substrata. Soils in this site generally are high in fertility. The potential for water erosion increases as the slope increases.
Rills and gullies are not inherent to this site; if present, headcutting has stabilized and sides are vegetated. Water flow patterns are absent or irregular and disconnected. Pedestals and terracettes are rated none to slight. These indicators may become more apparent as slope approaches the upper limit for the site. Soil aggregate stability is high.
Plant litter is distributed evenly throughout the site; however, heavy rainfall may move herbaceous and small woody litter short distances as the slope approaches the upper limit for the site.
More than 95 percent of the ground is covered by plant canopy, litter, and/or coarse fragments. Following fire, much less litter/canopy the subsequent growing season is to be expected.
Major soil series correlated to this ecological site include: Aksarben, Burchard, Morrill, Yutan and Shelby. Sharpsburg has been correlated to Aksarben in this MLRA.
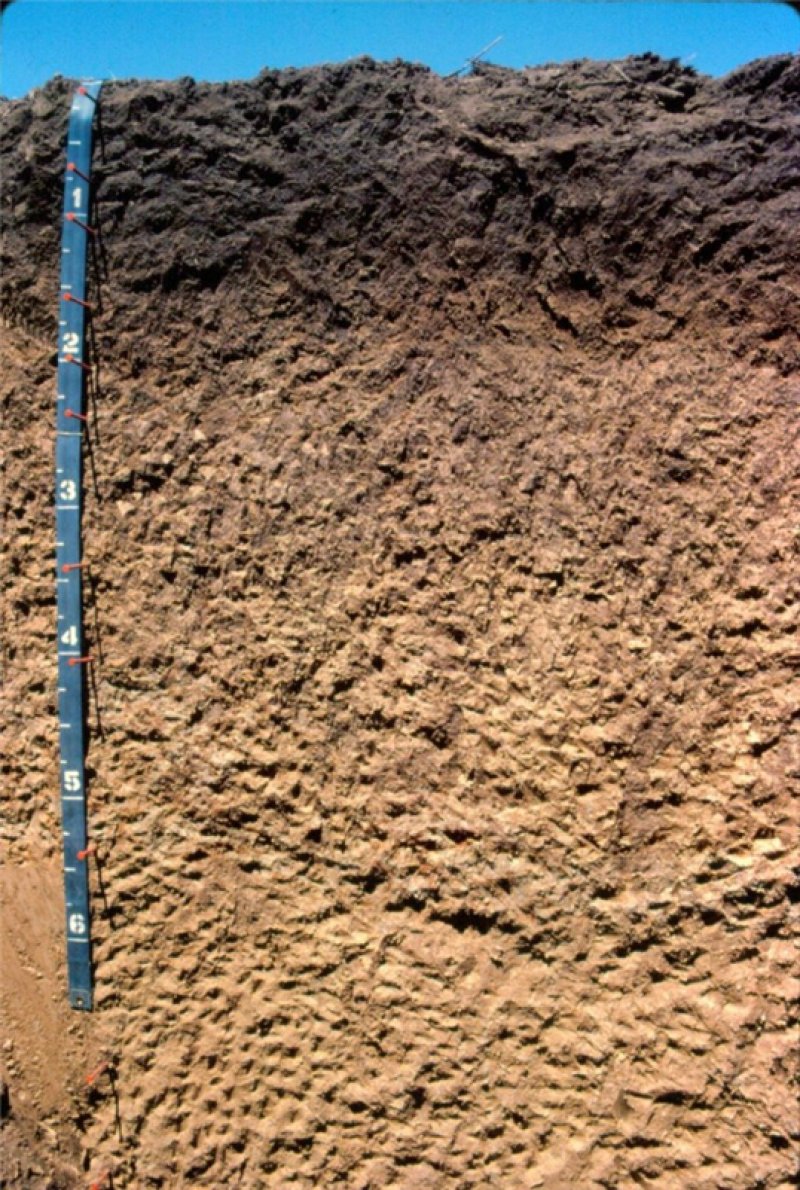
Figure 7. Sharpsburg series
Table 4. Representative soil features
| Surface texture |
(1) Silty clay loam (2) Silt loam (3) Clay loam |
|---|---|
| Family particle size |
(1) Loamy |
| Drainage class | Moderately well drained to well drained |
| Permeability class | Slow to moderate |
| Soil depth | 152 – 203 cm |
| Surface fragment cover <=3" | 0 – 5% |
| Surface fragment cover >3" | 0 – 10% |
| Available water capacity (0-101.6cm) |
22.86 – 27.94 cm |
| Calcium carbonate equivalent (0-101.6cm) |
0 – 6% |
| Electrical conductivity (0-101.6cm) |
0 mmhos/cm |
| Sodium adsorption ratio (0-101.6cm) |
0 |
| Soil reaction (1:1 water) (0-101.6cm) |
5.8 – 8.4 |
| Subsurface fragment volume <=3" (Depth not specified) |
0 – 20% |
| Subsurface fragment volume >3" (Depth not specified) |
0 – 5% |
Ecological dynamics
Information presented here has been derived from RANGE-417 archives, Rangeland NRI, and other inventory data. Field observations from range-trained personnel also were used in addition to the multitude of NRCS field office employees and private landowners that helped with site visits and local knowledge.
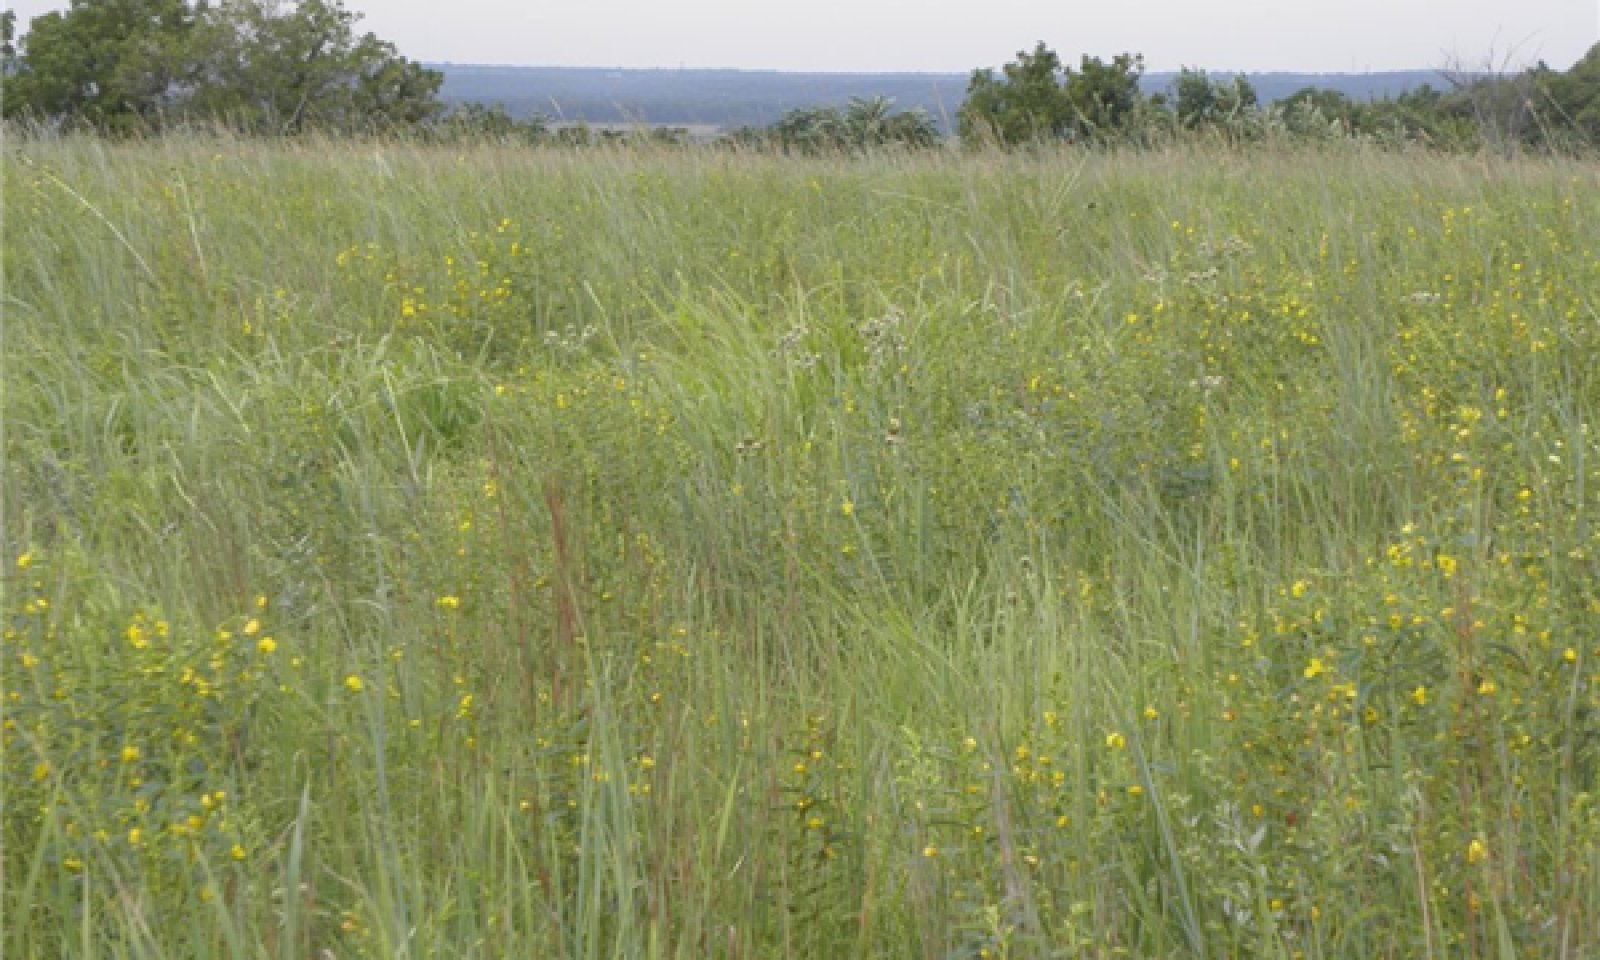
The Reference Community for this site is tallgrass prairie occurring on higher, stable landscape positions that generate runoff. Gentler slopes comprise well-developed soils with favorable precipitation capture and retention, while steeper areas will exhibit higher run-off with carbonates remaining near the surface. Under normal weather and soil conditions, sunlight and energy capture is a primary factor limiting plant growth, making this site ideal to support warm-season tallgrass communities. The vegetation on this site is locally impacted by topography, and the steepness and aspect of the slope interact with the other ecological processes to further influence vegetative dynamics. The north and east facing slopes are usually cooler and wetter, which results in increased vegetation production, but favors invasion by trees and shrubs as well. This often makes these slopes more resistant to restoration of the native grasslands by fire. They may require use of specific ignition techniques when conducting a prescribed burn to ensure mortality of invading trees.
This site developed with fire as an integral part of the ecological processes. Historically, a given area burned approximately every 3-4 years. Distribution was random, but timing generally corresponded to the summer season when convective thunderstorms are most likely to occur. However, it is also believed that pre-European inhabitants may have used fire as a management tool for attracting herds of large migratory herbivores (bison, elk, and/or deer) as well as for warfare. The role of fire over the past 100 years has been relatively insignificant due to the human control of wildfires and general lack of acceptance of prescribed fire as a management tool. In this region where natural precipitation is capable of supporting eastern deciduous forest, much of this site is vulnerable to encroachment by woody species.
The degree of herbivory has significant impacts on ecological processes such as nutrient cycling and sunlight capture. Historically, these sites were highly attractive to herds of large migratory herbivores, and grazing patterns and impacts were a primary influence. Secondary influences of herbivory by species such as insects, rodents, and root-feeding organisms impacted the vegetation both historically and currently.(Helzer, 2010). The management of herbivory by humans through grazing of domestic livestock and manipulation of wildlife populations has been a major modern influence on the ecological dynamics (USDA/SCS, 1977).
Fire historically played a critical role in maintaining the heterogeneity of this system by removing decadent plant material and creating highly palatable new growth. Large herbivores were attracted to the burned areas, and created "grazing lawns". These areas were repeatedly grazed until a new burned area reduced grazing pressure until the area was left undisturbed. The heterogeneity of vegetative diversity and structure of the landscape created by the numerous patches in various states of vegetative recovery was essential to maintaining a diverse wildlife population. These conditions created the array of seasonal niches necessary for the various wildlife species to thrive. Grassland birds are one suite of species whose habitat requirements are particularly dependent on the mosaic of vegetative structure created by the pyric herbivory/ungulate interactions.
Patch burn grazing is an emerging management concept that attempts to emulate this historic system.
Whereas herds of native ungulates could move freely across the landscape in response to changing conditions, livestock use is constrained in space and often repeated over time, producing a more homogeneous landscape. Grasses with highly elevated growing points (e.g. big bluestem, Indiangrass, gamagrass) and preferred shrubs are the most susceptible to growing-season defoliation and typically the first to decrease under improper grazing. Noxious weeds such as leafy spurge, sericea lespedeza, and musk and Canada thistles may take advantage of reduced native cover and vigor; however, the cool-season grasses smooth brome, and tall fescue pose the greatest invasion threat. Smooth brome is generally the dominant invader in Nebraska while tall fescue is more common in Kansas.
The favorable growing conditions and topography that historically made this one of the largest contributors to the “true prairie” habitat type in this MLRA have also made it one of the most extensively cropped today. The Reference Plant Community has been determined by study of rangeland relic areas, areas protected from abusive disturbance, seasonal use pastures, areas under long-term rotational grazing practices, and historical accounts.
The following diagram illustrates the common plant communities that can occur on the site and the transition pathways between communities (Bestelmeyer, 2010). The ecological processes will be discussed in more detail in the plant community descriptions following the diagram.
State and transition model
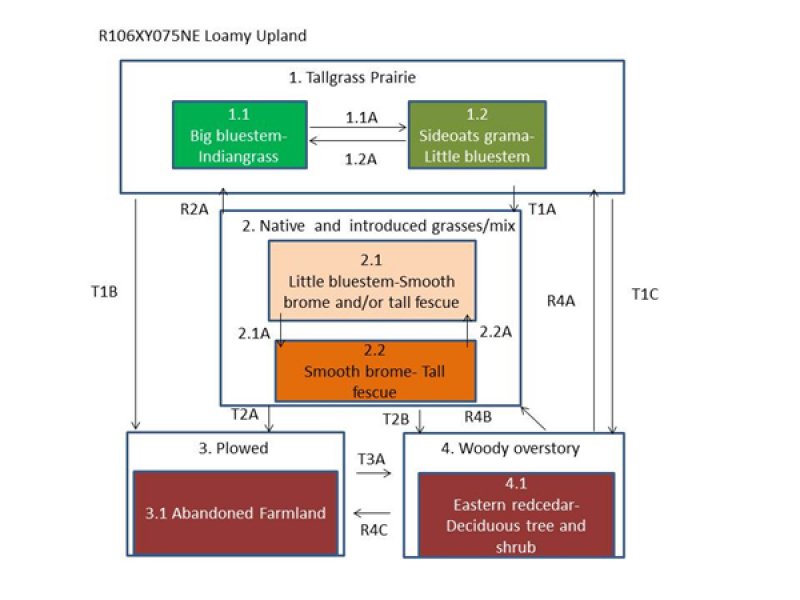
Figure 8. Loamy Upland STM

Figure 9. State and Transition Model Legend
More interactive model formats are also available.
View Interactive Models
More interactive model formats are also available.
View Interactive Models
Click on state and transition labels to scroll to the respective text
State 3 submodel, plant communities
State 4 submodel, plant communities
State 1
Reference State
This state comprises the communities within the range of natural variability under historic conditions and disturbance regimes. Patterns created by wildlife use and fire supported a mosaic of communities across the landscape. Warm-season tallgrasses are dominant, with subdominant contributions from mid and cool-season grasses, forbs, and shrubs. Eastern gamagrass is naturally absent in the northern half of the MLRA, but becomes increasingly common southward. Conversely, cool-season grasses, such as porcupine grass and Canada wildrye, are more prominent northward. High perennial grass cover allows for increased soil moisture retention, vegetative production, and overall soil quality. Fire and bison herbivory were the dominant disturbance regimes that historically maintained the tallgrass dominance with a diverse forb component. Furthermore, bison grazing was closely linked to fire patterns as the animals preferred grazing burned areas offering highly palatable and nutritious regrowth. Thus, historic plant communities were subject to occasional burning and grazing, with substantial rest/recovery periods as the fuel load rebuilt to eventually start this process again. Fires also served to suppress woody species and to maintain an open herbaceous stand. The degree to which current conditions represent this state largely depends upon how closely contemporary management has mimicked these past disturbance effects.
Community 1.1
Andropogon gerardii-Sorghastrum nutans (Big bluestem-Indiangrass)

Figure 10. Rockefeller Prairie
This plant community is 75-90 percent grasses and grass-like plants, 5-10 percent forbs, and 0-10 percent shrubs, based upon total annual air-dry weight production. Big bluestem, Indiangrass, little bluestem, porcupine grass, sideoats grama, and switchgrass are the dominant species making up 70 percent or more of the total annual production. Blue grama, prairie junegrass, Scribner’s rosette grass (panicum or panic grass), tall dropseed and various sedges, shrubs, and forbs are also important plants to the site (Kaul 2006, Steinauer 2010, USDA/NRCS 2012). This plant community is very stable but there is annual variability of expression of the dominant plant species based on current climate and local disturbances. Late spring fires will stimulate warm-season plants while suppressing cool-season grasses and forbs. This plant community is very stable with very little water runoff The total annual production ranges from 2,975 to 5,400 pounds of air-dry lbs/ac depending on climate, with an average of 4,250 lbs/ac.
Figure 11. Annual production by plant type (representative values) or group (midpoint values)
Table 5. Annual production by plant type
| Plant type | Low (kg/hectare) |
Representative value (kg/hectare) |
High (kg/hectare) |
|---|---|---|---|
| Grass/Grasslike | 2920 | 4049 | 4965 |
| Shrub/Vine | 207 | 358 | 566 |
| Forb | 207 | 358 | 566 |
| Total | 3334 | 4765 | 6097 |
Figure 12. Plant community growth curve (percent production by month). NE1068, MLRA 106 Warm-season. *Warm-season dominant.
| Jan | Feb | Mar | Apr | May | Jun | Jul | Aug | Sep | Oct | Nov | Dec |
|---|---|---|---|---|---|---|---|---|---|---|---|
| J | F | M | A | M | J | J | A | S | O | N | D |
| 0 | 0 | 3 | 7 | 18 | 30 | 22 | 12 | 6 | 2 | 0 | 0 |
Community 1.2
Bouteloua curtipendula-Schizachyrium scoparium (Sideoats grama-Little bluestem)
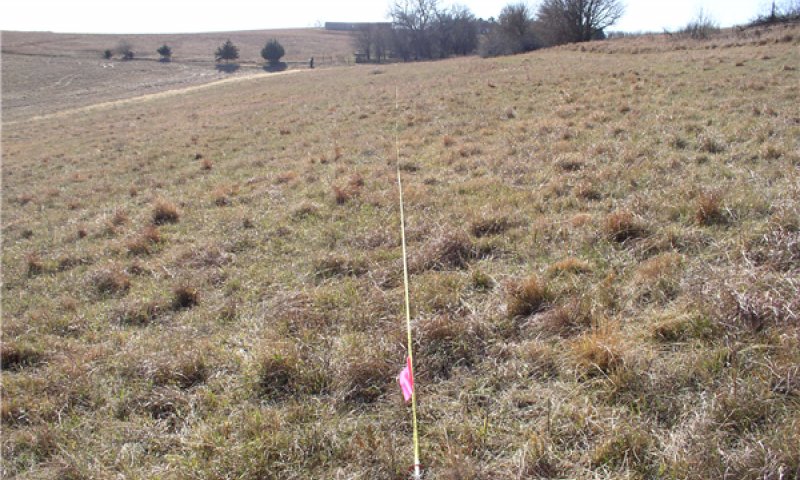
Figure 13. Midgrass dominant during drought
This community phase marks a significant reduction in warm-season tallgrasses that have decreased due to continued excessive defoliation and/or prolonged drought. Decreased plant litter reduces effective precipitation causing a decline in production compared to the Big bluestem-Indiangrass community. Reduced efficiencies in the nutrient, mineral, and hydrologic cycles further impair soil health. Total average annual production ranges from 3,300 to 4,100 pounds of air-dry lbs/ac with an average of 3,700 lbs/ac.
Figure 14. Plant community growth curve (percent production by month). NE1068, MLRA 106 Warm-season. *Warm-season dominant.
| Jan | Feb | Mar | Apr | May | Jun | Jul | Aug | Sep | Oct | Nov | Dec |
|---|---|---|---|---|---|---|---|---|---|---|---|
| J | F | M | A | M | J | J | A | S | O | N | D |
| 0 | 0 | 3 | 7 | 18 | 30 | 22 | 12 | 6 | 2 | 0 | 0 |
Pathway 1.1A
Community 1.1 to 1.2


A shift from the Big bluestem-Indiangrass community toward the Sideoats grama-Little bluestem community occurs with heavy grazing and inadequate recovery periods. This is often seen under continuous season-long grazing in excess of carrying capacity which allows for defoliation of elevated tallgrass growing points. Drought may also produce a shift towards shorter-statured species with higher drought tolerance.
Pathway 1.2A
Community 1.2 to 1.1


A shift from the Sideoats grama-Little bluestem community toward the Big bluestem-Indiangrass community is achieved by removing or mitigating the stressors, whether they are undermanaged grazing or climatic conditions. Deferment of grazing until late summer following the peak growth period of warm-season species will allow for warm-season tallgrasses to reclaim stand dominance. Reduced stocking rates or growing-season rest following periods of low rainfall will alleviate some of the impact of inadequate soil moisture.
State 2
Native and Introduced Mixed Grass State
This state exhibits a co-dominance of both native and introduced species. Very few native tall warm-season grasses such as big bluestem and Indiangrass remain. The plant community consists of the more grazing tolerant native species and a significant component of introduced grasses. Forb diversity is limited to less palatable species such as ironweed and western ragweed. Impaired energy capture and altered hydrologic function are reflected in reduced vegetative productivity, shallower rooting depth and degraded soil quality.
Community 2.1
Schizachyrium scoparium-Bromus inermis, Schedonorus arundinaceus (Little bluestem-Brome, fescue)
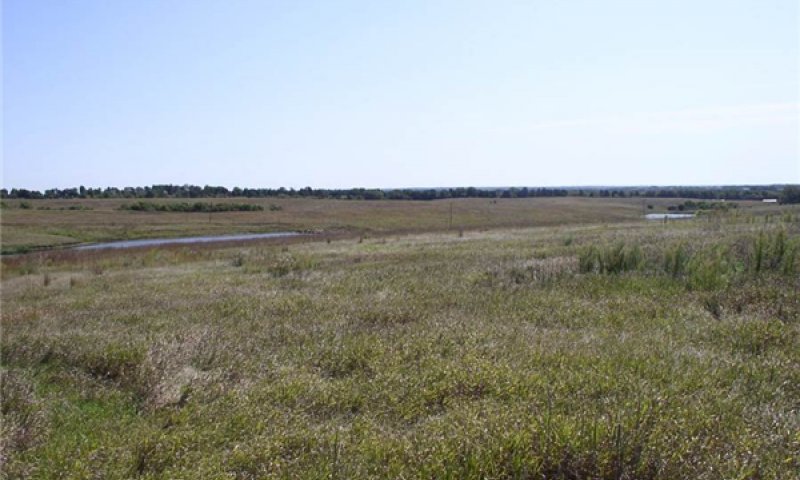
Figure 15. Martin Prairie - 50/50 brome/native mix
This plant community represents a shift from the reference state across a state threshold. With continued undermanaged grazing, little bluestem and cool-season introduced grasses increase. Smooth brome is the dominant invader in the northern half of the MLRA while tall fescue is common in the south. Kentucky bluegrass may be subdominant throughout. Continuous heavy grazing pressure will convert this plant community to a sodbound condition. Forb richness and diversity will decrease as well. Total annual production ranges from 2,100 and 3,100 pounds of air-dry herbage per acre per year, and produce about 2,600 pounds per acre in average years.
Figure 16. Plant community growth curve (percent production by month). NE1069, MLRA 106 Warm/cool-season mix.
| Jan | Feb | Mar | Apr | May | Jun | Jul | Aug | Sep | Oct | Nov | Dec |
|---|---|---|---|---|---|---|---|---|---|---|---|
| J | F | M | A | M | J | J | A | S | O | N | D |
| 0 | 1 | 4 | 10 | 23 | 26 | 17 | 8 | 6 | 4 | 1 | 0 |
Community 2.2
Bromus inermis, Schedonorus arundinaceus; Smooth brome, Tall fescue)
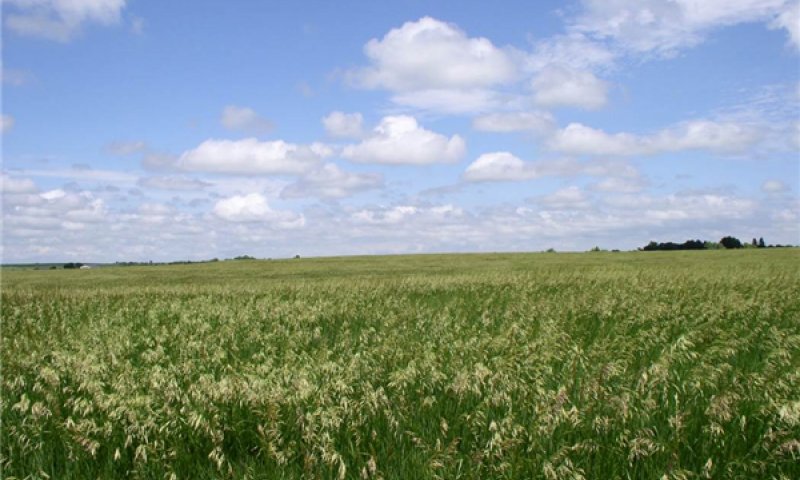
Figure 17. Smooth brome
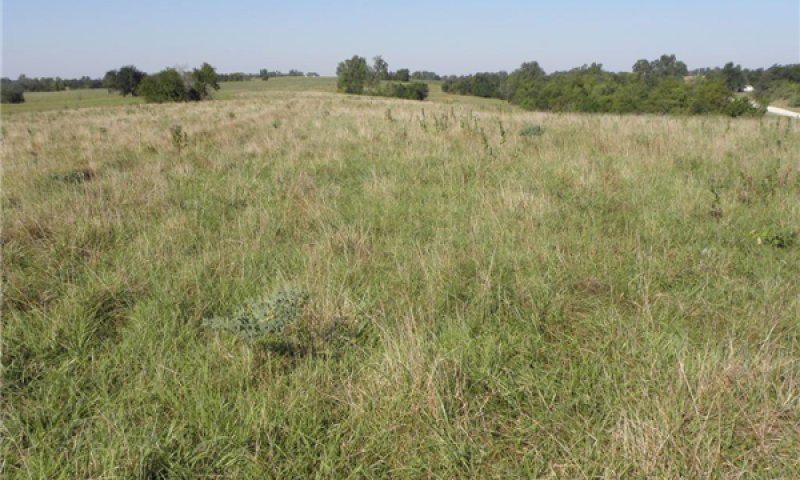
Figure 18. Tall fescue
This community is predominately smooth brome or tall fescue and may have a Kentucky bluegrass sub-component. Native warm-season grass remnants may or may not still be present. Smooth brome primarily occurs throughout the northern half of the MLRA, while tall fescue is common in the south. Vegetative production from smooth brome and tall fescue dominated communities can be highly variable depending on the species composition and external inputs such as fertilizer and weed control. In a normal year, biomass produced can range from 2,500 to 3,000 lbs./acre, with an average of 2,750 on rangelands with a dominant cool season grass component of 75 percent or more.
Figure 19. Plant community growth curve (percent production by month). NE1063, MLRA 106 Cool-season dominant. *75%+ brome/fescue/bluegrass composition.
| Jan | Feb | Mar | Apr | May | Jun | Jul | Aug | Sep | Oct | Nov | Dec |
|---|---|---|---|---|---|---|---|---|---|---|---|
| J | F | M | A | M | J | J | A | S | O | N | D |
| 0 | 1 | 7 | 16 | 28 | 21 | 8 | 5 | 7 | 5 | 2 | 0 |
Pathway 2.1A
Community 2.1 to 2.2


This is a continuation of the processes and effects addressed in Transition T1A. Persisting stressors on desirable species allow for further expansion and dominance of brome and/or tall fescue. Site structure and function largely resemble a seeded pasture monoculture, although scattered natives may still be found. Introduced grass seeding, continuous warm season grazing, mid to late summer haying, and untimely and/or excessive fertilization will increase cool-season invaders.
Pathway 2.2A
Community 2.2 to 2.1


Establishing a grazing regime that focuses pressure during the cool season grasses' active growth period while providing rest during the warm season growing season will promote a shift back to community phase 2.1. Prescribed fires used in conjunction with a cool-season grazing program will accelerate the process. In the presence of a viable native seedbank, non-selective herbicides applied in the early spring and late fall when invaders are actively growing can be beneficial. Established stands of the cool season invaders may require complete renovation through chemical treatment followed by re-seeding of the native vegetation. Once the warm-season community is re-established, ongoing prescribed grazing and fire management with adequate rest and recovery during the summer months is critical.
State 3
Plowed State
Extensive areas of this ecological site were plowed and converted to crop production by early European settlers and their subsequent generations. In addition to permanently altering the the existing vegetative community, repeated tillage negatively impacted soil properties. Reductions in organic matter, mineral levels, soil structure, oxygen levels, and water-holding capacity along with increased runoff and erosion as well as shifts in the populations of soil-dwelling organisms were common on these sites. The extent of these changes depended upon the duration of cropping as well as crops grown and other management practices. At this present time there are no restoration pathways from this state to another state.
Community 3.1
Abandoned farmland
This plant community consists of annual and perennial weedy forbs and less desirable grasses. These sites have been farmed (i.e. all previous plant communities were destroyed) and abandoned without reseeding. These sites undergo degraded soil quality, reduced infiltration, and plowpan compaction. This plant community is not stable during the early seral stages. Abandoned farmland may be reseeded with introduced or native mixes. Some native mixes are diverse enough to re-establish a plant community that approaches the pre-farmed condition, but due to essentially irreversible alterations to the soil, there is no foreseeable return to the reference state.
State 4
Invaded Woody State
This state is invaded by woody species, primarily eastern redcedar, but also honey locust or other invasive deciduous trees. These woody species are present due to lack of fire and/or brush management measures.
Community 4.1
Juniperus virginiana-Quercus macrocarpa (Eastern redcedar/Deciduous tree and shrub)
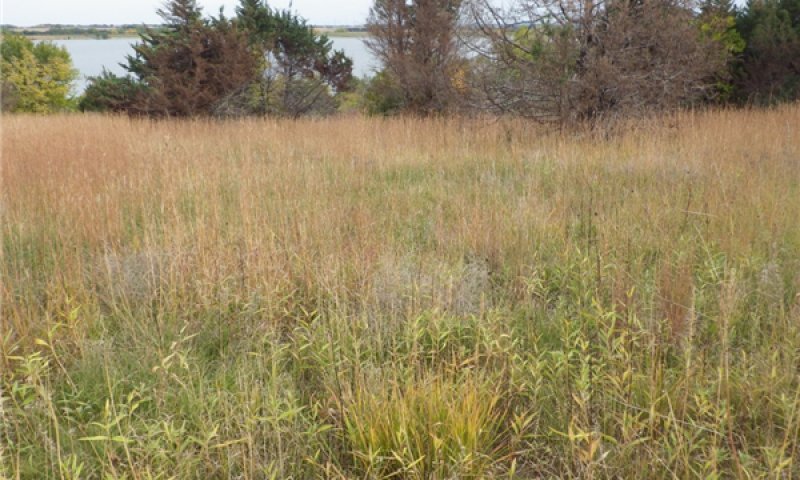
Figure 20. Pawnee Lake SRA - burn program to restore grassland
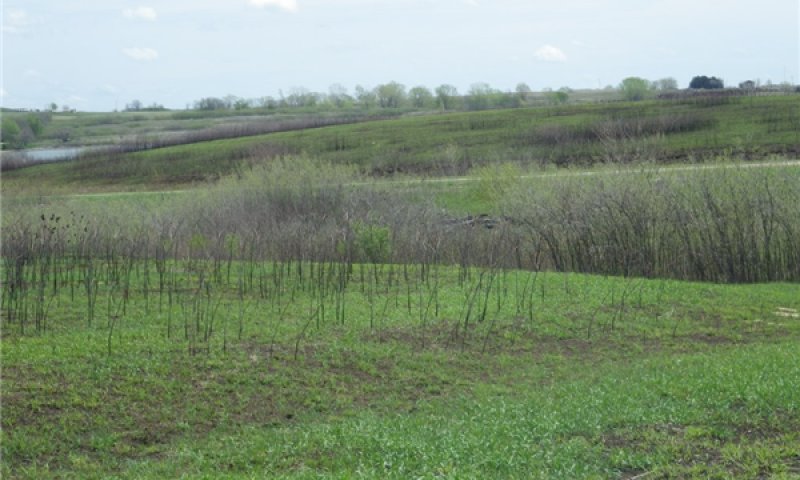
Figure 21. Shawnee State Lake - post-burn; brome understory
If ERC is the dominant tree, the canopy cover is at least 30 percent. Honey locust and smooth sumac encroachment may also be occurring when brush management and prescribed or wild fires are absent over an extended period. The grassland has converted to woodland resulting in a closed canopy that dramatically reduces the resources available for herbaceous production by intercepting rainfall and sunlight. Total annual production during an average year varies significantly, depending upon the production level prior to encroachment and the percentage of tree canopy cover.
Transition T1A
State 1 to 2
Repeated defoliation of preferred native tall and mid-grass warm-season species during periods of active growth reduces individual plant vigor and competitiveness. This facilitates an increase by the more grazing- evasive native warm-season grasses, and cool- season species. As big bluestem, little bluestem, and Indiangrass decrease, cool- season invaders such as smooth brome and/or tall fescue colonize and expand to such a degree that deliberate long-term management is required to restore the original native plant community. The native forb and shrub component is also affected by the season and degree of livestock pressure. In response to repeated defoliation, this community will shift to less palatable, more grazing tolerant species that includes non-native invaders. Repeated growing season haying causes a similar species composition shift in the reference plant communities.
Transition T1B
State 1 to 3
This transition occurs when the native grassland is sodbusted and planted to crops or seeded to non-native forage species. Return to the representative state is judged to be highly unlikely if not impossible at this stage due to irreversible alterations of the soil properties.
Transition T1C
State 1 to 4
All herbaceous communities are vulnerable to woody dominance in the absence of fire or mechanical brush management. Bur oak, eastern red cedar, coralberry, osage orange, roughleaf dogwood, and honey locust are some of the first species to increase. Although these plants are native to North America, they were not historically a significant part of this reference state. If allowed to continue with little or no disturbance, eastern red cedar, oaks and elm trees will eventually dominate. If ERC is present, the transition is generally thought to occur when its' canopy cover reaches approximately 30 percent. As the overstory closes, various processes serve to increase woody dominance. Woody foliage shades the understory and intercepts rainfall increasing evaporative loss. Litterfall acts similarly and further reduces effective precipitation while also creating a less uniform resource distribution with nutrients concentrated under individual trees. At some critical point, the understory becomes incapable of carrying a fire of the intensity needed to kill the woody species, and the disturbance response is now dictated by the overstory. Mature oak forest is largely invulnerable to stand replacement fire, while established ERC stands can only burn as crown fires.
Restoration pathway R2A
State 2 to 1
To move a historically undermanaged community across a threshold and back to the more desirable state requires a concerted management effort. This often entails employing a combination of management tools focused on reduction of the undesirable components of the community, and increasing the desired components. Spring/fall grazing with summer deferment, late spring/early summer prescribed fires, and non-selective herbicides applied in the early spring and late fall are all practices that allow warm-season grasses to complete seed setting and rebuild carbohydrate reserves, while reducing these same processes on the cool-season species. These tools are the most effective when used in combination.
Transition T2A
State 2 to 3
This transition occurs when the native grassland is sodbusted and planted to crops or seeded to non-native forage species. Return to the representative state is judged to be highly unlikely if not impossible at this stage due to irreversible alterations of the soil properties.
Transition T2B
State 2 to 4
All herbaceous communities are vulnerable to woody dominance in the absence of fire or mechanical brush management. Bur oak, eastern red cedar, coralberry, osage orange, roughleaf dogwood, and honey locust are some of the first species to increase. Although these plants are native to North America, they were not historically a significant part of the reference state. If allowed to continue with little or no disturbance, eastern red cedar, oaks and elm trees will eventually dominate. If ERC is present, the transition is generally thought to occur when its' canopy cover reaches approximately 30 percent. As the overstory closes, various processes serve to increase woody dominance. Woody foliage shades the understory and intercepts rainfall increasing evaporative loss. Litterfall acts similarly and further reduces effective precipitation while also creating a less uniform resource distribution with nutrients concentrated under individual trees. At some critical point, the understory becomes incapable of carrying a fire of the intensity needed to kill the woody species, and the disturbance response is now dictated by the overstory. Mature oak forest is largely invulnerable to stand replacement fire, while established ERC stands can only burn as crown fires.
Transition T3A
State 3 to 4
All herbaceous communities are vulnerable to woody dominance in the absence of fire or mechanical brush management. Bur oak, eastern red cedar, coralberry, osage orange, roughleaf dogwood, and honey locust are some of the first species to increase. Although these plants are native to North America, they were not historically a significant part of the reference state. If allowed to continue with little or no disturbance, eastern red cedar, oaks and elm trees will eventually dominate. If ERC is present, the transition is generally thought to occur when its' canopy cover reaches approximately 30 percent. As the overstory closes, various processes serve to increase woody dominance. Woody foliage shades the understory and intercepts rainfall increasing evaporative loss. Litterfall acts similarly and further reduces effective precipitation while also creating a less uniform resource distribution with nutrients concentrated under individual trees. At some critical point, the understory becomes incapable of carrying a fire of the intensity needed to kill the woody species, and the disturbance response is now dictated by the overstory. Mature oak forest is largely invulnerable to stand replacement fire, while established ERC stands can only burn as crown fires.
Restoration pathway R4A/B/C
State 4 to 1
Restoration to an herbaceous condition can be achieved with brush management for woody plant removal, but whether the outcome includes native and/or introduced herbs will depend heavily on understory composition and seedbank. Stands of mature deciduous trees generally are invulnerable to fire, and grassland restoration will require mechanical means. Mature redcedar may be removed either mechanically or with fire; however, prescribed burns should consider site stability as well as logistical, legal, and safety constraints. Furthermore, sprouting brush such as honey locust or elm must be chemically treated after mechanical removal. If the site is stable and has a robust seedbank, this community could quickly return to a grassland state with proper follow-up management. Ongoing brush management such as hand cutting, chemical spot treatments, or periodic prescribed burning is required.
Additional community tables
Table 6. Community 1.1 plant community composition
| Group | Common name | Symbol | Scientific name | Annual production (kg/hectare) | Foliar cover (%) | |
|---|---|---|---|---|---|---|
|
Grass/Grasslike
|
||||||
| 1 | Tall Warm-Season | 1905–2858 | ||||
| big bluestem | ANGE | Andropogon gerardii | 1429–1905 | – | ||
| Indiangrass | SONU2 | Sorghastrum nutans | 239–715 | – | ||
| eastern gamagrass | TRDA3 | Tripsacum dactyloides | 0–476 | – | ||
| switchgrass | PAVI2 | Panicum virgatum | 239–476 | – | ||
| 2 | Mid Warm-Season | 953–1429 | ||||
| little bluestem | SCSC | Schizachyrium scoparium | 714–1429 | – | ||
| sideoats grama | BOCU | Bouteloua curtipendula | 239–476 | – | ||
| purple lovegrass | ERSP | Eragrostis spectabilis | 0–239 | – | ||
| composite dropseed | SPCO16 | Sporobolus compositus | 0–239 | – | ||
| plains muhly | MUCU3 | Muhlenbergia cuspidata | 0–143 | – | ||
| 3 | Shortgrasses | 48–239 | ||||
| blue grama | BOGR2 | Bouteloua gracilis | 0–239 | – | ||
| hairy grama | BOHI2 | Bouteloua hirsuta | 0–239 | – | ||
| buffalograss | BODA2 | Bouteloua dactyloides | 0–95 | – | ||
| 4 | Cool-Season | 239–715 | ||||
| porcupinegrass | HESP11 | Hesperostipa spartea | 142–476 | – | ||
| western wheatgrass | PASM | Pascopyrum smithii | 0–239 | – | ||
| prairie Junegrass | KOMA | Koeleria macrantha | 48–143 | – | ||
| Scribner's rosette grass | DIOLS | Dichanthelium oligosanthes var. scribnerianum | 48–143 | – | ||
| fall rosette grass | DIWI5 | Dichanthelium wilcoxianum | 0–143 | – | ||
| Canada wildrye | ELCA4 | Elymus canadensis | 0–143 | – | ||
| Virginia wildrye | ELVI3 | Elymus virginicus | 0–143 | – | ||
| 5 | Grasslike | 48–476 | ||||
| sedge | CAREX | Carex | 48–476 | – | ||
| heavy sedge | CAGR4 | Carex gravida | 0–239 | – | ||
| sun sedge | CAINH2 | Carex inops ssp. heliophila | 0–239 | – | ||
| Mead's sedge | CAME2 | Carex meadii | 0–239 | – | ||
|
Forb
|
||||||
| 6 | Forbs | 0–476 | ||||
| Missouri goldenrod | SOMI2 | Solidago missouriensis | 0–143 | – | ||
| stiff goldenrod | OLRI | Oligoneuron rigidum | 0–143 | – | ||
| Cuman ragweed | AMPS | Ambrosia psilostachya | 0–143 | – | ||
| false boneset | BREU | Brickellia eupatorioides | 0–95 | – | ||
| white sagebrush | ARLU | Artemisia ludoviciana | 0–95 | – | ||
| purple prairie clover | DAPU5 | Dalea purpurea | 0–95 | – | ||
| Maximilian sunflower | HEMA2 | Helianthus maximiliani | 0–95 | – | ||
| stiff sunflower | HEPA19 | Helianthus pauciflorus | 0–95 | – | ||
| white heath aster | SYER | Symphyotrichum ericoides | 0–95 | – | ||
| compassplant | SILA3 | Silphium laciniatum | 0–95 | – | ||
| hoary verbena | VEST | Verbena stricta | 0–95 | – | ||
| western yarrow | ACMIO | Achillea millefolium var. occidentalis | 0–48 | – | ||
| aromatic aster | SYOB | Symphyotrichum oblongifolium | 0–48 | – | ||
| longbract spiderwort | TRBR | Tradescantia bracteata | 0–48 | – | ||
| prairie groundsel | PAPL12 | Packera plattensis | 0–48 | – | ||
| silverleaf Indian breadroot | PEAR6 | Pediomelum argophyllum | 0–48 | – | ||
| cobaea beardtongue | PECO4 | Penstemon cobaea | 0–48 | – | ||
| large Indian breadroot | PEES | Pediomelum esculentum | 0–48 | – | ||
| slimflower scurfpea | PSTE5 | Psoralidium tenuiflorum | 0–48 | – | ||
| upright prairie coneflower | RACO3 | Ratibida columnifera | 0–48 | – | ||
| fringeleaf wild petunia | RUHU | Ruellia humilis | 0–48 | – | ||
| azure blue sage | SAAZ | Salvia azurea | 0–48 | – | ||
| prairie blue-eyed grass | SICA9 | Sisyrinchium campestre | 0–48 | – | ||
| roundhead lespedeza | LECA8 | Lespedeza capitata | 0–48 | – | ||
| tall blazing star | LIAS | Liatris aspera | 0–48 | – | ||
| dotted blazing star | LIPU | Liatris punctata | 0–48 | – | ||
| Nuttall's sensitive-briar | MINU6 | Mimosa nuttallii | 0–48 | – | ||
| evening primrose | OENOT | Oenothera | 0–48 | – | ||
| Carolina larkspur | DECAV2 | Delphinium carolinianum ssp. virescens | 0–48 | – | ||
| Illinois ticktrefoil | DEIL2 | Desmodium illinoense | 0–48 | – | ||
| blacksamson echinacea | ECAN2 | Echinacea angustifolia | 0–48 | – | ||
| button eryngo | ERYU | Eryngium yuccifolium | 0–48 | – | ||
| groundplum milkvetch | ASCR2 | Astragalus crassicarpus | 0–48 | – | ||
| butterfly milkweed | ASTU | Asclepias tuberosa | 0–48 | – | ||
| whorled milkweed | ASVE | Asclepias verticillata | 0–48 | – | ||
| longbract wild indigo | BABR2 | Baptisia bracteata | 0–48 | – | ||
| white prairie clover | DACA7 | Dalea candida | 0–48 | – | ||
| field pussytoes | ANNE | Antennaria neglecta | 0–48 | – | ||
|
Shrub/Vine
|
||||||
| 7 | Shrubs | 48–476 | ||||
| leadplant | AMCA6 | Amorpha canescens | 48–239 | – | ||
| coralberry | SYOR | Symphoricarpos orbiculatus | 0–95 | – | ||
| Jersey tea | CEHE | Ceanothus herbaceus | 0–48 | – | ||
| smooth sumac | RHGL | Rhus glabra | 0–48 | – | ||
| prairie rose | ROAR3 | Rosa arkansana | 0–48 | – | ||
| western snowberry | SYOC | Symphoricarpos occidentalis | 0–48 | – | ||
Interpretations
Animal community
Livestock - Grazing Interpretations:
Grazing by domestic livestock is one of the major income-producing industries in the area. Rangeland in this area may provide yearlong forage for cattle, sheep, or horses. During the dormant period, the protein levels of the forage may be lower than the minimum needed to meet livestock (primarily cattle and sheep) requirements.
Wildlife Habitat Interpretations:
When the plant community structure of this tallgrass prairie site is maintained, this site provides excellent nesting areas for quail, pheasant, and prairie chickens, especially when it is associated with adjacent booming grounds. The variety of forbs, grasses, and insects on this site makes it a preferred feeding area for deer and birds. Numerous songbirds utilize this site for nesting and other activities.
Changes to the structure and species composition of the plant community in ways that reduce the availability of the food and cover that attracts these species to this site. However, some animal species favor alternative community phases/states.
In the absence of fire and grazing, excess litter buildup can occur on this site hindering the movement of young birds, especially quail and prairie chickens. Additionally, decreased forb abundance/diversity will result in an accompanying decrease in insects, a critical food source for young birds.
Numerous rodents and small animals utilize this site by taking advantage of the taller growing plants to visually shield them from predators.
Hydrological functions
Water is the principal factor limiting forage production on this site. Shrub invasion, particularly by eastern red cedar, greatly exacerbates this issue. Control of invasive shrubs by Rx fire and mechanical means are important tools in maintaining the site as a grassland.
This site is dominated by soils in hydrologic groups B and C. Permeability is slow to moderate.
The historic and other native tallgrass and shrub vegetation states that occur on this site lose little rainfall to runoff unless the site is saturated. However, as this site shifts towards states with reduced litter and canopy cover, the amount of rainfall lost to runoff increases significantly. Some studies have shown that the mixed native/brome (2.1) state can lose up to 50 percent of the rainfall to runoff (USDA/ARS, 2013).
This site does not show evidence of rills, deposition of soil, or erosion in water flow patterns. Drainages are vegetated and stable. This holds true for all states that have not been farmed.
Plants are not pedestalled on this site, but there may be terracettes of litter observed in alternative states due to increased runoff.
Recreational uses
This site provides hunting for upland game species along with hiking, photography, bird watching and other opportunities. The wide varieties of plants which bloom from spring until fall have an aesthetic value that appeals to visitors.
Wildflowers are abundant on this site. The most visible wildflowers change from year to year due to the variability among the growing seasons. Because of this variety of wildflowers and grasses, numerous individuals tour and collect plant materials from this site for dried floral arrangements.
Wood products
Although several tree species invade this site, they usually do not reach sufficient size to produce wood products except for firewood.
Other products
The deep productive nature of the soils correlated to this site make it attractive for a variety of other land uses. When in large blocks on flatter slopes, they are preferred cropland soils. Introduced pasture plants do well on these soils.
Other information
This is an Approved ESD, and has had the appropriate levels of Quality Control and Quality Assurance performed.
Supporting information
Inventory data references
Information presented here has been derived from RANGE-417 archives, Rangeland NRI, and other inventory data. Field observations from range-trained personnel were also used. In addition to the multitude of NRCS field office employees and private landowners that helped with site visits and local knowledge, those involved in developing this site include:
Nebraska NRCS
Nadine Bishop, State Rangeland Management Specialist
Dan Shurtliff, Asst State Soil Scientist
Sam Cowan, Soil Conservationist
Kansas NRCS
David Kraft, State Rangeland Management Specialist
Tim Miller, Area Rangeland Management Specialist
Dwayne Rice, Area Rangeland Management Specialist
MLRA Office 5
Stu McFarland, Ecological Site Inventory Specialist, QC
Mark Moseley, Ecological Site Inventory Specialist, QA
Chris Tecklenburg, Ecological Site Inventory Specialist, QC
John Warner, Soil Data Quality Specialist
Bruce Evans, 5-LIN MSSO Project Leader
National Soil Survey Center
Mike Kucera, National Agronomist, Soil Quality & Ecosystems
Steve Peaslee, GIS Specialist, Soil Survey Interpretations
Nebraska Game & Parks Commission
Gerry Steinauer, Botanist
Nebraska Forest Service
Steve Karloff, District Forester
Dennis Adams, Program Leader
University of Nebraska – Lincoln Extension
Bruce Anderson, Forage Specialist
Type locality
| Location 1: Douglas County, KS | |
|---|---|
| Township/Range/Section | T11S R20E S33 |
| General legal description | Rockefeller Prairie, University of Kansas Field Station. |
Other references
Fenneman, Nevin M. 1916. Physiographic Subdivision of the United States. Annals of the
Association of American Geographers.
Helzer, Chris. 2010. The Ecology and Management of Prairies in the Central U.S. Iowa City, IA: University of Iowa Press/The Nature Conservancy.
Kaul, Robert B., David Sutherland, and Steven Rolfsmeier. 2006. The Flora of Nebraska. Lincoln, NE: University of Nebraska – Lincoln (Conservation and Survey Division, School of Natural Resources.)
Multiple authors. 2010. Rangelands: Ecological Sites (Special Issue) pp 2-64. Wheat Ridge, CO: Society for Range Management.
NOA/UNL – High Plains Regional Climate Center. Historical Data Summaries:
http://www.hprcc.unl.edu/data/historical/
Steinauer, Gerry and Steve Rolfsmeier. 2010. Terrestrial Ecological Systems and Natural Communities of Nebraska. Lincoln, NE: Nebraska Natural Heritage Program and Nebraska Game and Parks Commission.
USDA/ARS/SWRC. 2013. Dynamic Rangeland Hydrology and Erosion Model Tool (DRHEM), Version 2.0. http://apps.tucson.ars.ag.gov/drhem/
USDA/USFS. 2007. Ecological Subregions: Sections and Subsections for the Conterminous United
States. Washington, DC: USDA - Forest Service.
USDA/SCS. 1977. Rangeland Resources of Nebraska. Lincoln, NE: Society for Range Management. USDA/NRCS. 2011. ESD User Guide. Fort Worth, TX: Central National Technology Support
Center.
USDA/NRCS. 2003. National Range and Pasture Handbook. Fort Worth, TX: Grazing Lands
Technical Institute.
USDA/NRCS. 2012a. Field Office Technical Guide (Nebraska, Natural Resources Information, Statewide Soil and Site Information, Rangeland Interpretations, Nebraska Range Site Descriptions – Vegetative Zone 4), U.S. Department of Agriculture, Natural Resources Conservation Service, Nebraska Ecological Sciences.
USDA/NRCS. 2012b. Field Office Technical Guide (Kansas, Natural Resources Information, Ecological Site Descriptions, Range Sites), U.S. Department of Agriculture, Natural Resources Conservation Service, Nebraska Ecological Sciences.
USDA/NRCS 2006. Land Resource Regions and Major Land Resource Areas of the United States, the Caribbean, and the Pacific Basin. U.S. Department of Agriculture Handbook 296.
Contributors
Doug Whisenhunt
Stu McFarland
Acknowledgments
Thank you to Mark Moseley, David Kraft and Nadine Bishop for your assistance in refining and reviewing this document.
Rangeland health reference sheet
Interpreting Indicators of Rangeland Health is a qualitative assessment protocol used to determine ecosystem condition based on benchmark characteristics described in the Reference Sheet. A suite of 17 (or more) indicators are typically considered in an assessment. The ecological site(s) representative of an assessment location must be known prior to applying the protocol and must be verified based on soils and climate. Current plant community cannot be used to identify the ecological site.
| Author(s)/participant(s) |
Stu McFarland Doug Whisenhunt |
|---|---|
| Contact for lead author | doug.whisenhunt@ne.usda.gov |
| Date | 01/28/2014 |
| Approved by | Nadine L Bishop |
| Approval date | |
| Composition (Indicators 10 and 12) based on | Annual Production |
Indicators
-
Number and extent of rills:
None -
Presence of water flow patterns:
Little to no soil deposition or erosion; however, short, unconnected patterns may appear as slope approaches the upper limit for the site. -
Number and height of erosional pedestals or terracettes:
None; however, minor erosional features may appear as slope approaches the upper limit for the site. -
Bare ground from Ecological Site Description or other studies (rock, litter, lichen, moss, plant canopy are not bare ground):
>95% of the ground is covered by plant canopy, litter, and/or coarse fragments. Following fire, much less litter/canopy the subsequent growing season is to be expected. -
Number of gullies and erosion associated with gullies:
None; or if present, headcut and sides are vegetated and stable. -
Extent of wind scoured, blowouts and/or depositional areas:
None -
Amount of litter movement (describe size and distance expected to travel):
Plant litter is distributed evenly throughout the site; however, heavy rainfall may move herbaceous and small woody litter short distances as slope approaches the upper limit for the site. -
Soil surface (top few mm) resistance to erosion (stability values are averages - most sites will show a range of values):
Interspatial stability class rating 6 -
Soil surface structure and SOM content (include type of structure and A-horizon color and thickness):
A mollic epipedon is present. Refer to the Official Series Description for the range of characteristics of site-specific soils. -
Effect of community phase composition (relative proportion of different functional groups) and spatial distribution on infiltration and runoff:
No negative effect due to plant composition or distribution. Plant canopy intercepts the majority of raindrops. Robust root structure, litter production, and decomposition process maximize infiltration and minimize overland flow. -
Presence and thickness of compaction layer (usually none; describe soil profile features which may be mistaken for compaction on this site):
None; Bt horizons will have finer textures and higher bulk density, but not a platy structure. -
Functional/Structural Groups (list in order of descending dominance by above-ground annual-production or live foliar cover using symbols: >>, >, = to indicate much greater than, greater than, and equal to):
Dominant:
Tall warm-season bunchgrass - Big bluestem, indiangrass, switchgrassSub-dominant:
Mid warm-season bunchgrass - Sideoats grama, little bluestem, composite dropseedOther:
Minor (grasses) - Canada or Virginia wildrye, Scribner panicum, sedges
Minor (forbs) - black sampson, compassplant, fleabane, dotted gayfeather, heath aster, slimflower scurfpea, spiderwort, western ragweed
Minor (shrubs) - leadplant, Arkansas rose, coralberryAdditional:
-
Amount of plant mortality and decadence (include which functional groups are expected to show mortality or decadence):
The vast majority of plants are healthy and vigorous. There is no significant restriction to plant regeneration due to litter depth or standing dead biomass. -
Average percent litter cover (%) and depth ( in):
When prescribed burning is practiced, there may be very little litter the first half of the subsequent growing season. -
Expected annual annual-production (this is TOTAL above-ground annual-production, not just forage annual-production):
Production ranges from 2,975 – 5,440 lbs/ac (air-dry weight) depending on climatic conditions. The reference representative value production is 4,250 lbs/ac (air-dry weight). -
Potential invasive (including noxious) species (native and non-native). List species which BOTH characterize degraded states and have the potential to become a dominant or co-dominant species on the ecological site if their future establishment and growth is not actively controlled by management interventions. Species that become dominant for only one to several years (e.g., short-term response to drought or wildfire) are not invasive plants. Note that unlike other indicators, we are describing what is NOT expected in the reference state for the ecological site:
Annual sunflower, fall witchgrass, kochia, little barley, silver bluestem, tansy mustard, Japanese brome, wild lettuce, common mullein, woolly verbena, windmill grass, smooth brome, tall fescue, eastern redcedar, bur oak, Osage orange, roughleaf dogwood, and honey locust. -
Perennial plant reproductive capability:
Desirable perennial plants are healthy. The vast majority of perennial plants have healthy root systems that produces many rhizomes. Vegetative and reproductive structures are not stunted.
Print Options
Sections
Font
Other
The Ecosystem Dynamics Interpretive Tool is an information system framework developed by the USDA-ARS Jornada Experimental Range, USDA Natural Resources Conservation Service, and New Mexico State University.
Click on box and path labels to scroll to the respective text.